No matter the content marketing strategy you choose, you will always need to assess its impact. Otherwise, you’re basically taking a shot in the dark.
But you also don’t want to track all possible metrics at once. That would be almost as bad as not tracking anything at all.
In this guide, we’re going to take a good look at various content marketing success metrics. We’ll go over what makes them important for businesses, and then find out which metrics to focus on when measuring and reporting results.
TL;DR
Content marketing metrics are performance indicators that you can use to measure how effective your content-related activities have been. Tracking these metrics keeps you aware of how well your content strategy is paying off so you can adjust it if needed.
Some major SEO metrics that you should track include organic search traffic, impressions, CTR, keyword rankings, average position, backlinks search, visibility, and content score.
To analyze user behavior & engagement relative to your content, you’ll need to monitor metrics like average engagement time, average engagement rate, bounce rate, pages per session, percentage of new sessions, and social media engagement.
Some key metrics related to conversions and sales are conversion rates and return on investment from content marketing.
What Are Content Marketing Metrics?
Content marketing metrics are benchmarks that you can use to track the progress and impact of your content marketing strategy.
For example, maybe you’re trying to understand how people engage with various content types. Or, maybe you need to assess how the leads you generate through social media convert. Or, maybe you simply want to know how much traffic your blog posts are generating. You can find answers to all of these questions by analyzing specific metrics for content marketing.
But you still don’t want to analyze all metrics that come into your sight. This can do more harm than good because it wastes valuable resources on gathering and analyzing unfiltered data, which is largely irrelevant or useless.
In short, you absolutely must set clear marketing goals before doing anything else. Only then will you be able to accurately determine which content metrics to track.
The Importance of Setting Content Marketing Goals
Don’t expect to achieve business success without a clear roadmap and predefined goals. Your content marketing goals are also sure to suffer if you take this route.
Setting practical goals helps you create a step-by-step action plan that you can use as a guideline for tracking SEO metrics and KPIs.
Also, be sure to use our free content strategy template. It will guide you through the entire content creation process.
Now, let’s say one of your goals is to increase both user engagement and time spent on your website. In an effort to achieve it, you create more interactive content, such as quizzes, surveys, calculators, etc. Given the goal you have and the initiatives you’ve already taken, you’ll need to focus on metrics such as feature interaction count, session duration, bounce rate, CTR, pages per session, and social shares.
In short, the first step in creating your content marketing strategy is to set relevant, actionable, and easy to measure goals.
Metrics for Measuring Visibility (aka SEO Metrics)
You can’t engage and convert users if they can’t find and access your content. That’s why you need to optimize it for search engines. This is where SEO enters the picture.
Monitoring your content’s SEO metrics gives you valuable insights into its ranking, impressions, CTRs, and visibility. You’ll also get a birds-eye view of the performance of your content marketing initiatives.
Organic Search Traffic
To track your organic traffic, start by reviewing your Google Analytics 4 reports.
Pay special attention to the Pages and Screens report under the Engagement section. It provides insights into the pages on your website that users have accessed. It also shows the screens they’ve viewed on your mobile app. Apply the Google/Organic filter (located at the top of the screen) to determine which pages generated a great deal of organic traffic over a selected timeframe and which did not.
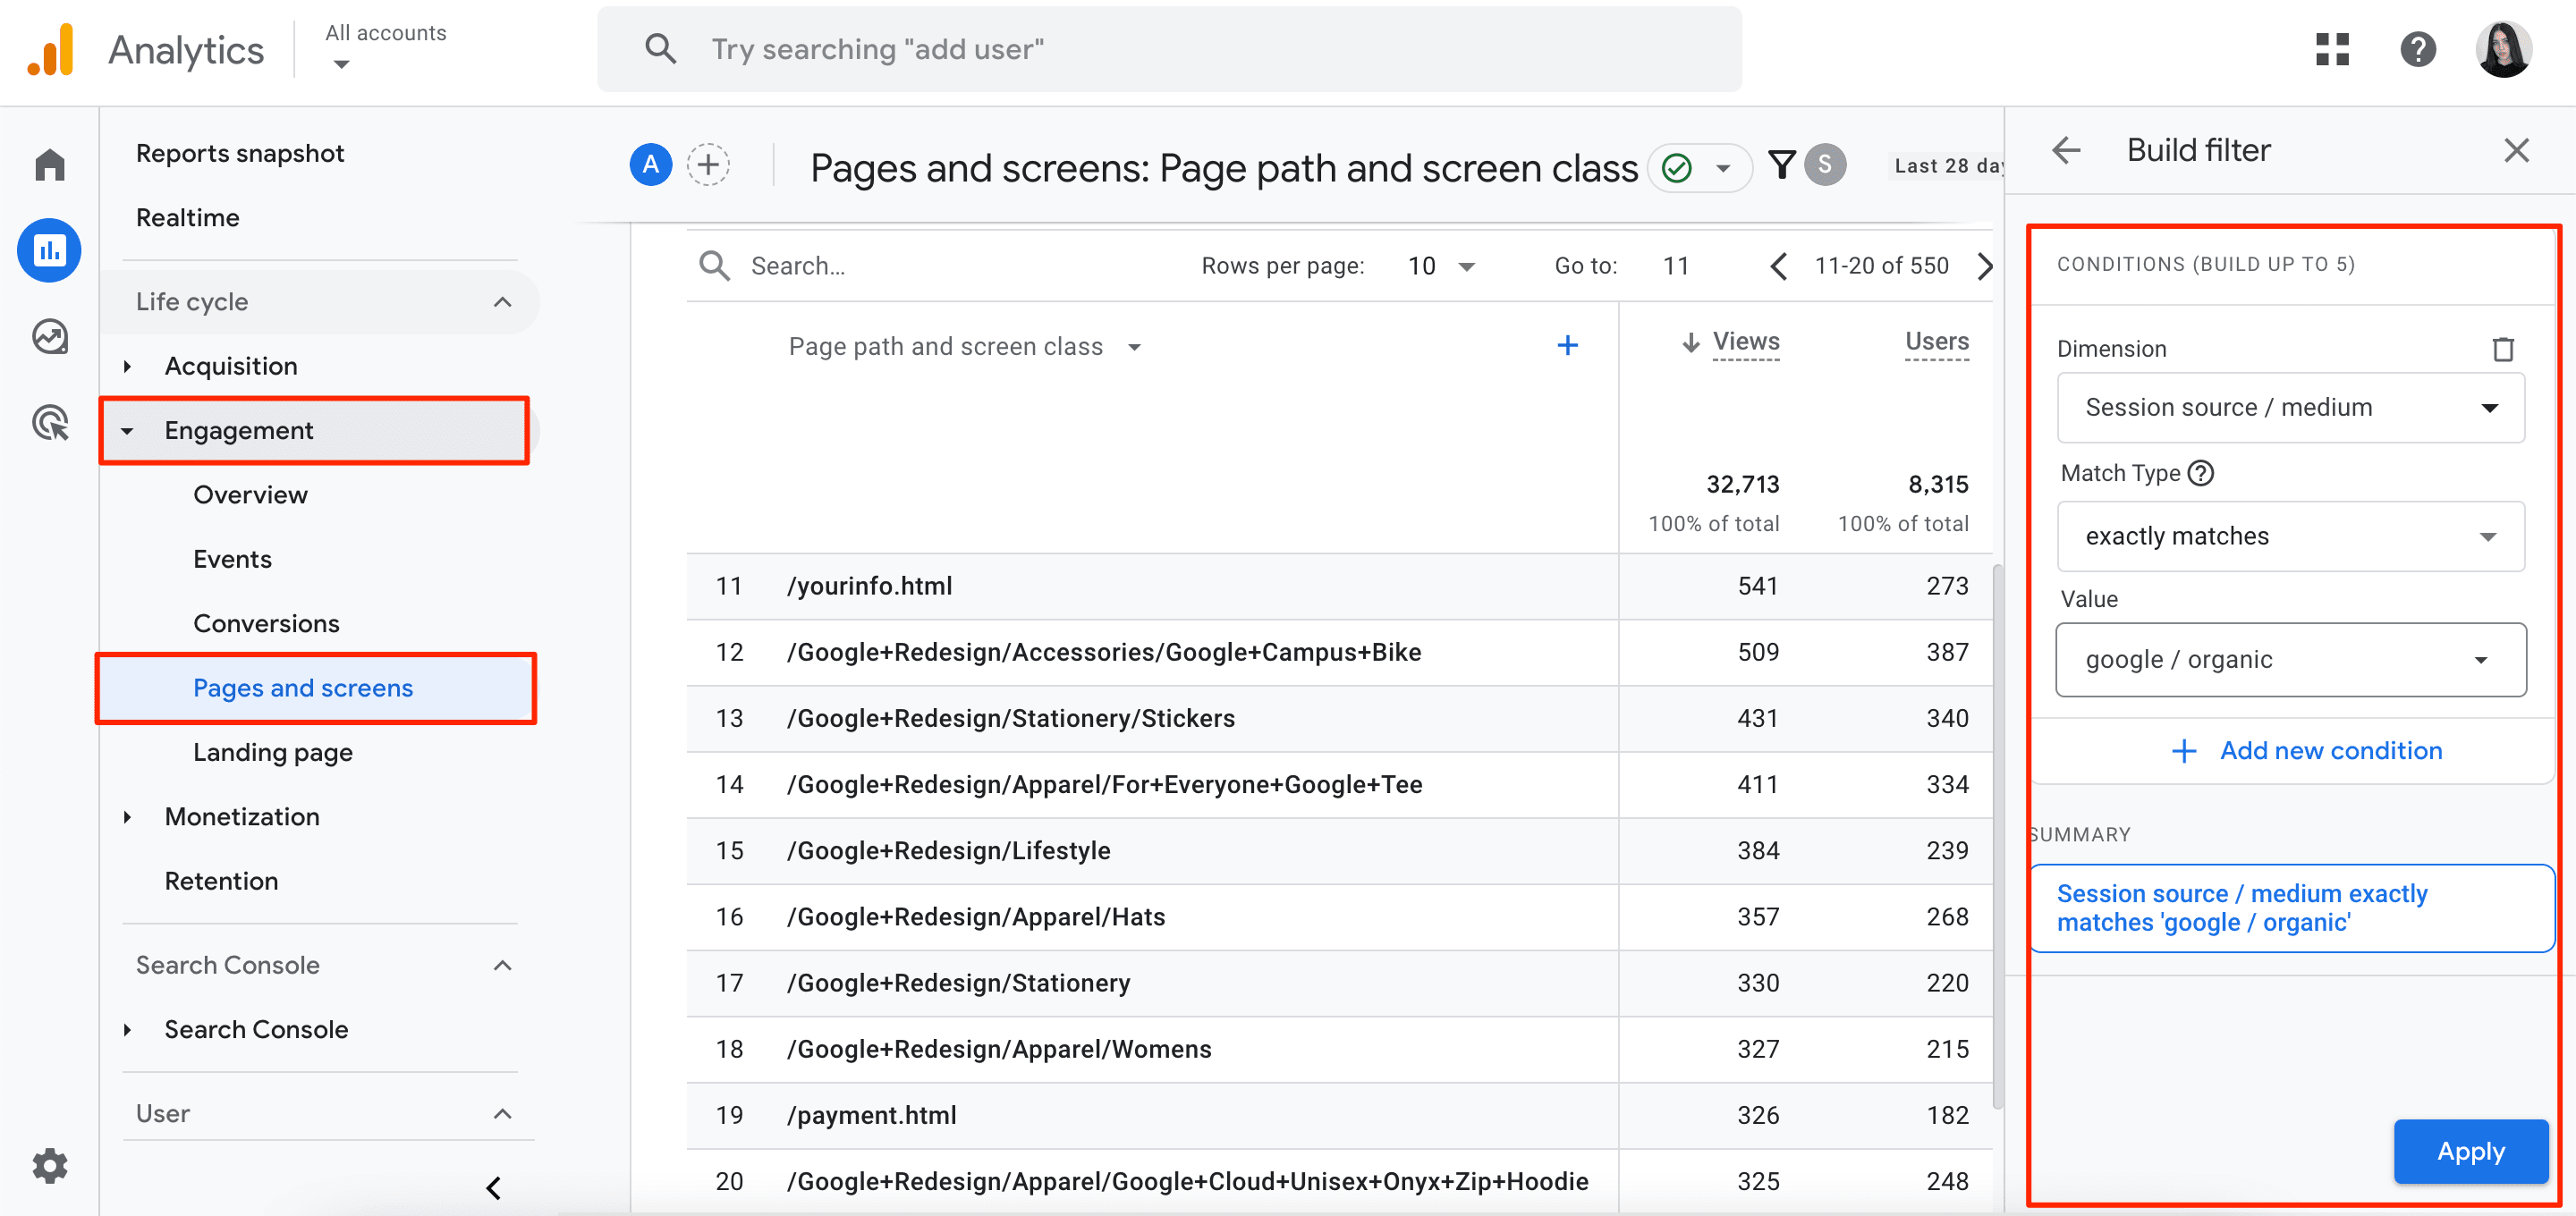
To find out how your on-page and off-page SEO efforts impact user behavior, check out our guide on how to use GA4 for SEO purposes.
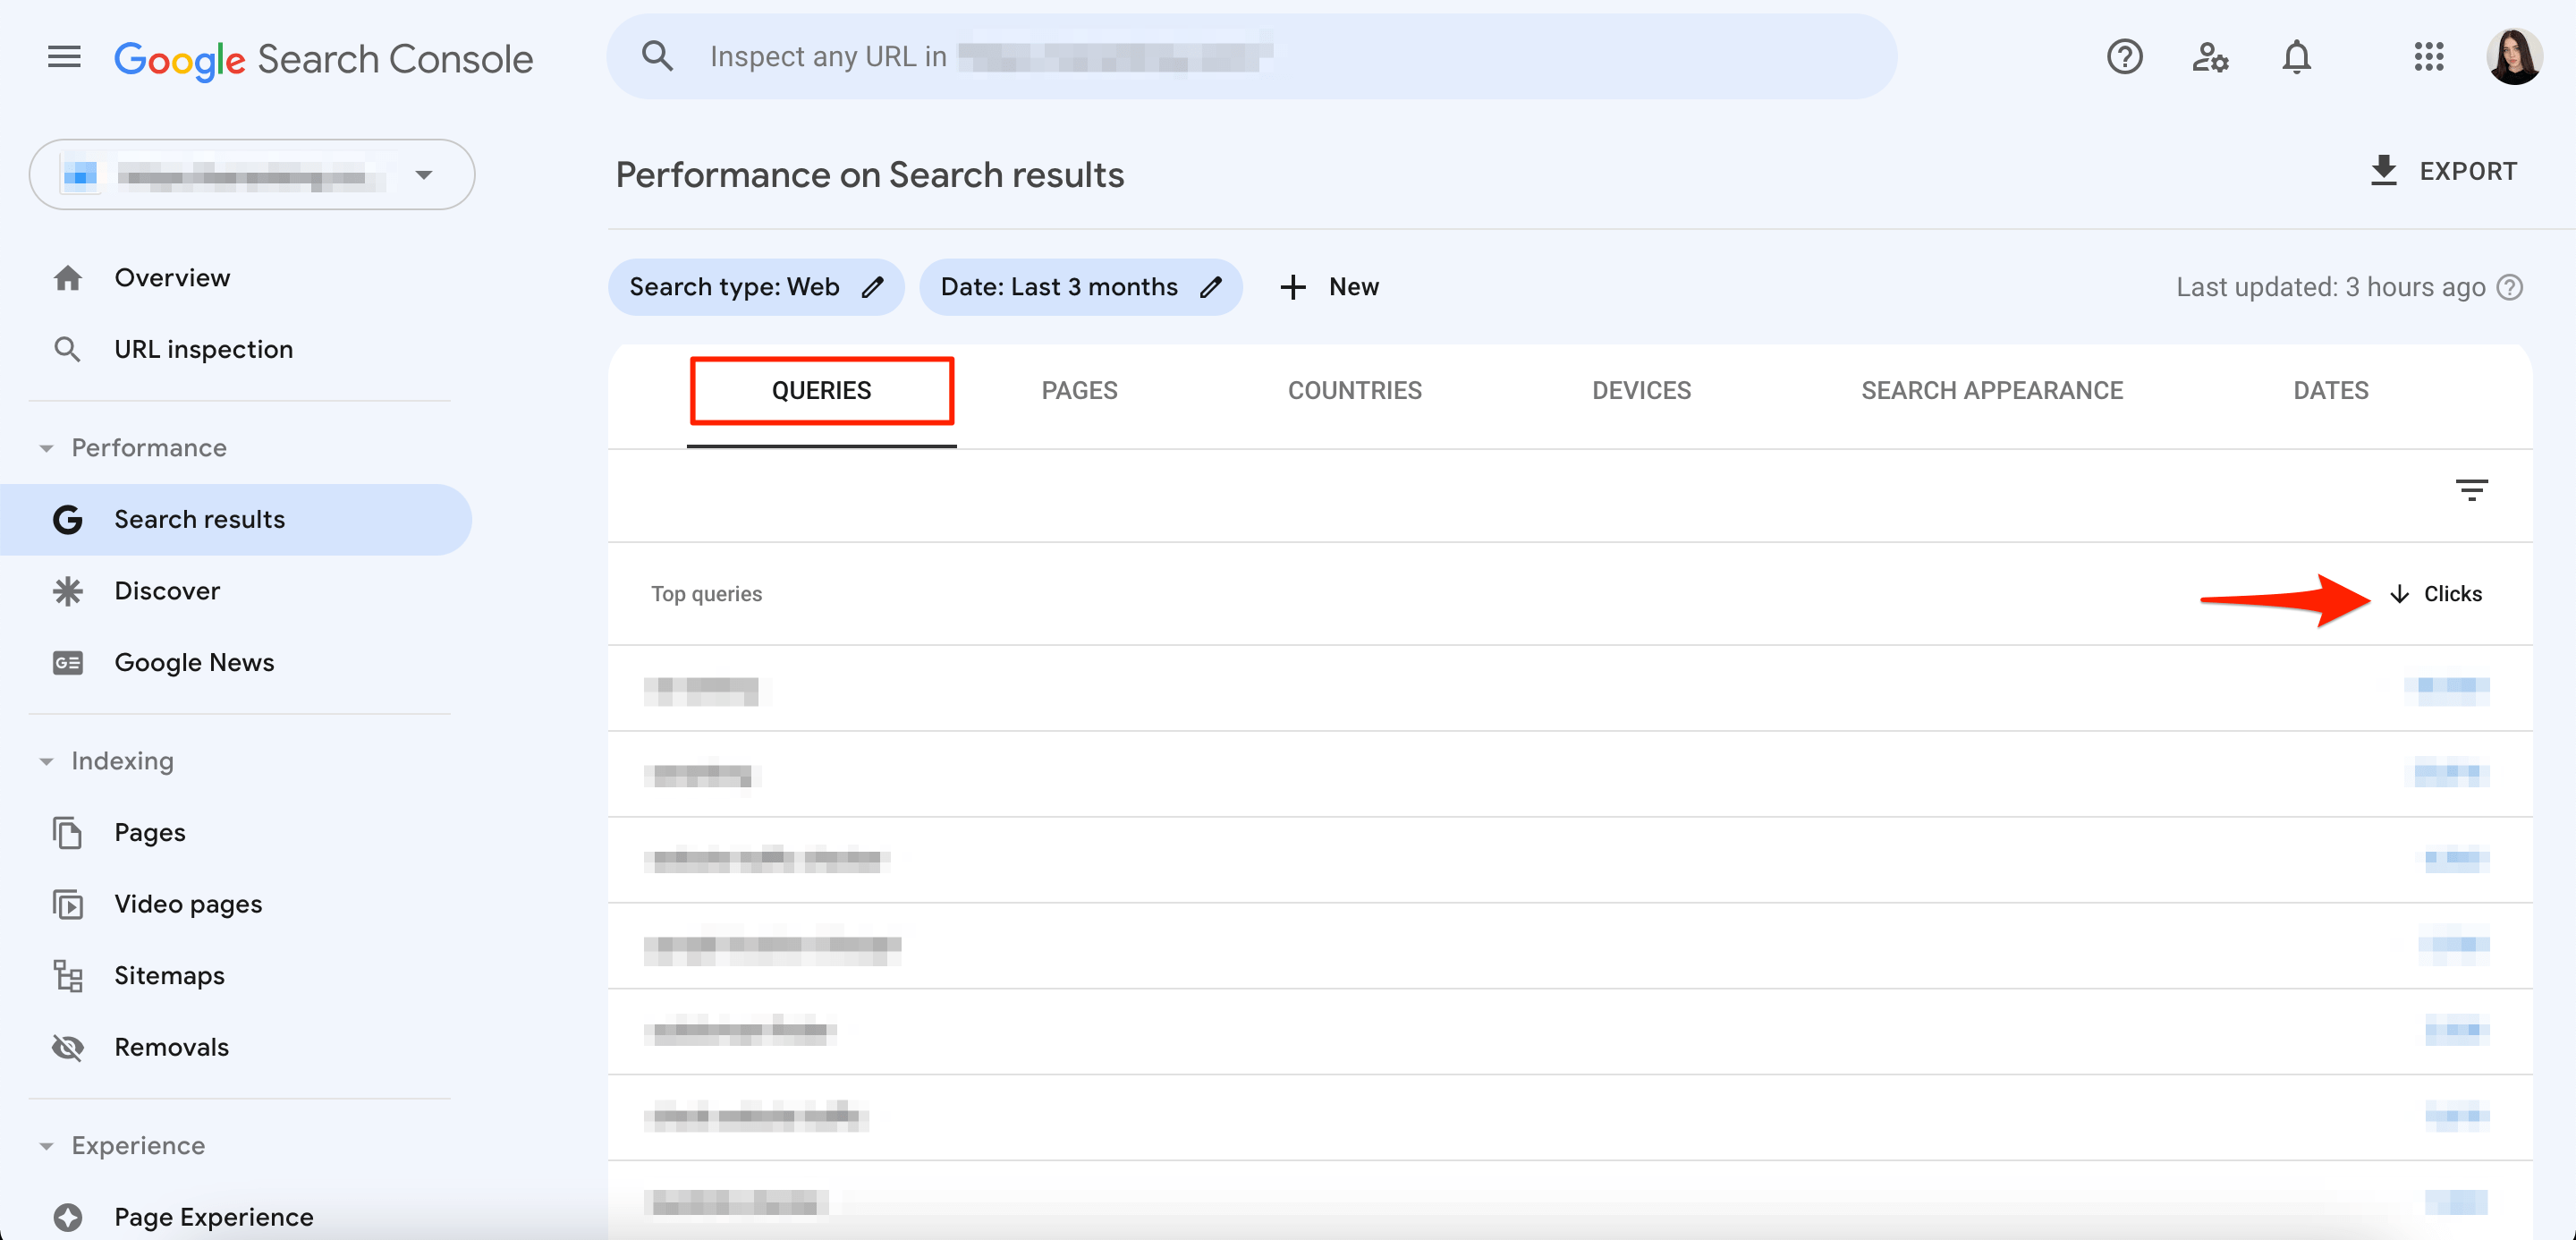
To access data both on organic clicks and the keywords your website ranks for, check out Google Search Console’s reports. After opening the Search Results section, select the Query tab to specify your **** range. Click on the Total Clicks metric and scroll down to the list of queries. Now click on the Clicks column to sort them from highest to lowest. This allows you to see which search queries drive the most traffic to your website.
For a more detailed analysis of your website’s organic search performance, try specialized SEO tools like SE Ranking’s website traffic checker.
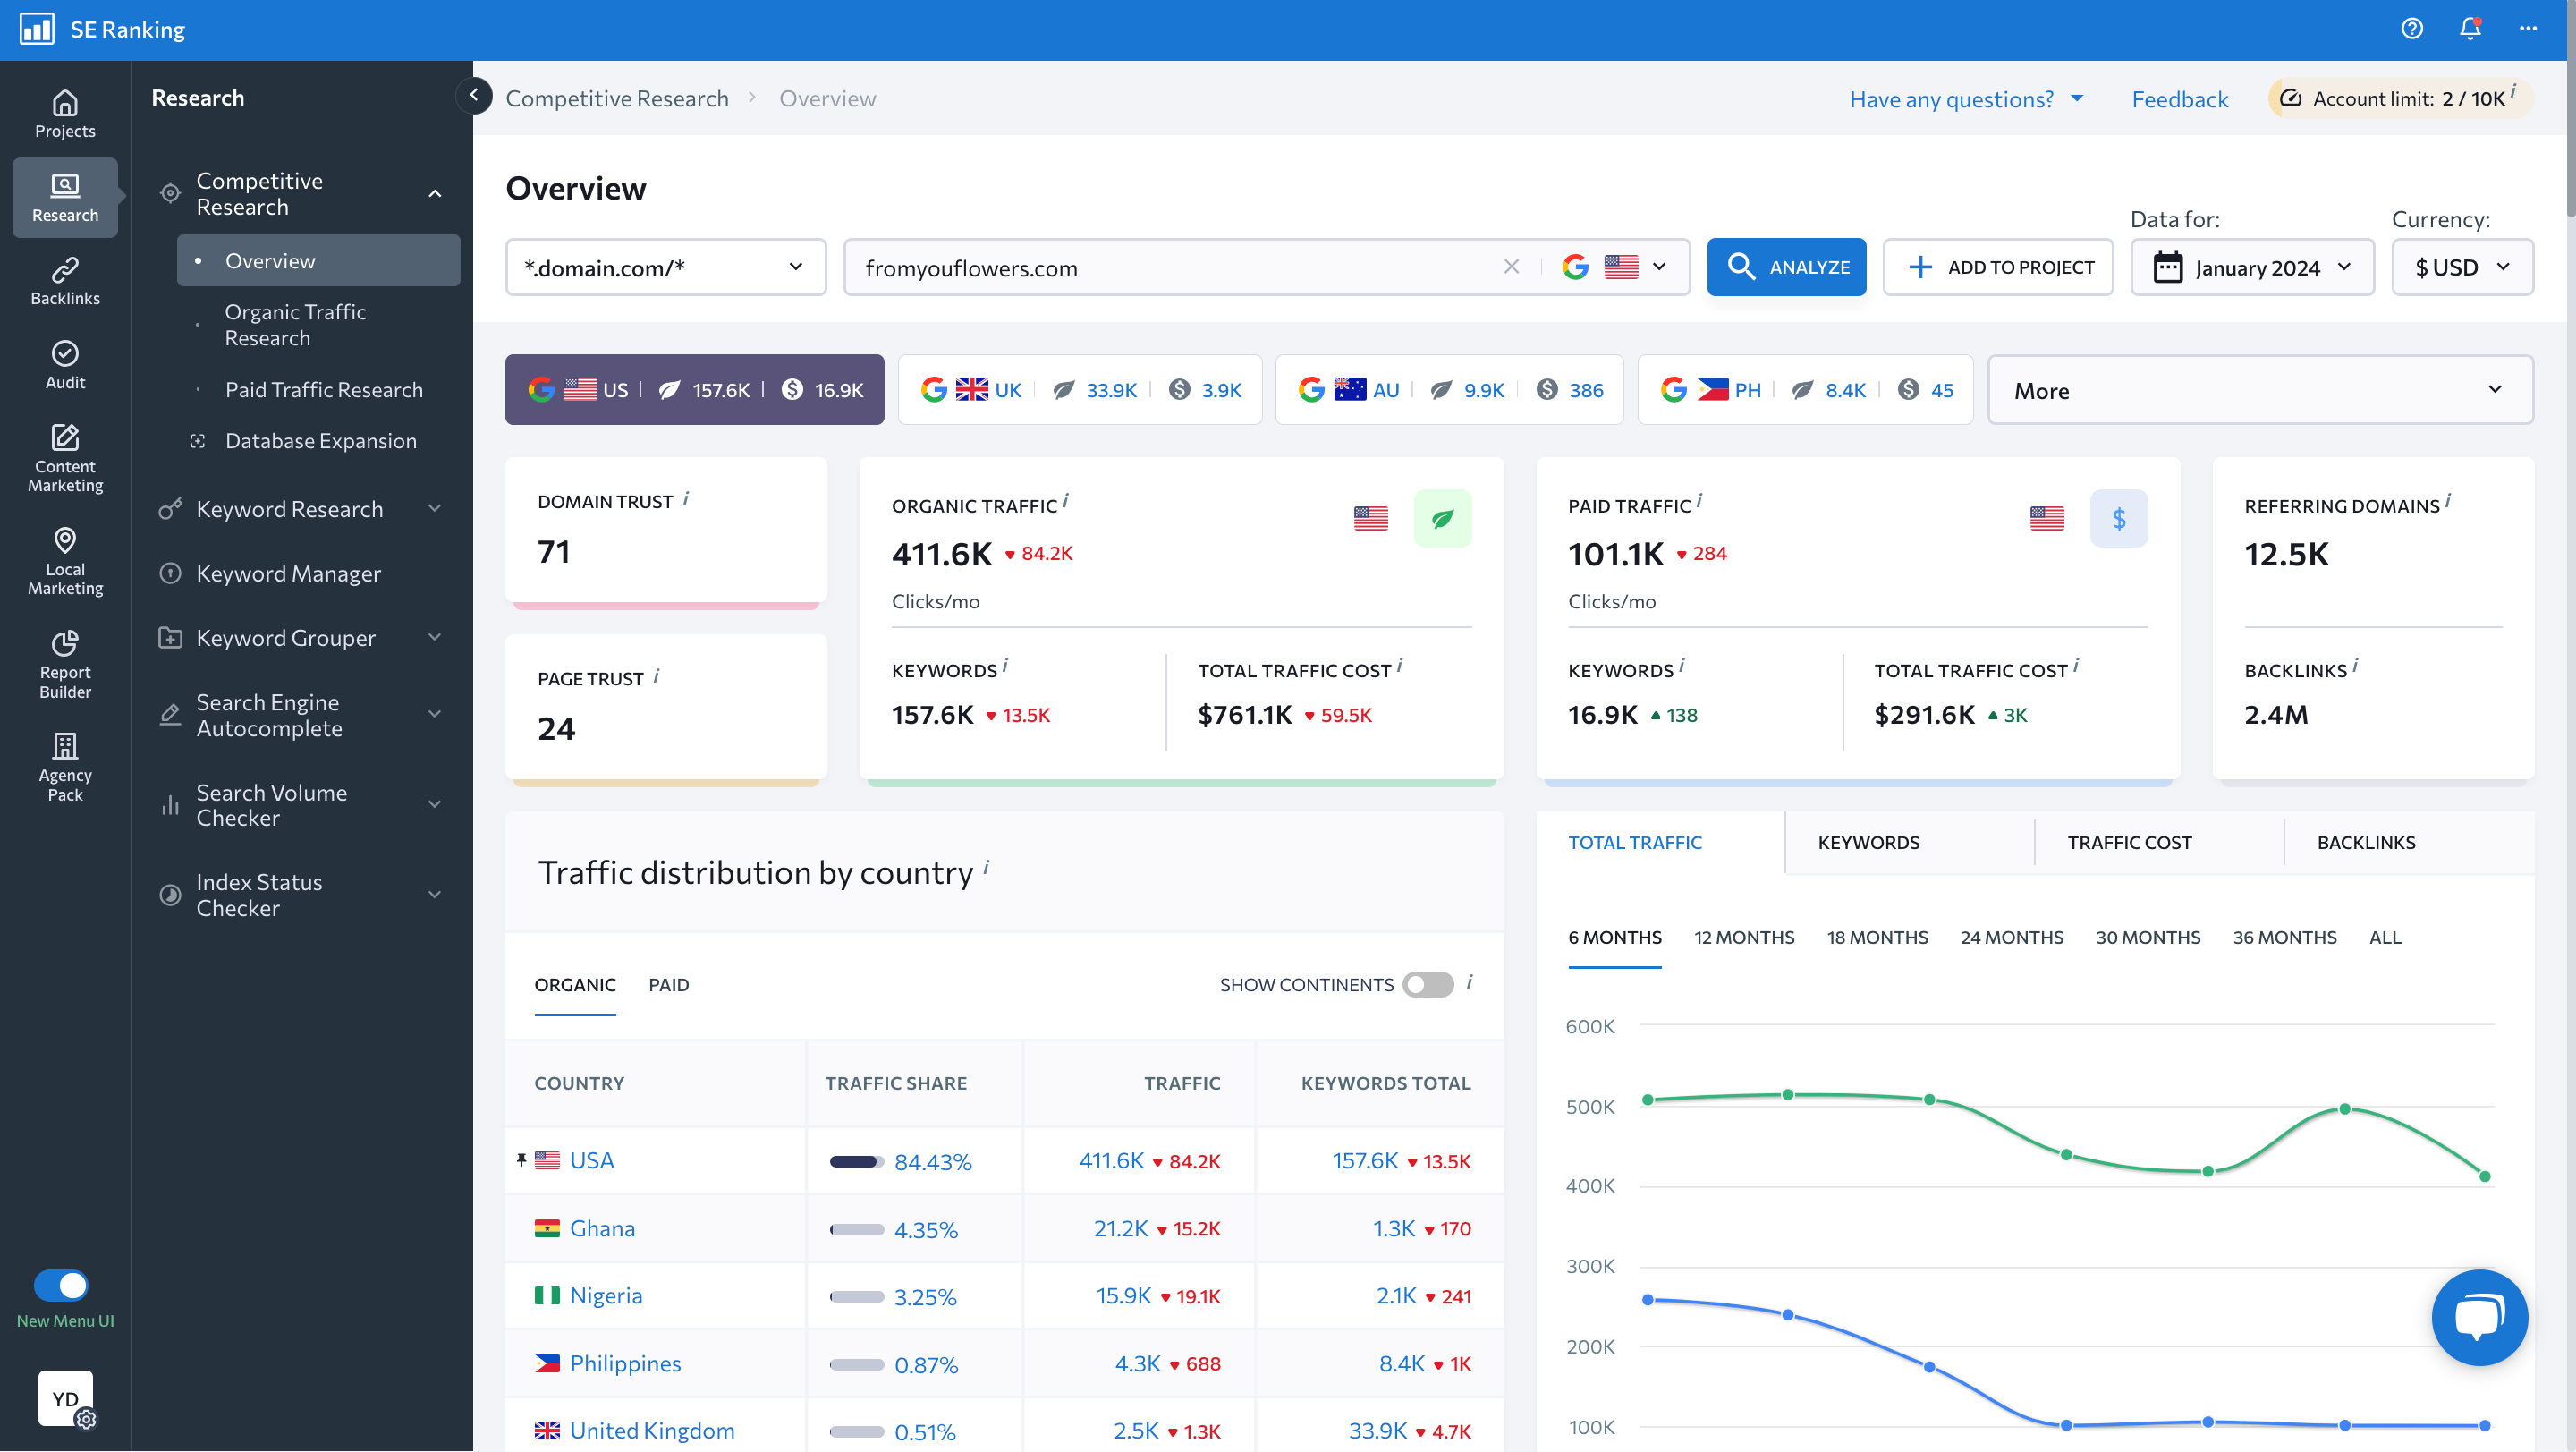
Launching analyses through this tool gives you comprehensive insights into:
- The estimated number of clicks the analyzed domain/URL will receive.
- The total number of keywords that the analyzed domain/URL ranks for in organic search.v
- The traffic distribution by country.
- Your keywords’ ranking dynamics.
- The search intent behind each keyword, the traffic count generated by them, and more.
- Your site’s top organic competitors.
- The pages on your site with the largest volume of organic traffic.
In essence, this tool allows you to:
- Track your organic performance over time.
- Discover the content your audience prefers.
- Find out which keywords lead organic traffic to your website.
- Investigate the sources of your traffic.
- Discover causes for traffic drops on your site.
- Create custom organic performance reports for your team or clients.
You can also pull data from GA4 and GSC and integrate it with this tool. This gives you a centralized overview of your website’s organic search performance.
Impressions & CTR
Conduct a unified analysis of these key metrics instead of tracking them separately.
So, for example, if you see that your webpage has a high number of impressions and a low CTR, this indicates potential metadata issues. To encourage more clicks, consider rewriting the URL’s meta title and/or meta description.
Google Search Console’s Performance report feature displays the overall performance of your website on SERPs. It’s used to find data on the following four metrics: impressions, clicks, CTR, and the average position of every URL on your website.
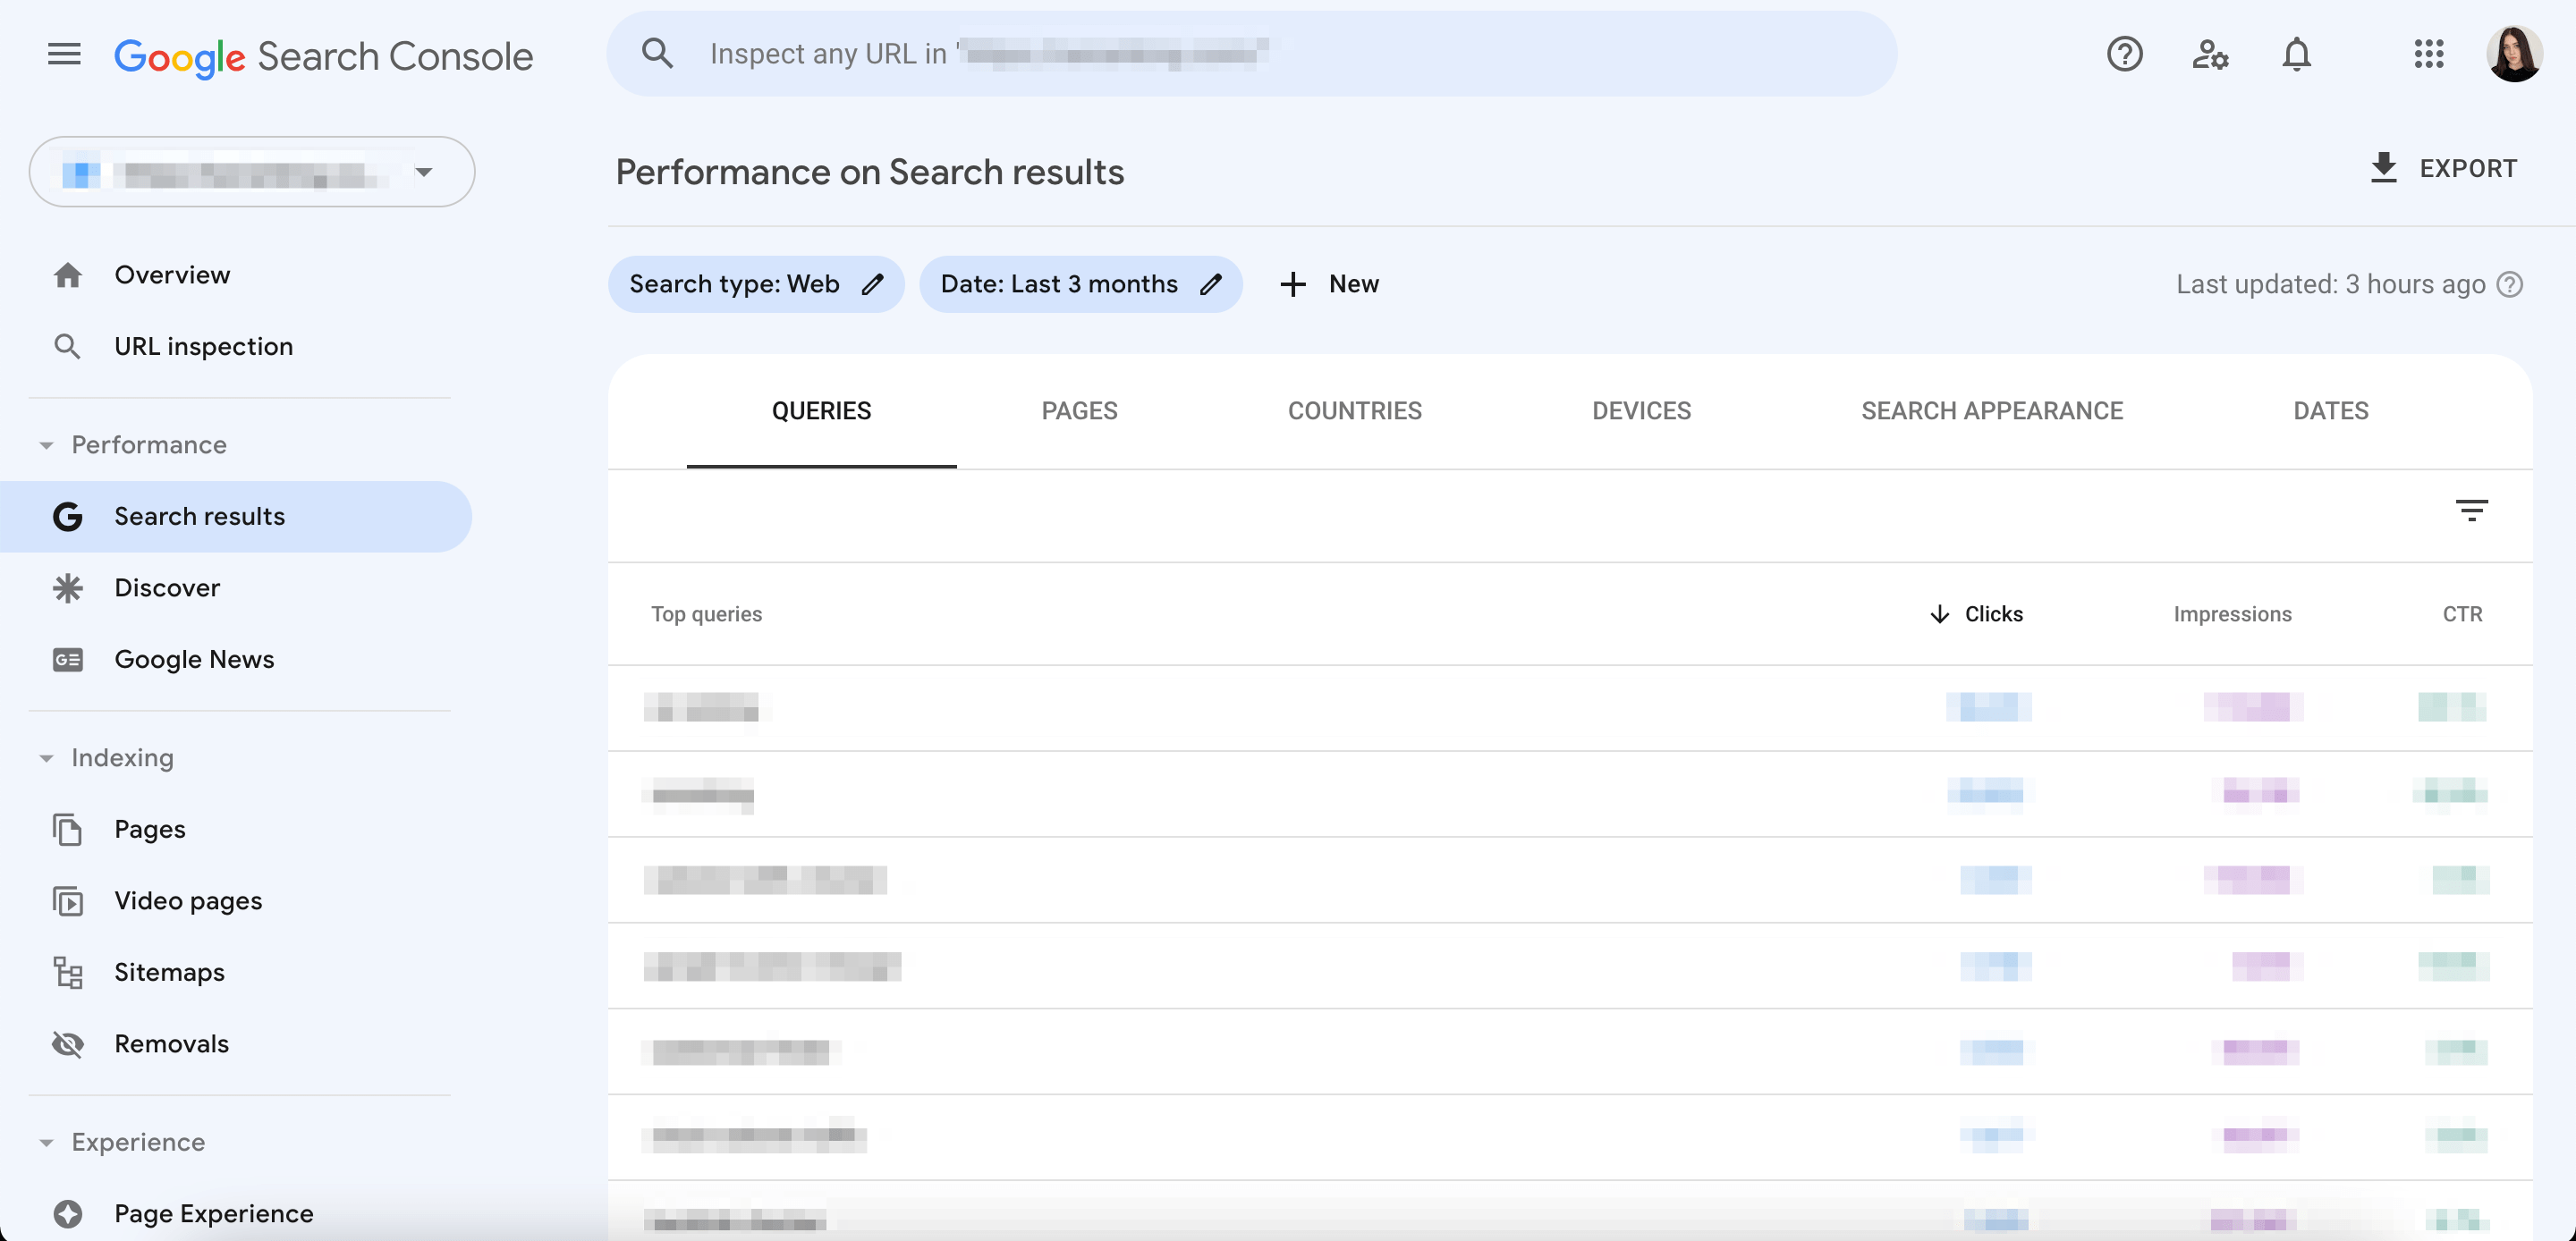
Filter and compare the data by queries, pages, countries, devices, search appearance, and dates. This will provide you with diverse data for better content marketing analysis and reporting.
To enhance your CTR, spend time comparing your SERP snippets to those of your rivals. This will help you identify and fix the issue.
Here is our GSC tutorial that will teach you how to use the tool’s reports for SEO purposes.
Keyword Rankings
You can also use GSC to monitor the keyword rankings of your entire website and those of individual pages. This metric gives you an idea of which content to optimize first in order to achieve higher SERP rankings.
More specifically, the keywords your website/URL ranks for are featured in the Queries dimension of the Performance Report. This is where you can find the top 1,000 search queries and sort them by their clicks and impressions.
But GSC only stores data for up to 16 months. This makes long-term trend analysis difficult. It can also take data several days to appear in reports.
You also likely won’t need data on hundreds or thousands of keywords. It’s best to focus on a smaller group of focus keywords with higher traffic potential. Using tools like SE Ranking’s Keyword Rank Checker makes it easier to tailor and monitor specific keywords together with essential SEO data on their performance.
More specifically, this tool allows you to check up to 100 locations per project for each of your target keywords. You can also use it to track rankings on Google (both on desktop and mobile), Bing, Yahoo, and even YouTube.
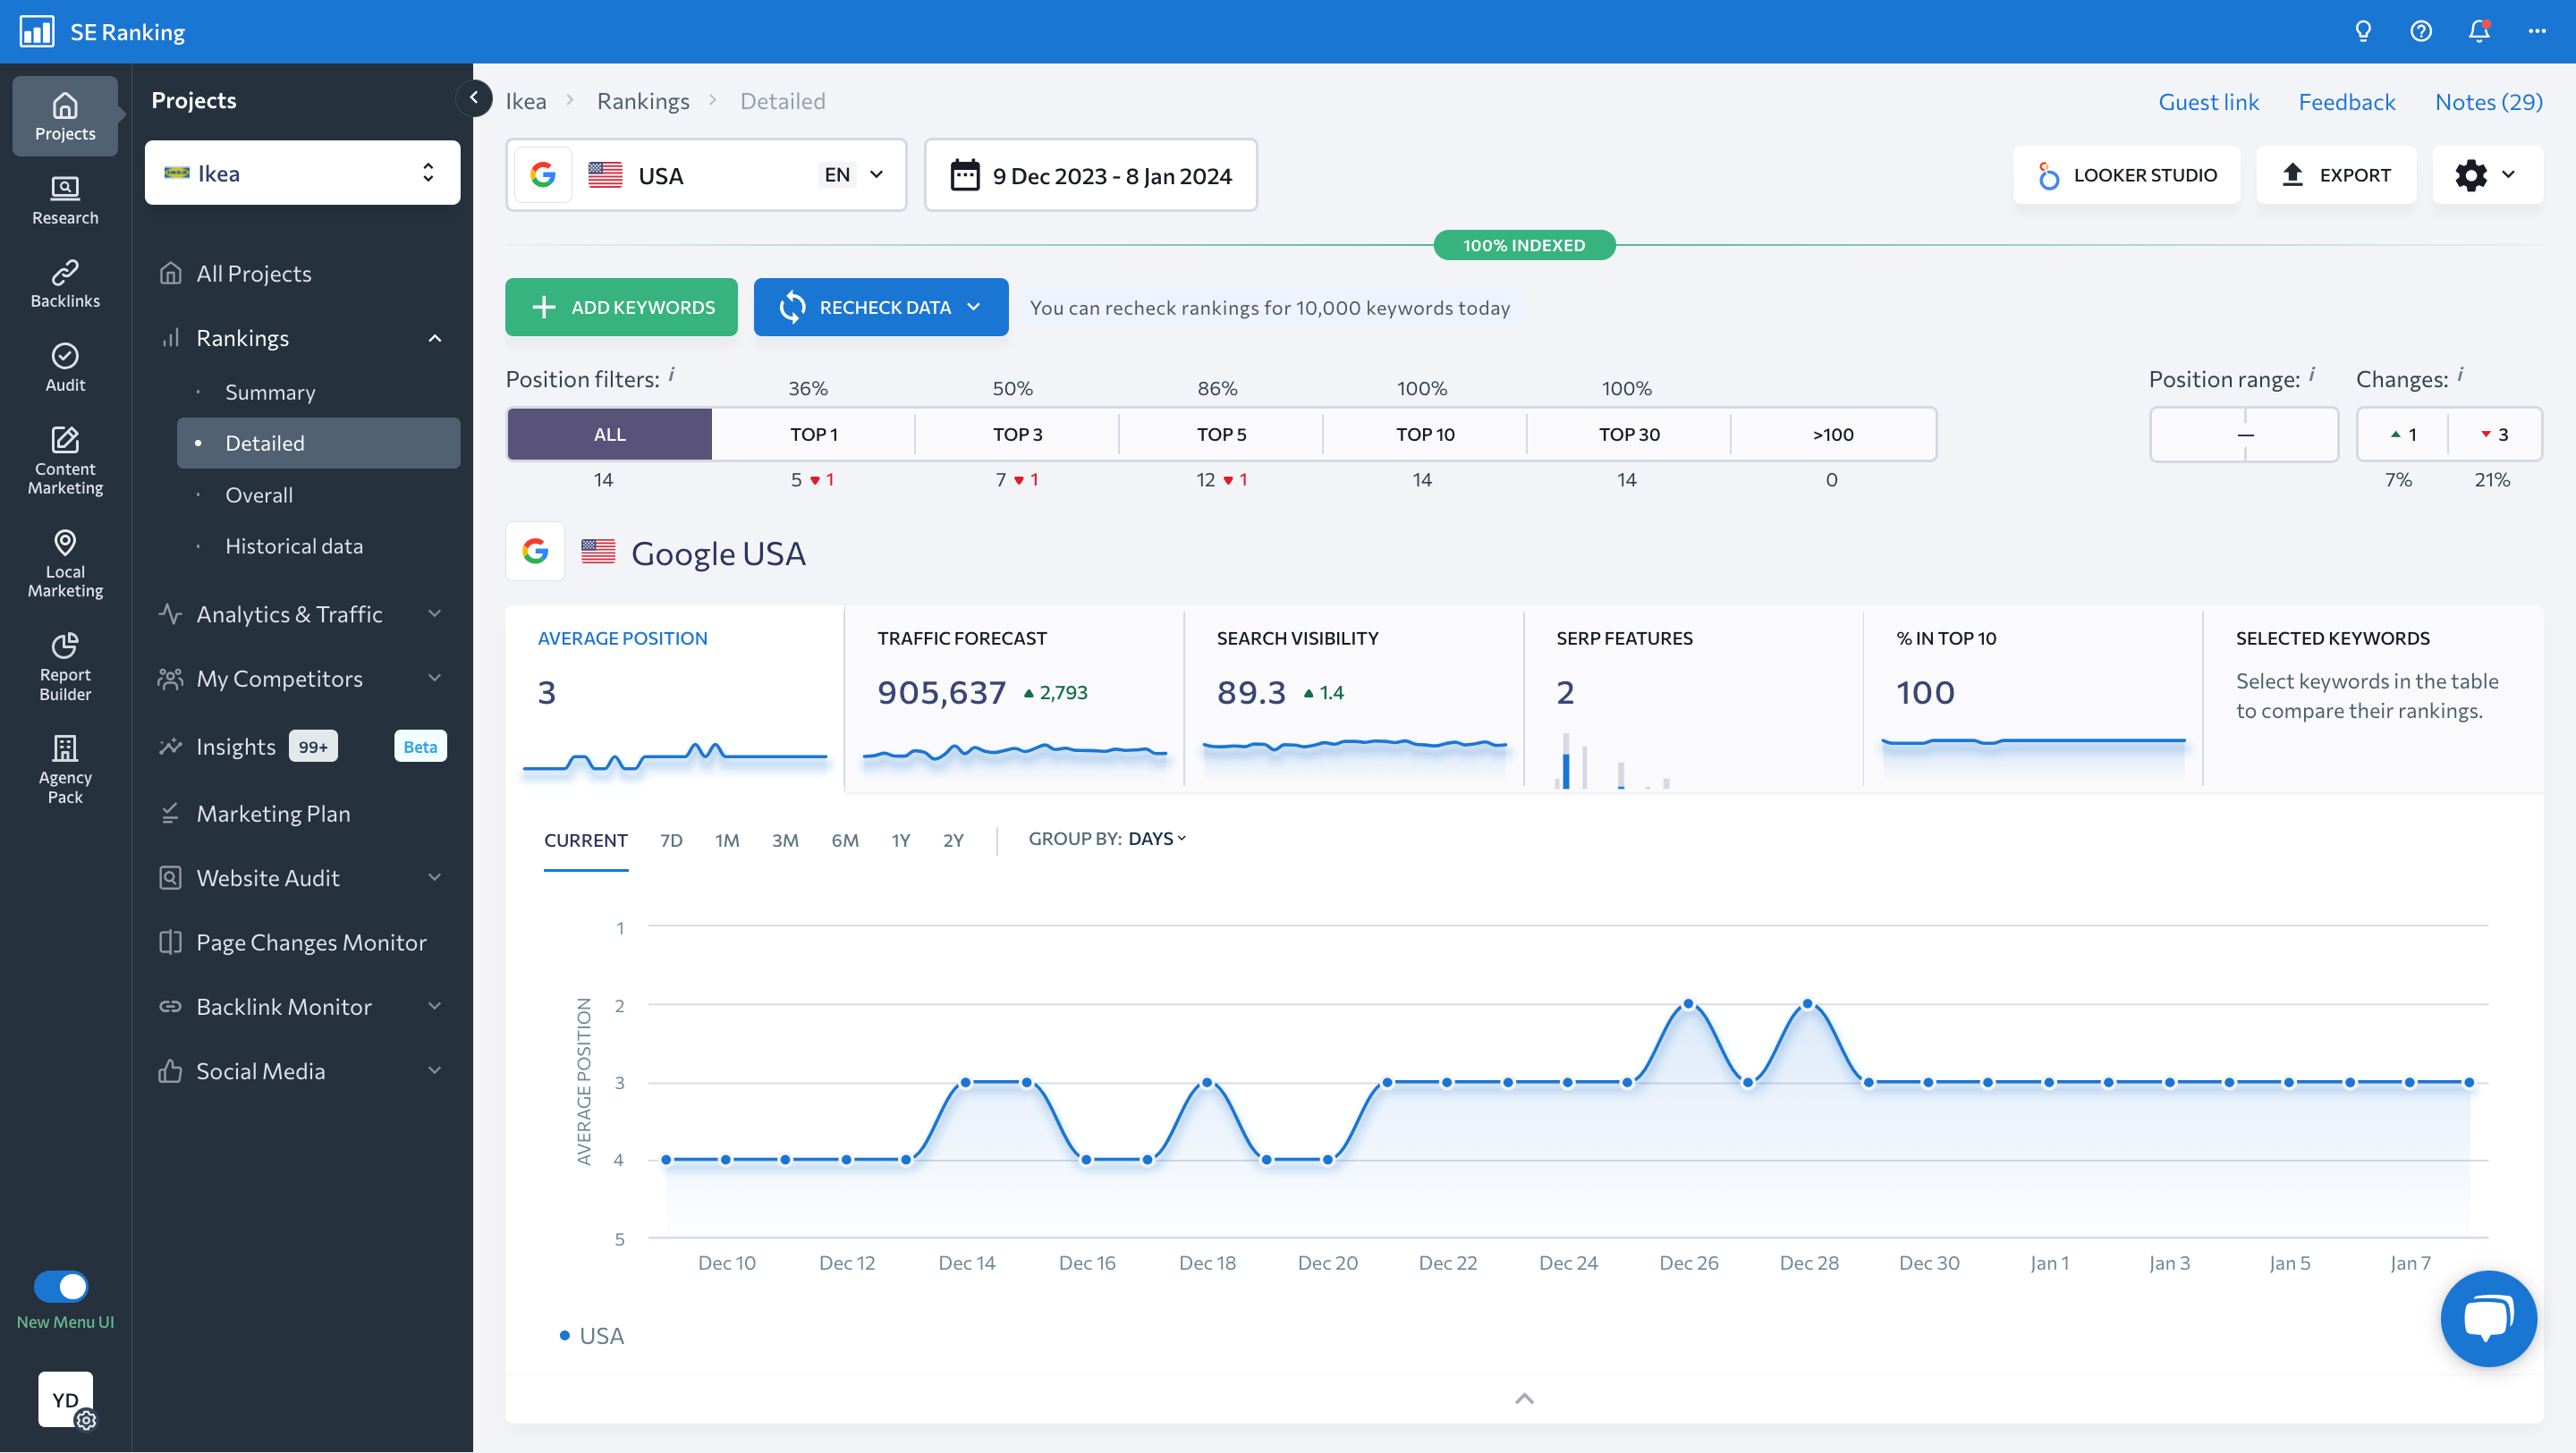
This tool stands out from GSC and other rank tracking solutions because it updates keyword ranking data daily. It also has an efficient grouping and tagging feature that makes it easier to manage bulky projects with huge keyword lists. This traffic checker even lets you generate automatic reports that you can share with your clients and team members.
These reports provide valuable data on:
- The keywords and pages that bring the most traffic to your site.
- The average position of all given keywords.
- Keyword data like search volume, ranking dynamics, traffic forecast, content score, etc.
- Pages suffering from keyword cannibalization.
- Other sites targeting the same keywords as you.
- Share of search queries ranking in the top 10.
Backlinks
Backlinks are signals used by Google to determine if your content is high-quality and useful. The more reputable the backlinks you receive, the more authoritative your content will be according to search engines. Backlinks also indicate that people (not just Google) value your content.
This is why you should monitor the backlinks pointing to your website. Doing so is a reliable way to assess your website’s legitimacy. SE Ranking’s Backlink Checker makes it easy to identify both new and lost links. It provides you with essential SEO metrics, including domain/page trust, link type, and whether the page is nofollow/dofollow.
Just enter the domain name to launch the analysis. The system will provide you with data on:
- Domains pointing to the analyzed domain/URL.
- Content with the most backlinks.
- Active, new, and lost links with additional SEO data.
- Toxic and broken links.
- Top anchor texts and their count.
- Top countries linking to the analyzed domain/URL.
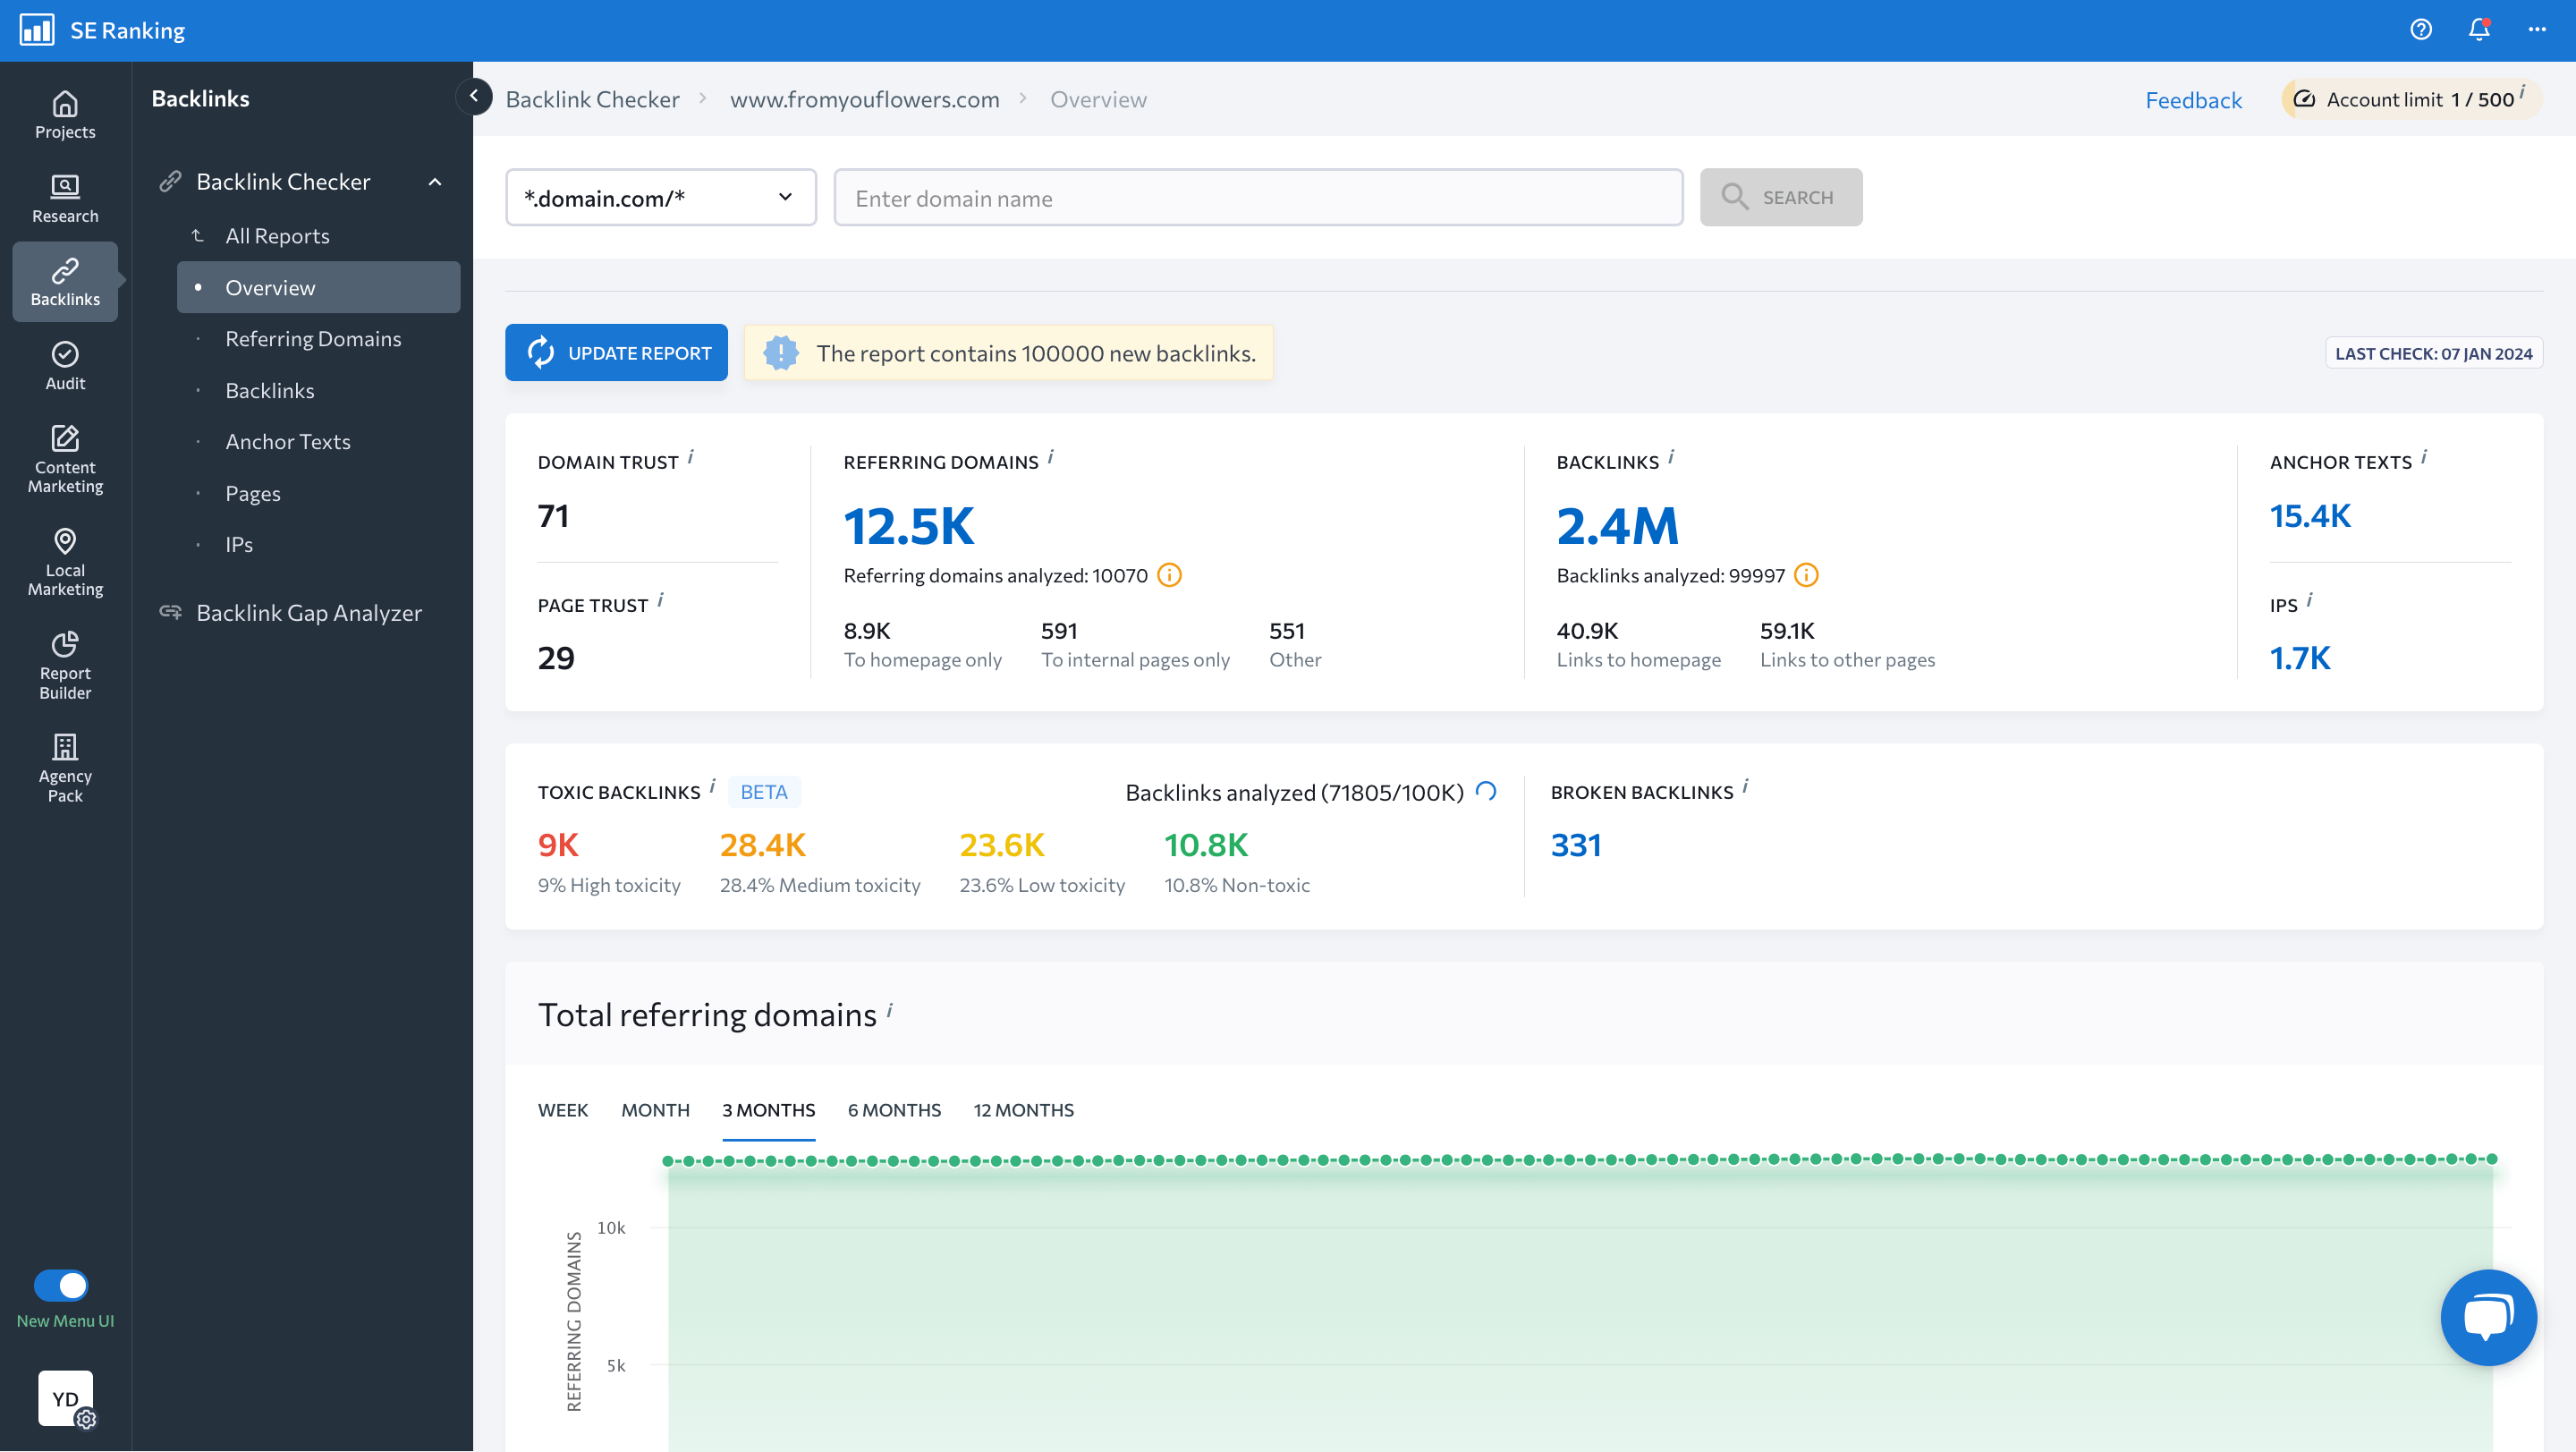
The Backlink Checker also helps you understand which content people link to most often. You can use this data to learn more about what patterns work (e.g., topic, structure, type) and then focus on generating similar content.
Search Visibility
Search visibility refers to the share of traffic a website gets for a given search query in search results. SE Ranking has developed its own unique algorithm for calculating search visibility. It assigns a particular number of points to each keyword depending on the site’s SERP position. The higher the ranking, the higher the score. This allows us to predict how likely a certain webpage is to attract a specific target audience and generate leads.
In a perfect world, we would all be striving to achieve a 100% search visibility score. But we don’t live in that world. It’s simply impossible to rank number one for all the keywords you track. This is especially true for the generic, unbranded keywords that your competitors are trying to rank for.
In fact, most SEOs agree that a good site visibility score is one that surpasses the score of your closest competitors.
Content Score
Included in SE Ranking’s list of digital marketing metrics is the content score metric.
This metric is designed to evaluate two key content factors: quality and relevancy. Google considers these when ranking webpages in SERPs.
At SE Ranking, we calculate the content score based on the top 10 SERP results. Since the positions of pages in the top 10 are in constant flux, the content score undergoes shifts that correspond with these changes.
Our system takes the following parameters into account when calculating this metric:
- The number of words in the content.
- The number of headings and paragraphs.
- The number of images.
- The usage of keywords throughout, specifically in headings.
Using this metric to analyze your site’s URLs can help you understand which pages will require more or less optimization. After identifying these pages, you can begin following the recommendations offered by the tool. Some possible suggestions include optimizing meta tags, adding more target keywords, improving website structure, increasing/reducing word count, and so on.
Implementing these targeted changes bumps up your content score. And the higher your score, the greater chance you’ll have to outrank your SERP competitors.
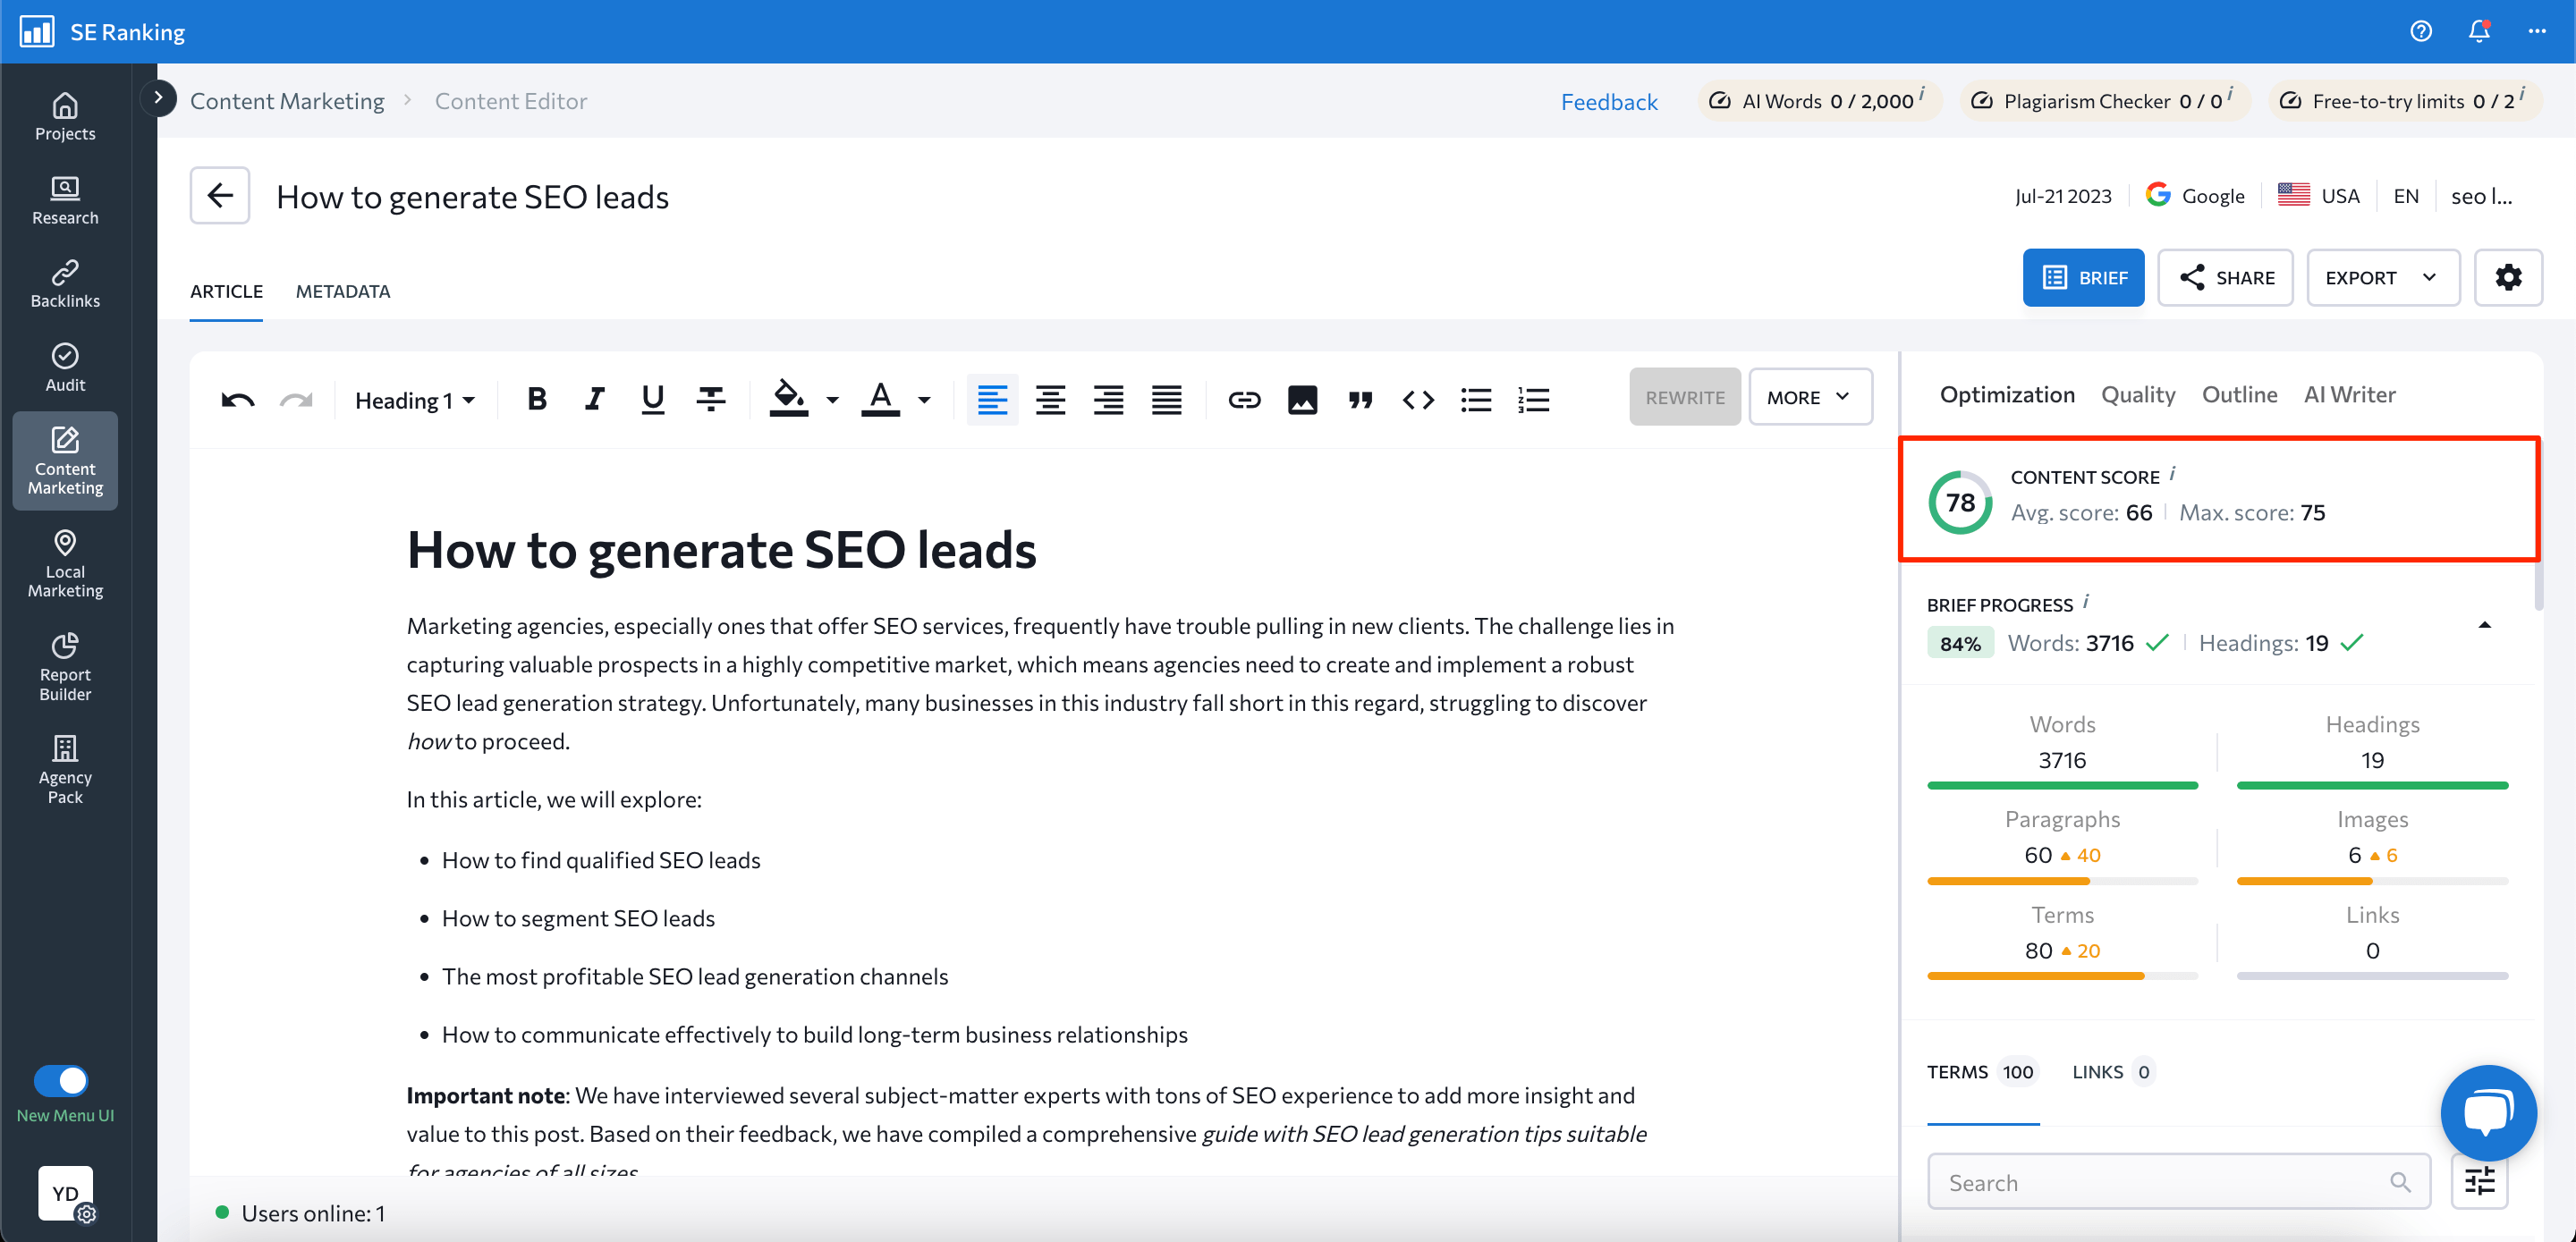
To achieve this goal, you should strive not only to fall within the recommended green range but also to ensure your score is higher than that of your SERP competitors.
You can find the content score in SE Ranking’s Content Marketing Tool. It can also be found in other tools like SERP Analyzer, On-Page SEO Checker, and Keyword Rank Tracker.
If you’d like to learn the ins and outs of content creation and optimization, be sure to enroll in our SEO content marketing course.
Metrics for Analyzing User Behavior & Engagement
User behavior metrics paint a picture of how well your content triggers engagement with your audience. The greater the quality and relevancy of your content, the more organic traffic and engagement rates you can expect.
Now, let’s review the most important user engagement metrics in depth.
Average Engagement Time
Have you ever clicked on a website where the content was so engaging that you couldn’t stop reading it?
Maybe you spent five minutes exploring the content.
Then 10 minutes…
And then 15 minutes…
Google gathers data on the time you (as well as all other users) spend during these sessions. The search engine then calculates your website’s average engagement time by dividing the total length of time it was in focus across all sessions by the total number of active users.
Finding this metric in GA4 is easy. Just navigate to Reports>Engagement> Pages and Screens.
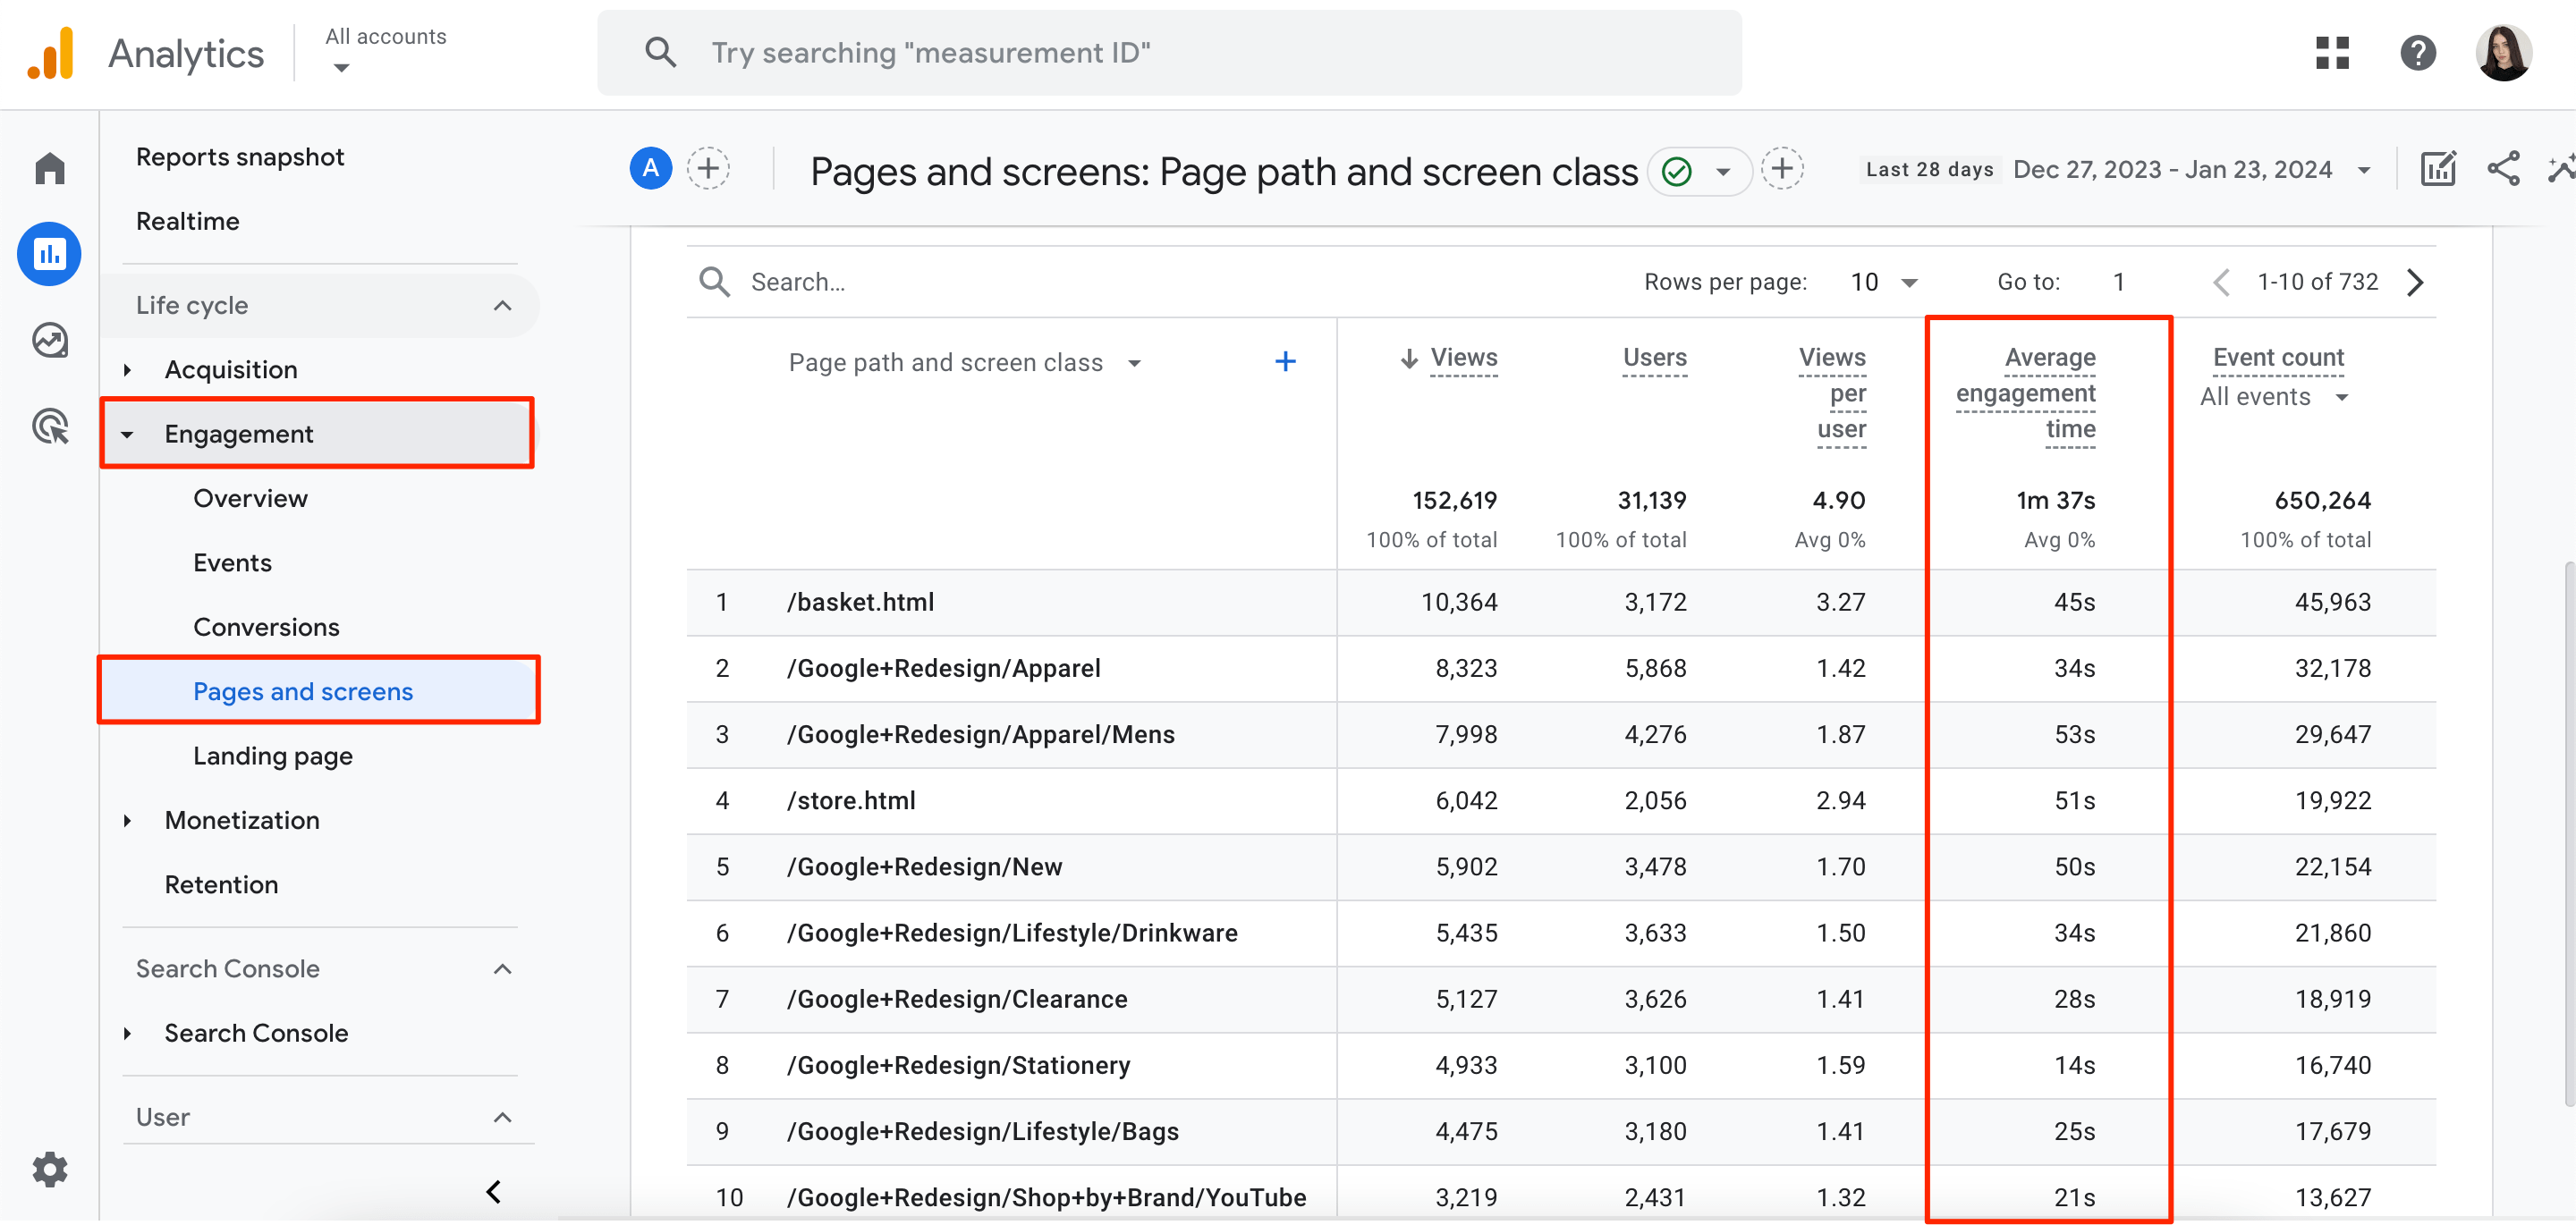
In a word, this metric outlines the average time users spend on your website, which shows how devoted people are to your content.
Average Engagement Rate
Some people believe that ‘average engagement time’ and ‘average engagement rate’ are the same, but this is not true.
The average engagement rate measures the percentage of engaged sessions on your website. It is directly related to how attention-grabbing and interesting your content is.
Suppose you have 5,000 sessions on your website, and 850 of them are active. To calculate the engagement rate, we need to use the following formula:
Engagement rate(%) = Number of Engaged Sessions / Total Number of Sessions * 100
In our case, the calculation would look like this:
(850 / 5,000) * 100 = 12.1%.
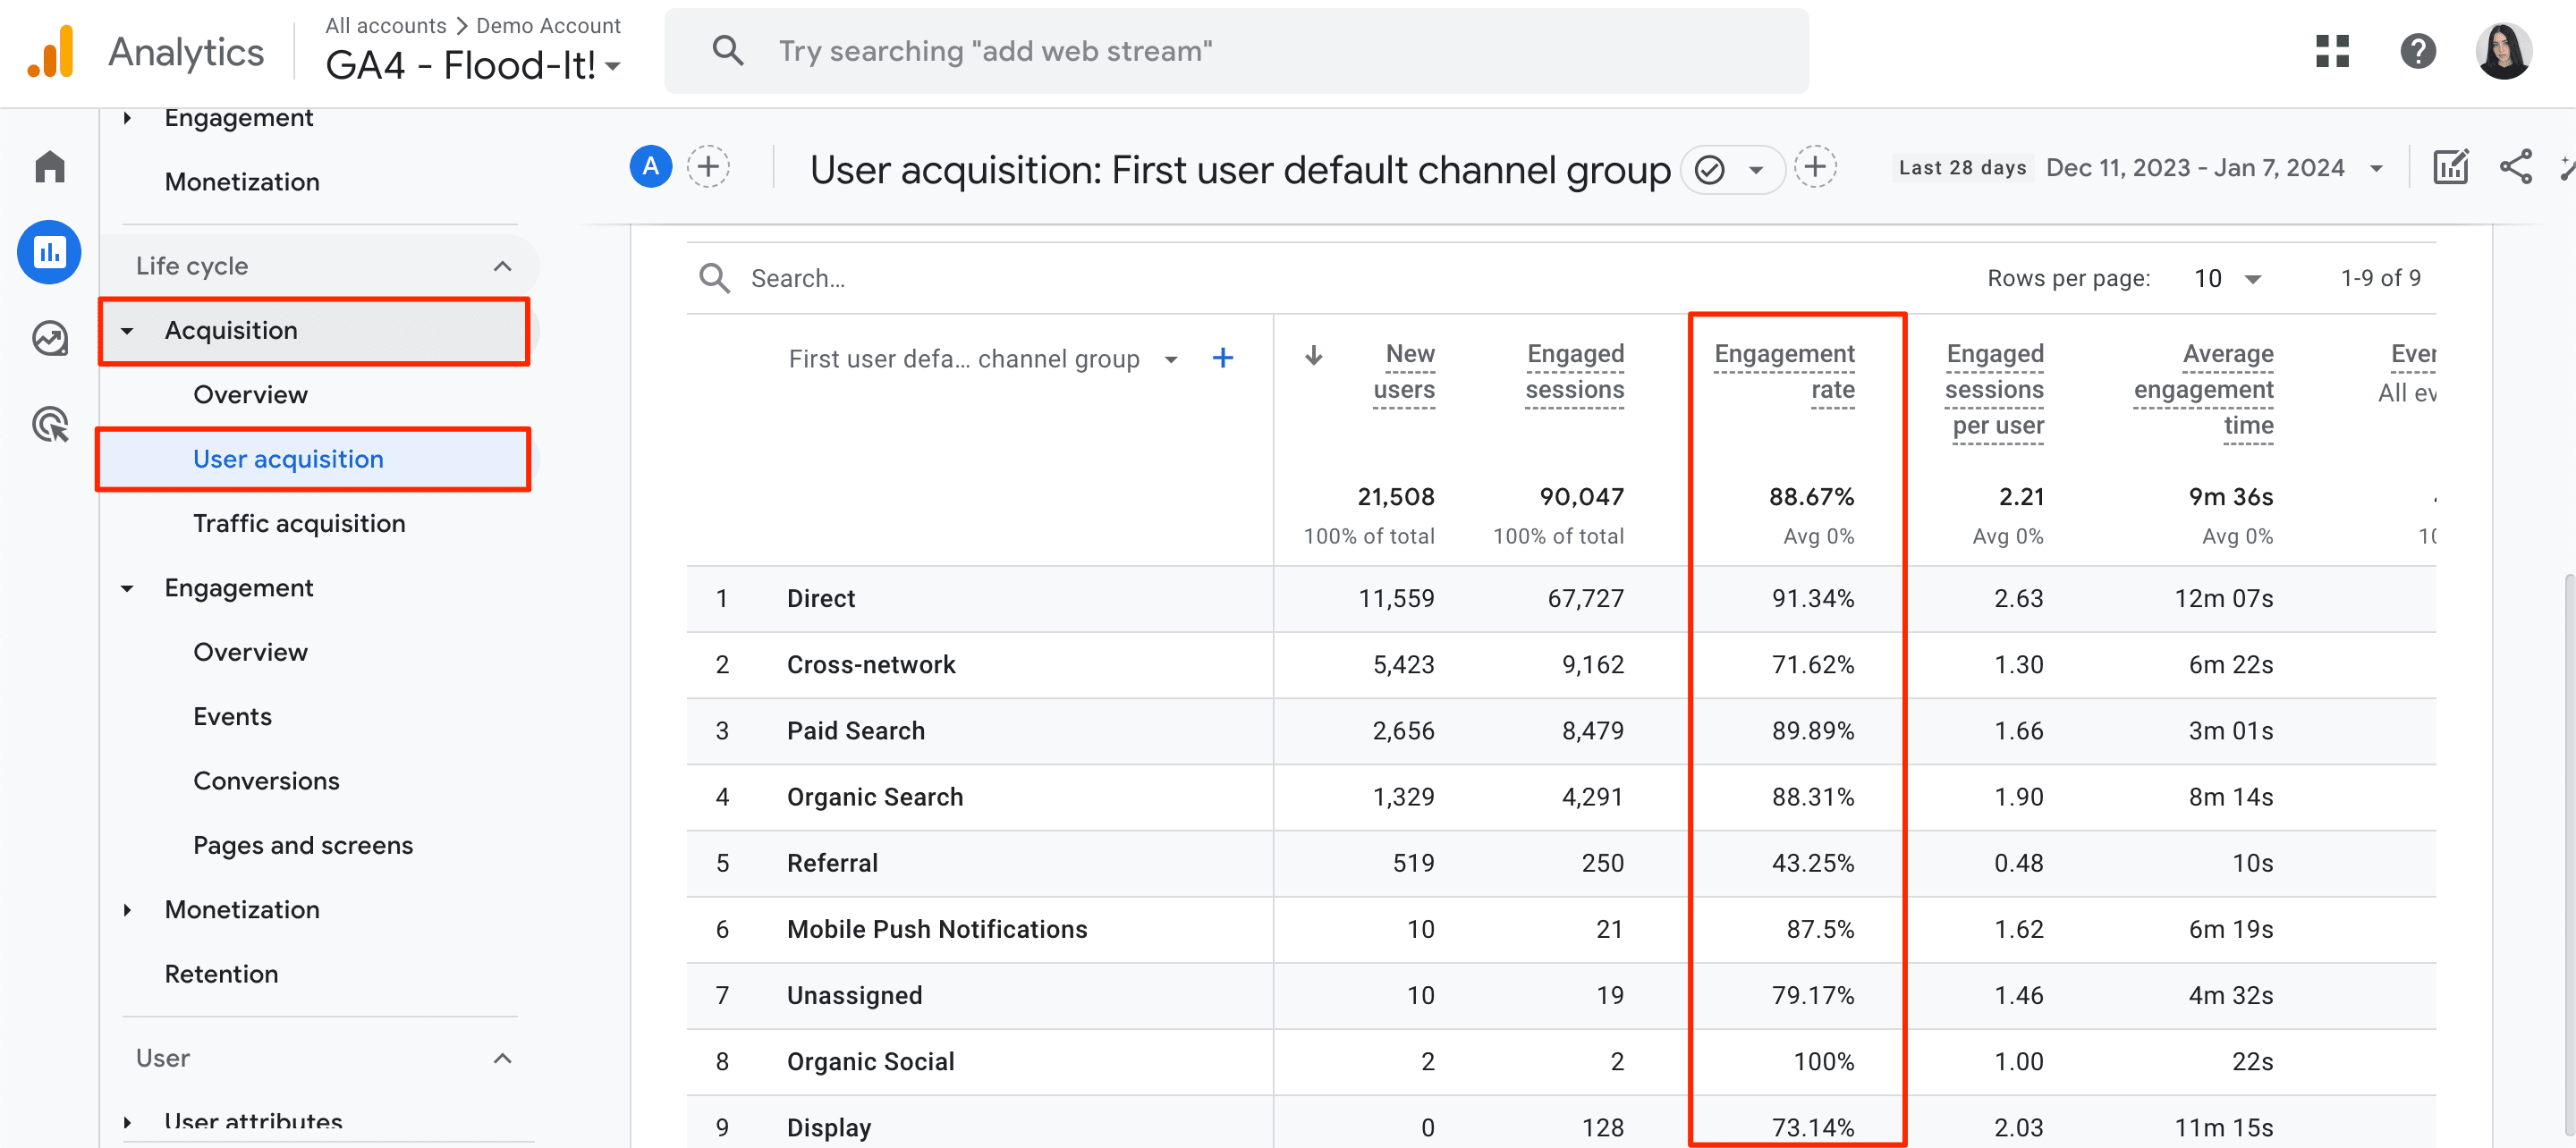
To get data on the engagement rate in GA4, go to Reports>Aсquisition>User Aсquisition.
Bounce Rate
Bounce rate is a content marketing metric that shows the percentage of users who leave a site without completing an engagement session.
According to Google, an engagement session is a “visit that lasts 10 seconds or longer, has one or more conversion events, or has two or more page views.”
There could be many reasons why your site has a high bounce rate, including poor design, technical issues, as well as low-quality content.
While there are no strict guidelines on the acceptable range of bounce rates, most SEOs still agree that a bounce rate of 40% or lower is considered good.
But if your content has a 60% bounce rate or higher, that’s a huge red flag. Make sure to investigate the reason behind this by performing both content audits and technical audits, and then fix any detected issues afterward.
You can also use GA4 to check the bounce rate. Here’s a list of steps to follow:
- Go to Reports>Pages and Screens.
- Click Customize Report in the upper-right corner of the report.
- Then, navigate to the Metrics>Bounce Rate.
- To save changes, click Apply.
Pages Per Session
As the name suggests, the pages per session is a content marketing metric that shows the average number of pages viewed in a single session.
Let’s add some context to help with understanding its value.
For example, let’s say your website has 1,000 sessions and 3,000 page views. The average number of pages per session would be 3.
It’s generally recommended to aim for at least 2-4 pages per session. If your users tend to leave after only visiting 1-2 pages, this might be a sign that you need to improve your internal linking strategy. But this doesn’t mean you should link random pages to one another just for the sake of interlinking. For example, it wouldn’t make much sense to link an article on fashion trends to a blog post about AI technologies. Instead, put yourself in your users’ shoes and prioritize using interlinking as a method to improve user navigation.
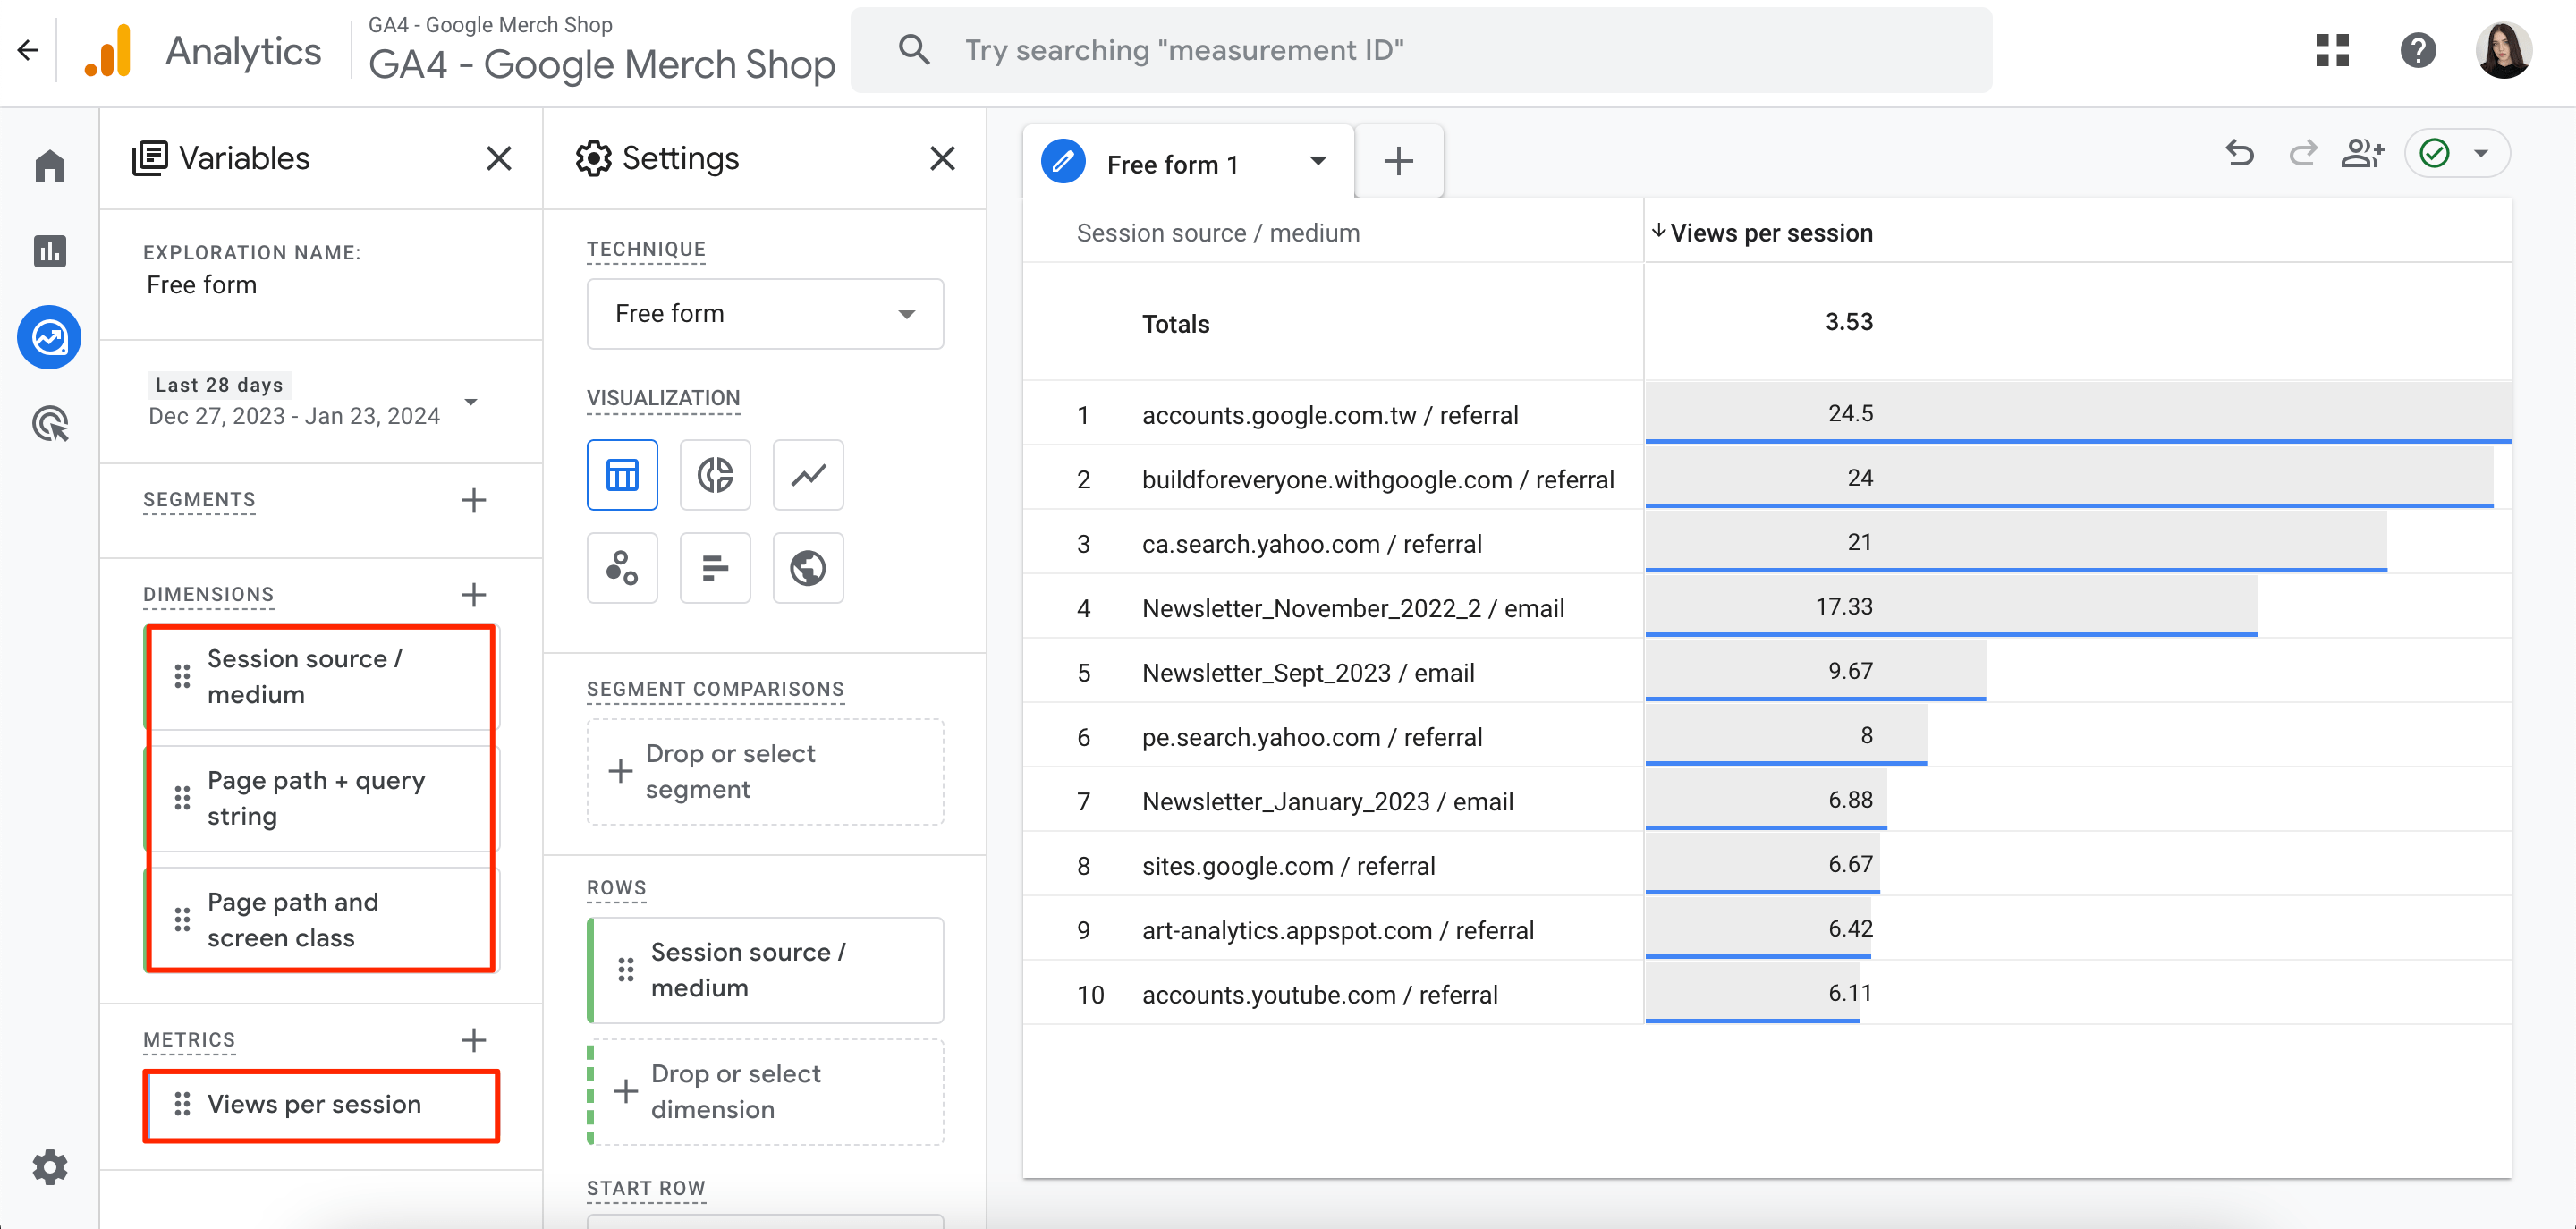
To keep track of this metric, create a new GA4 report. Add Views Per Session as the designated metric in the table and play around with the dimensions according to your needs. This will enable you to generate a custom table with data tailored specifically to your marketing reporting needs.
Percentage of New Sessions
This content marketing metric shows the percentage of first-time visitors compared to the returning visitors to your site. For instance, SEO specialists tend to look closely at this metric when launching new sections in their blogs. This data helps them understand whether the newly introduced blog section is successfully attracting and engaging a fresh audience or if adjustments are needed to improve its performance.
Suppose you had 1,000 sessions on your website, but 300 were from new visitors. The percentage of new sessions would be 30%.
This data is currently only available after you connect your Search Ads 360 advertiser with a Google Analytics web property.
Social Media Engagement
More and more people are using social media platforms every day. According to Statista, there are around 4.9 billion social media users worldwide. And this number is expected to reach a staggering 5.9 billion users by 2027.
While most people use these platforms for personal use, businesses have used them for both organic and paid growth purposes. This is why, from a business perspective, including these channels into your content marketing strategy is key. You should also keep track of any progress achieved while using them.
To monitor social media engagement, track metrics like:
- Likes: User approval and content resonance.
- Comments: User engagement and feedback.
- Post Reach/Impressions: Visibility and audience exposure.
- Shares: Content virality and endorsement.
- New Followers: Audience growth and increased visibility.
- Newsletter Marketing Metrics: Open rates, click-through rates, and subscriber growth in email campaigns.
Social media engagement metrics show you which content triggers user engagement best. This makes it easier to tailor your content marketing strategy more effectively.
Metrics for Tracking Conversions & Sales
There’s no point in running content marketing campaigns or doing business in general if they do not generate revenue. This is why tracking conversion metrics and sales should be an integral part of your marketing strategy.
Conversion Rate
Conversion rate is the percentage of people who complete a desired action within a specific time frame. This might include actions like purchasing a course, signing up for an email newsletter, booking a demo, making a consultation call, or any other activity you set goals for in your marketing campaign.
Suppose you’re running an e-commerce website. If 50 out of 1,000 visitors make a purchase, then the conversion rate will be 5%.
Most marketing specialists consider 10% to be a pretty good conversion rate, but it’s no catch-all. The ideal percentage depends on many factors, including business niche, target audience, campaign goals, etc.
When assessing conversion rates, you must pay attention to which content types perform better and which perform worse. After that, you can draw conclusions based on business goals like which topics to cover in your content, which types of pages to create, etc.
If this metric shows poorer results compared to previously set ones, make sure to optimize your conversion rates by using the proven practices described in this article.
Content Marketing Return on Investment
Content marketing ROI greatly influences the success or failure of your overall strategy. This percentage measures the revenue gained from content marketing in relation to the expenditure over a specified period.
It’s calculated according to this formula:
ROI(%)=((Return - Investment) ÷ Investment) x 100
Let’s suppose you spent $8,000 on your content marketing campaign. Your leads generated $40,000 in revenue (net profit) for your business.
So, what will the ROI be?
ROI(%)=(40,000 ÷ 8,000) x 100
The content marketing ROI would be 500%.
This means that for every dollar spent on the campaign, $5 in revenue was generated.
To calculate marketing ROI in just a few clicks, feel free to use our Marketing ROI Calculator.
In short, focus on high-performing content types (and channels) based on audience feedback and analytics to maximize your content marketing ROI.
Summary: Important Content Marketing Metrics to Measure Success
Tracking each of the content metrics mentioned in this article might appear overwhelming, but it doesn’t have to be. Using reliable SEO software for professionals and having helpful companies like SE Ranking by your side can drastically lighten the load.
Our robust platform gives you access to all the essential data for tracking and improving your content performance. Here are some specific tasks it can help you with:
- Monitoring your website’s ranking positions for your chosen keywords over time.
- Finding high-traffic, low-competition keywords.
- Performing content audits and technical website audits.
- Analyzing your top competitors’ content to see what they are doing well and where you can improve.
- Receiving content optimization suggestions.
- Generating content ideas based on the topics your audience cares about.
- Tracking backlinks to your content and identifying link building opportunities.
- Integrating data from GA4 and GSC to track all major insights within a single platform.
- Generating white-label reports for clients/stakeholders to track content performance progress.
Sign up for our 14-day free trial to take our features for a test drive. Once your trial has ended, you can opt for one of our customizable plans based on your SEO needs.
