Posted by
Rank Ranger
In our quest to provide you with a pleasant and efficient work space, we are excited to announce the launch of our new account-wide campaigns summary Pro View, highlights of which include:
- Personalize display settings per sub-user
- Set targets for visuals upon goal achievement
- Possibility to view Rank, Traffic, PPC, Social, Search Console, and Backlinks data all in one screen
- Choice of visual style and color palette
- Convenient Preset views for Marketing Managers, SEO Professionals, PPC Experts, Social Marketers and Link Builders, or design as you please
- Export account campaigns data to Excel or CSV
Join us for a tour of these new features and more…
Fig. 1. Account Campaigns Pro View
Comprehensive Personalized Marketing Dashboard
Pro View, complimenting our other campaigns displays, Classic and Screenshot Views, provides a uniquely comprehensive snapshot of your account campaigns data in a straightforward and convenient manner. Pro View introduces the option of sub-user personalization to the user’s Rank Ranger experience, allowing each account user to view the exact campaign summary data that they need to more effectively accomplish their goals, and in one convenient screen. Each account sub-user is able to create their own personalized Pro View by selecting the marketing metrics they want to view simultaneously on one screen: Search, Traffic, PPC, Social, Search Console, and Backlinks data. A metric-specific View Reports link instantly directs users to the associated reports without risk of losing their place on the Pro View Campaigns screen.
Customize Your Campaigns View
The Pro View campaign display enables you to filter your campaign data in a variety of ways and at a diversity of levels. Using the Display Options panel you can specifically select which campaign details and marketing data fields you wish to be displayed.
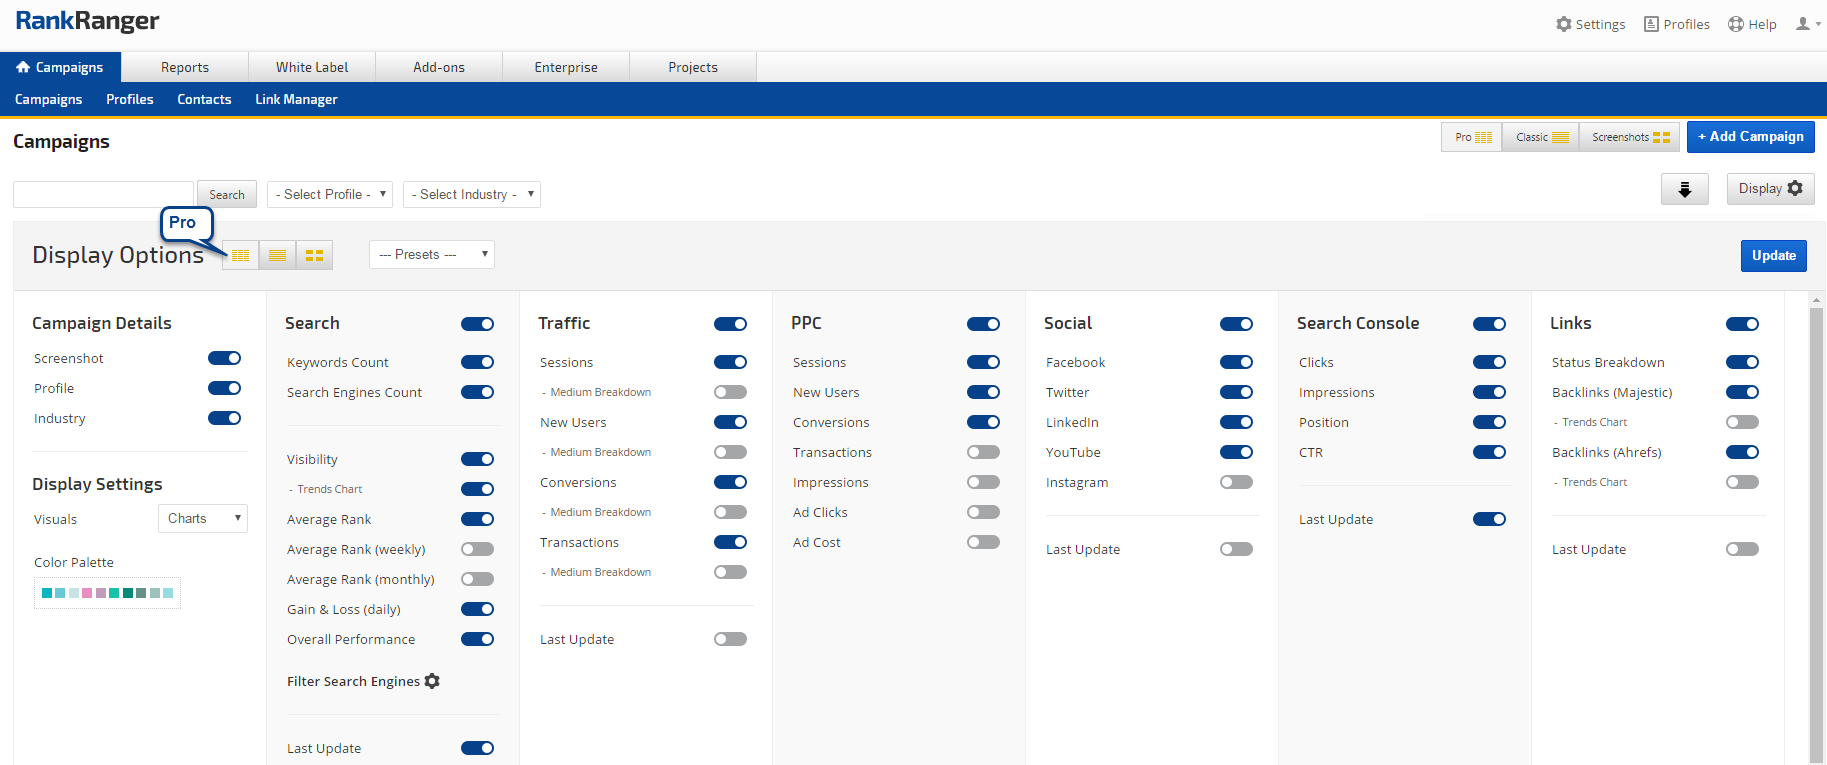
Fig. 2. ProView Display Options
Choose Your Visual Style and Color Palette
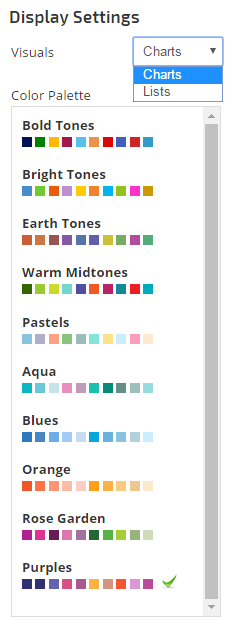 The possible diversity of the Pro View display is not relegated only to its many data options, carefully considered was its ease of appearance and aesthetics, along with data type presentations. This was accomplished in a twofold manner by providing you with an expansive color palette selection and enabling various forms of data mediums to be available.
The Pro View display incorporates the ability to insert a variety of data presentation mediums. In various ways and instances you have the ability to insert a choice of data display options. Perhaps the most notable example appears in the Traffic data fields where Traffic metrics can be presented in pie charts or colorful lists when the Medium Breakdown option is selected.
In this Traffic example, the List option displays the data from the Medium Breakdown as a series of visually stimulating vertical color bars representing the various types of traffic sources percentage of the total traffic category (e.g., sessions, new users, etc.).
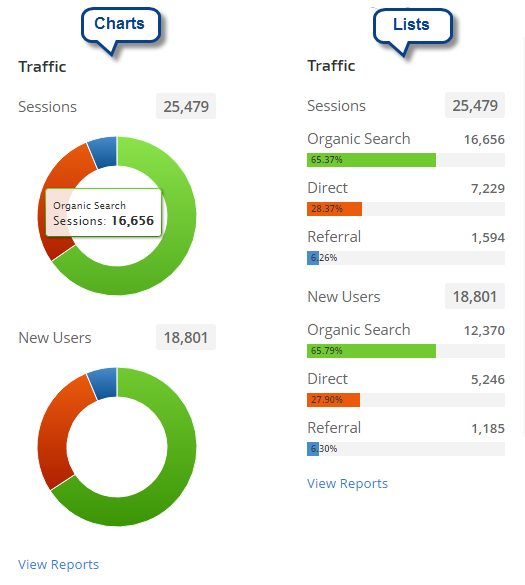
Figs. 3. & 4. Pro View Color Palette and Chart and List style options
The second available option for which to display a Medium Breakdown is the Chart visual. Unlike the List visual, the Chart option does not display textual or numeric data on its surface display. Rather, this visual option appears as a pie chart with each sub-metric displaying in a different color. Numeric data is seen as the user hovers over each section of the chart.
Either of these two visuals can be color customized by choosing from an extensive array of color palettes that afford you the ability to construct the data displayed on the visuals in a personally aesthetically pleasing and visually engaging manner. This option embodies the extent to which the Pro View display provides users with comprehensive customization.
Trend Charts
Search Engine Visibility and Backlink data can be presented in a Trends Chart format, enabling this option will display your data as an area graph. Hover over the graph to discover numeric data for a specific **** in the range.
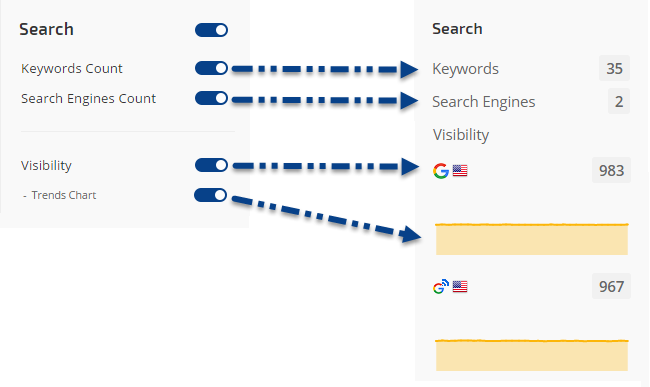
Fig. 5. Visibility Trends Chart
Employing the Trends Chart options adds an additional data vista, bringing with it depth and visual discernibility.
Set Targets for Goal Achievement
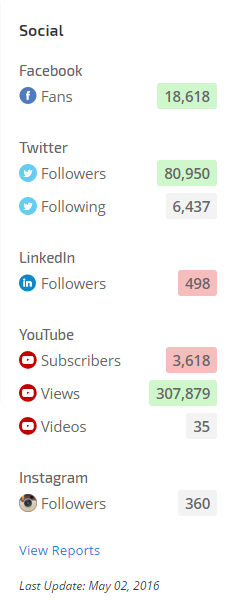
In a most significant way, and in perhaps its most aspiring ability, the Pro View display renders the ability to make the displayed data visually meaningful. Our new Target Value feature allows you to set goals for all numeric metrics.
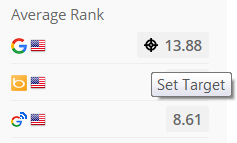
Fig. 6 Target Value icon (left), Fig. 7. Target Values set and achievement highlighted (right)
When a target goal is met the metric’s numerical data will indicate with a green highlight. If the target has not been met, the data will appear with and a red highlight (since the feature uses greater or less than values, it is possible to have a goal that has met both goals and these are presented in yellow).
Making use of this feature fosters an ability to easily track your personal goals and objectives. The Target Value feature essentially turns data diving into a subjectively meaningful and precise experience. Employing clear visual cues, the feature creates a data environment where you can track progress in a quick and easy way.
Campaign Details
Starting with Campaign Details you can choose to display or hide a desktop and mobile screenshot of the site associated with the campaigns, along with the campaign’s profile and industry (if enabled in the campaign’s General Settings).
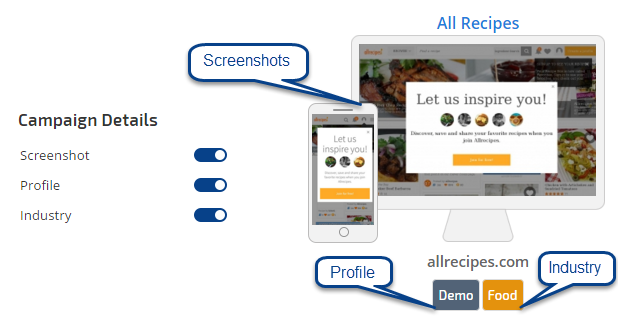
Fig. 8. Pro View Campaign Details options
Select Your Marketing Metrics
Click a toggle switch on the Display Options panel to display or hide entire data categories including Search, Traffic, PPC, Social, Search Console, and Links. Within any given marketing data category you can choose to select as much or as little information as you wish to view and analyze.
Rank Performance Data
Choose from a variety of rank performance search metrics including SERP Visibility, Average Rank (current, weekly or monthly), Gain & Loss (daily) or Overall Performance – or select them all! If, for example, your major concern is weekly rank change, and overall performance change from the beginning of the campaign, then you can select only those metrics to display.
Within Rank itself you may wish to view your performance on a macro level only, and as such can enable Average Rank, Average Rank (weekly), Average Rank (monthly), or Overall Performance while disabling Gain & Loss (daily).
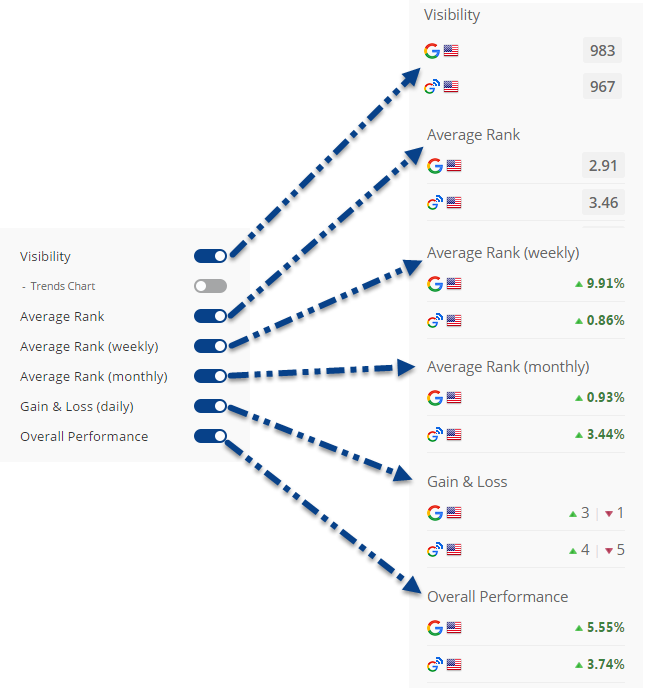
Fig. 9. Pro View Search Metric display options
You can also customize your rank data to include the total number of keywords and search engines being tracked in each individual campaign, along with Visibility trends.

Fig. 10. Pro View Search Metrics Keywords & Search Engines Count with Visibility Trends
Search Traffic Breakdown Possibilities
The ability to have sub-users apply settings that only impact their own login to your account can have positive implications within Traffic data. As with Search rank data, Pro View allows sub-users to view specific Traffic metrics pertaining to their role. For example, if you have a sub-user whose primary focus is increasing your client’s site sessions and new users, then that sub-user can simply set their Pro View display to show only the Sessions and New Users metrics without impacting the display of other users (whose role may be focused on targeting Conversions and Transactions at the moment).
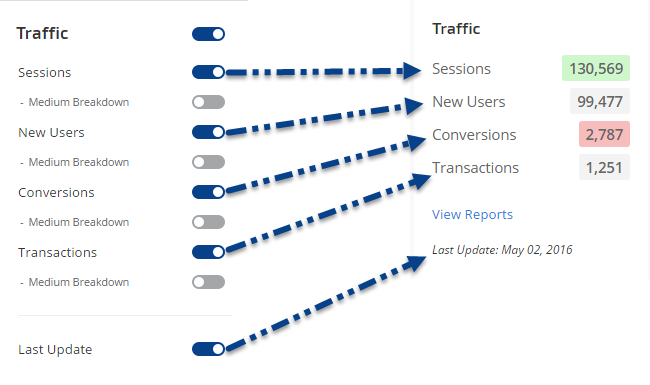
Fig. 11. Pro View Traffic data options: Sessions, New Users, Conversions, and Transactions.
As mentioned in the Visual Style section above, for each Traffic metric, Pro View has an option to view a pie chart or color bar list for the traffic mediums that comprise your data. The Medium Breakdown data you can sub-filter the data for each metric by the following types of traffic:
- Direct
- Organic
- Paid
- Referral
- Social
- Other
Pro View for the PPC Expert
Pay-per-Click experts can view a traffic and PPC snapshot by selecting the PPC Expert preset or choosing from a variety of metrics including:
- Sessions
- New Users
- Conversions
- Transactions
- Impressions
- Ad Clicks
- Ad Cost
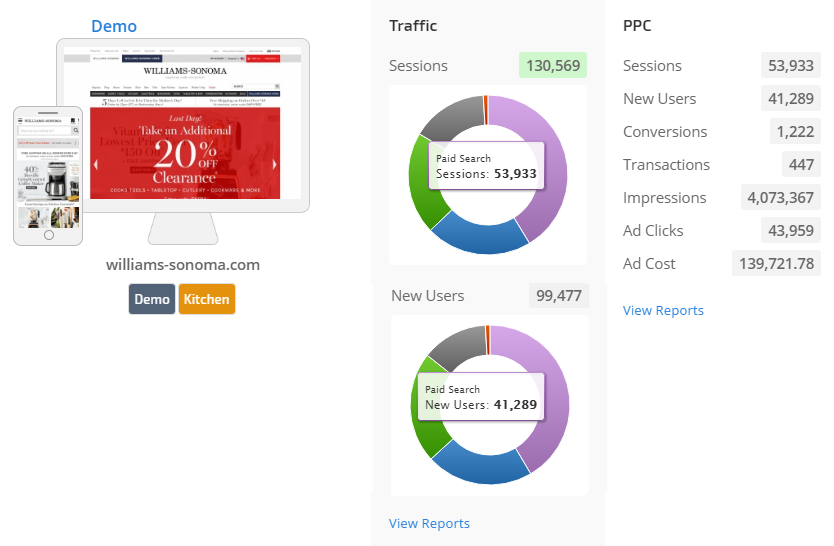
Fig. 12. PPC Expert Pro View preset
Search Console Integration
For the SEO Pro, integration of Search Console data allows for a side-by-side view of your most important search performance metrics: Rank, Traffic, and Search Analytics:
- Clicks
- Impressions
- Position
- CTR
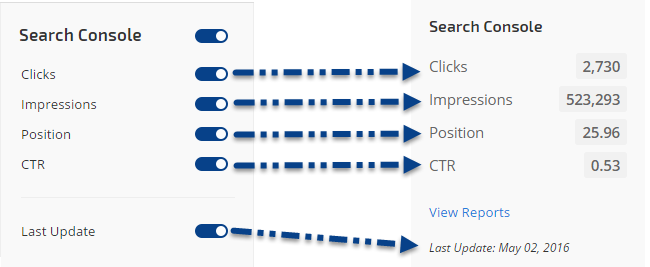
Fig. 13. Search Console Display Options
With the insertion of Traffic along with Search Console, you can quickly see not only how users behaved once they arrived at the tracked site (i.e. Traffic data), but also how often search engines presented the site in search results (i.e., impressions) and the average rank position they placed it in and how often users engaged with those SERP links (i.e. Search Console), thereby painting a complete data picture.
Social Media Marketer Pro View
In fostering a one-stop data environment, Pro View has the ability to integrate and display important social media engagement metrics from Facebook, Twitter, LinkedIn, YouTube, and Instagram. Pro View’s personalization options again become significant when dealing with sub-users who are focused on specific types of digital marketing activities. A sub-user working with just Facebook, Twitter and LinkedIn, can customize the Campaigns screen to display data from those social media channels along with Traffic and hide data from other social media outlets and other marketing metric categories, without impacting another sub-user whose role involves SEO and link building.
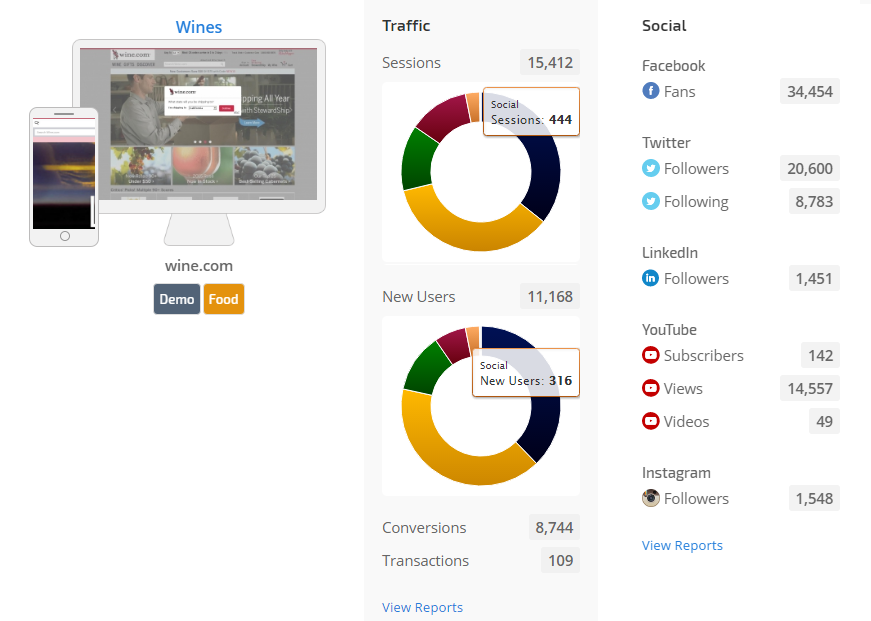
Fig. 14. Social Marketer Pro View Preset
Link Builder Pro View
Pro View completes its data presentation with the display of Managed Links status and Backlinks data from Majestic and Ahrefs in an entirely user-friendly manner. If you’re using our Link Manager, you’ll want to enable the Status Breakdown which alerts you to the total number of links being tracked, along with links that match the anchor text vs. those that don’t, and those that are marked as no follow or don’t exist on the host at all. For your convenience, you can add a new link directly from this screen.
Toggle on your choice of Majestic or Ahref Backlink metrics (or both) for a high level view of current backlink numbers, and toggle on the Trends Chart option to view the trend over the past 6 months.
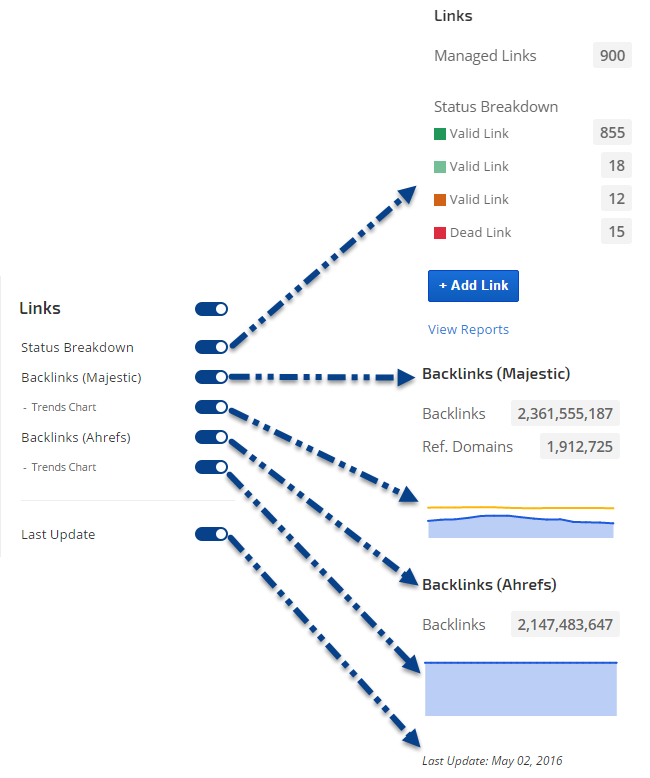
Fig. 15. Managed Links and Backlinks metric options in Pro View
Preset Ready and Capable
Part of Pro View’s uniqueness is its uncompromising commitment to convenience and data completeness. Taking this concept to its logical end, we’ve installed a series of built in display presets that cater to specific types of online marketers. These presets have been expertly designed to consider your needs, that being said our goal is your convenience and so we’re always happy to receive your suggestions.
By way of example, the SEO Pro preset was designed for a user interested in a comprehensive overview of key SEO metrics, you’ll also find SEO Basic and SEO Advanced presets available.
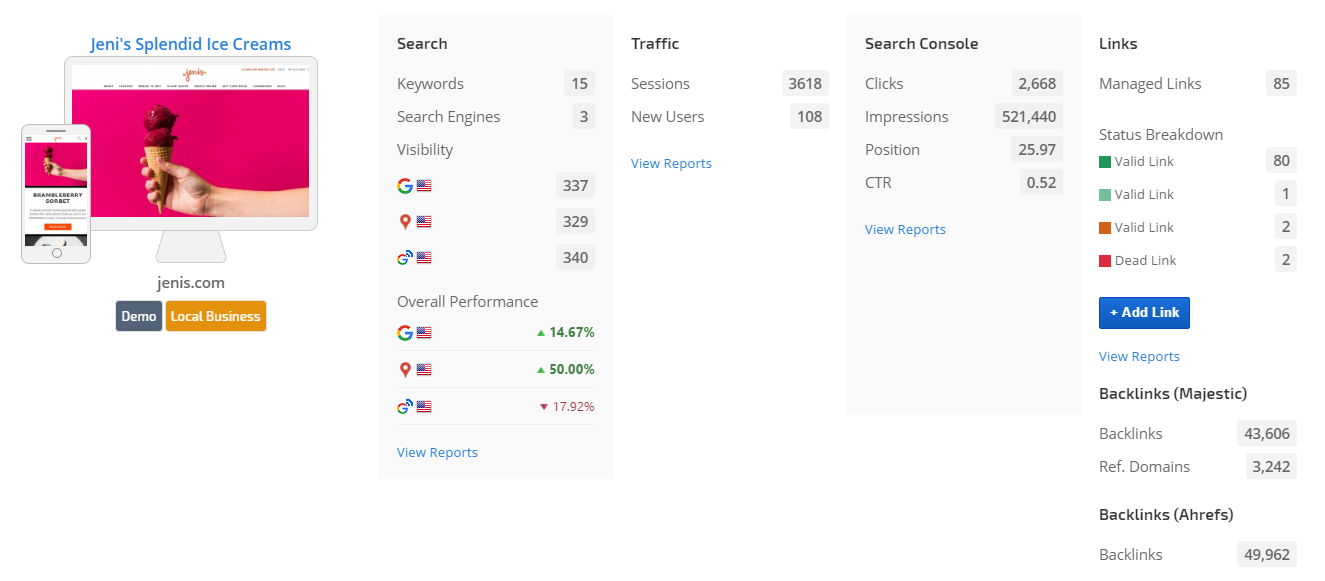
Fig. 16. Preset for SEO Pro
Conversely, when designing the Link Builder preset we considered the needs of a marketer running Link campaigns with an interest in SEO Visibility.
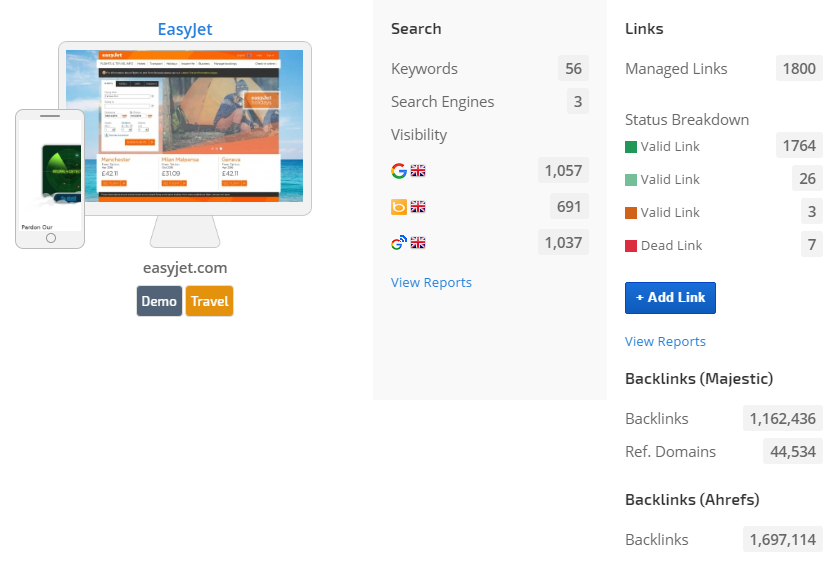
Fig. 17. Link Builder Pro View preset
Having these built-in presets at your fingertips affords you the ability to give your sub-users well designed campaign display screens that have been carefully built around their specific needs and goals. Of course these built-in presets are in addition to your ability to design and implement your own self-crafted display.
Account Campaigns Pro View!
The Pro View account campaigns display, offering a complete data picture at-a-glance, represents a breakthrough in the way you see SEO data, literally. Via careful craftsmanship that considers the variant and personal needs of the user spectrum, Pro View provides a prolific way to analyze SEO data in the most efficient manner conceivable. By providing sub-users with a rainbow of options that relate specifically to the campaigns they manage, Pro View becomes a well oiled team project and oversight machine that’s worth its weight in efficiency gold to any team leader. We look forward to your feedback.

