Posted by
Michael Lerner
Business has been paying mega bucks across the web on keyword based advertising. Google made $59 billion in 2014 in AdWords revenue.
A popular question for online marketers: What keywords drive searches to your website? Google withholds a lot of the data regarding what keywords people are searching with on their proprietary sites google.com, youtube.com, google mobile, etc… In Google Analytics, we mostly see not provided (information) on Web Site keyword searches. But you can find out what keywords work best, by paying for an ad with a keyword based pitch.
Those ads that succeed in click-thru tell you which keywords work for your site. Buying Google ads does two things: 1) drives business to your site and 2) provides keyword and demographic data for and about users. Because you get the keyword research for AdWords. That’s what you are paying for in SEO terms.
How to make sense of AdWords?
To assist you in determining if the investment is paying off, and what keywords work best for your site, we developed a PPC Keywords report for your AdWords campaigns. In this graph we see the number of Sessions with Transactions day-to-day (blue area) compared to the same time period last year (orange line). Note the slight dip in traffic on the day the Google Mobile-Friendly algorithm update was rolled out and the gradual decline in traffic for the following week.
AdWords PPC Keywords Analysis Report
Because we selected the option to compare to the same time last year, the summary and table below the graph show current period results and percentage change up or down from last year. The PPC reports also have options to compare to the previous period (e.g., compare April to March) of to select a custom **** range.
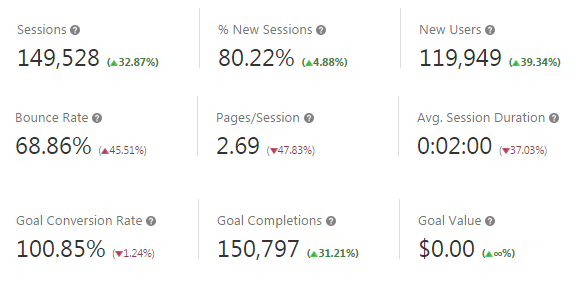
This summary section provides the totals for all Keywords (or all Campaigns if you’re viewing the PPC Campaigns report) based on the filters and segments you select in Report Options.

About Goals & Conversion Rates
The Goal Conversion Rate is the sum of all individual goal conversion rates. And the Goal Value is the total value produced by goal conversions on your
site. This value is calculated by multiplying the number of goal
conversions by the value that you assigned to each goal.
Note that the Goal value is $0 for this customer’s campaign. Since the report was filtered for sessions with transactions, there is a good chance that those transactions resulted in real dollars, however, when the goal was created in Google a value was not assigned.
Table includes Keyword or Campaign name along with Analytics traffic session and goal conversion data.

Table includes Keyword or Campaign name along with clicks, impressions, click-thru-ratio (CTR), average cost-per-click (CPC) and total cost.

These AdWords reports can give you a sense of your cost per click (CPC) and conversion rate of campaigns and keywords. Like all Rank Ranger Analytics reports, options include all Google Analytics metrics, goals, transactions, conversions, total costs can be charted and reported, and more…. Instead of trying to combine different Google Analytics reports by yourself, our reports enable you to tie everything together, allowing you as an SEO Pro to do your true marketing work and analysis. Rank Ranger gives easy access to the data you need to understand your AdWords traffic.
Learn more about how to set up your AdWords Campaigns and your AdWords Keywords reports.

