If you’re feeling overwhelmed by the discussions surrounding bounce rate in GA4, you’re not alone. The constant back-and-forth about the relevance of the bounce rate can be confusing.
But don’t worry, I’m here to clear up any confusion on the bounce rate metric in GA4 and provide you with what you need to know about the bounce rate and – getting a little ahead of myself – the engagement rate.
By the time you finish reading this article, you’ll not only know what the role of the bounce rate is in SEO and how to understand and use it in Google Analytics 4, but we’ll also discuss the bounce rate formula, determine what a good bounce rate for a website is, how to reduce it, as well as get a clear understanding of the difference between the bounce rate and its replacement – the engagement rate.
Let’s start by understanding what the bounce rate metric is.
What’s the bounce rate in SEO?
The bounce rate is a metric used in web traffic analysis that indicates the percentage of visitors who land on a specific page of a website without engaging with it and then leave without navigating to any other pages on the same site.
Let’s take a look at a simple illustration that explains the bounce rate:
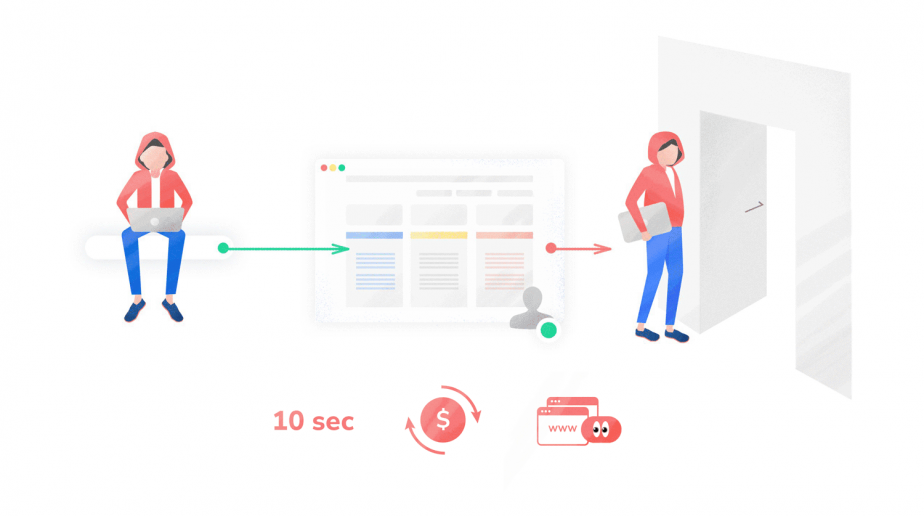
The more visitors who leave a webpage in this manner, the higher the bounce rate for that page will be.
Now that we know what the bounce rate means, we have the bounce rate explained, let’s talk about its latest transformation.
Bounce rate vs Engagement rate
Despite the reliance of many on the bounce rate metric, Google has opted to eliminate it from the list of default metrics in the latest version of Google Analytics and replace it with a more beneficial metric known as the engagement rate.
It’s only reasonable to ask: Why did Google Analytics remove the bounce rate? And what does the engagement rate have to do with it?
In the past, a “bounce” was defined as a user viewing only one page on a website before exiting, and this was one of the main metrics used by analysts to measure user engagement in the earlier version of Google Analytics, known as Universal Analytics.
However, the bounce rate has faced criticism because it is only applicable to a certain type of website. With Google Analytics 4 designed to be adaptable, catering to mobile and single-page apps as well as websites, a fresh metric was required to gauge user engagement.
As a result, Google introduced a new metric to support the bounce rate: the engagement rate. It’s important to emphasize that these two metrics still exist at the same time, but the engagement rate has become the default option.
To qualify as an “engaged” session, the user must complete at least one of the following actions during their visit:
- Viewing your webpage or app in the foreground for at least 10 seconds
- Triggering a conversion event
- Scrolling two or more screens
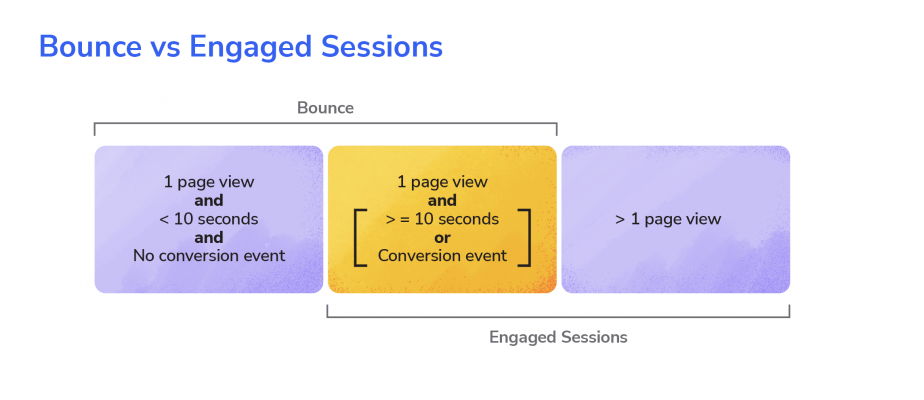
When it comes to interpreting the engagement rate, it’s important to note that it differs from the bounce rate.
While the engagement rate and the bounce rate can be seen as opposite metrics, it’s worth noting that the engagement rate tends to be higher than the simple inverse of the bounce rate. This is due to the fact that the engagement rate takes into account not just the time spent on a page but also conversion events.
The reason behind this is that a session with two or more page views qualifies as an engaged session, which is not considered as a bounce. Additionally, other sessions that would have been considered a bounce also count as engaged sessions under the new engagement rate metric.
The number of users falling into the yellow area in the image above is what differentiates the previously reported bounce rate from the new engagement rate.
This change is especially beneficial for informational pages that provide in-depth answers. Previously, a user who found all the information they needed on one page and then leave the website would have been considered a bounce, but now they are considered engaged if they spend more than 10 seconds on the page.
How the bounce rate is calculated
The calculation for bounce rate is actually different in Universal Analytics and Google Analytics 4. You can find more information in this documentation from Google.
Traditionally, the bounce rate in UA was calculated by dividing the number of single-page sessions by the total number of sessions on a website where a session was considered a period of time during which a user interacted with a website.
When a user landed on a webpage and then left without clicking on any other links or visiting any other pages on the site, it was considered a single-page session and contributed to the website bounce rate.
For example, if a website had 1,000 sessions in a month and 400 of those sessions resulted in a single-page visit, the bounce rate would be calculated as follows:
Bounce rate = (400 / 1,000) x 100% = 40%
This meant that 40% of visitors left the website after viewing only one page.
Note that the bounce rate only applied to sessions that started with a pageview. If a session started with an event, such as a download or video view, it wouldn’t have been factored into the bounce rate calculation.
In GA4, however, the calculation of the bounce rate still includes sessions with a single page view, but it also takes into account additional factors such as how long people spend on the page and whether they interact with the page (scroll, click, etc).
The bounce rate in Google Analytics 4 is defined as the percentage of sessions that were not considered engaged. A session is considered a bounce if someone viewed a single page for less than 10 seconds or didn’t engage.
Engaged sessions are excluded from the bounce rate calculation. A session is considered engaged if it meets any of the following conditions:
- It was at least 10 seconds long
- Two or more pages were viewed
- Two or more screens were viewed
- Conversion events were triggered
For instance, if there were ten sessions in total and seven of them were engaged sessions, the bounce rate in GA4 would be 30%, calculated as follows:
Bounce rate = 3 non-engaged sessions / 10 sessions = 30%
Now that we understand how the bounce rate is calculated in Google Analytics 4, you may wonder what the average bounce rate is. Let’s take a look!
What is a good bounce rate
A good bounce rate depends on the industry and type of website. Generally, a low bounce rate is ideal, indicating that visitors are engaging with the website and exploring further. A high bounce rate can mean that visitors are leaving without interacting with the site, which is not healthy for the website’s performance.
At the end of the day, the ideal or healthy bounce rate for any given website will depend on various factors, including its purpose and the expectations of its visitors.
According to a recent study by Contentsquare across 9 industries, most websites have an average bounce rate of around 48.6%, though there can be significant variations as you can see in the graph below.
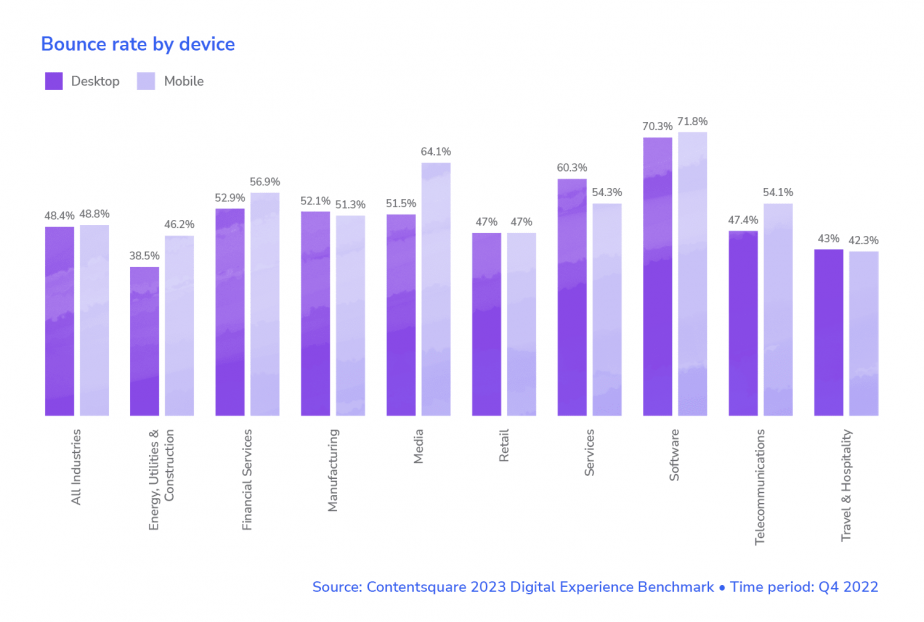
The bounce rate is increasing across all industries, and is particularly high in B2B. The rise from 47% in 2021 to 49% in 2022 may seem small, but it represents a significant decrease in visitors progressing towards a possible conversion.
The bounce rate varies by industry, with sectors such as travel and retail experiencing bounce rates below 50%, while B2B industries like software, services, and manufacturing tend to see far higher bounces, especially on mobile devices. Looks like the bounce rate will exceed 60% in 2023 and even go beyond 70% for some B2B sectors.
Checking the bounce rate in Google Analytics 4
The current Google Analytics has two different data collection technologies: Universal Analytics and GA4, and they each measure bounce rate differently.
In Universal Analytics, the bounce rate is defined as “The percentage of single page sessions in which there was no interaction with the page”.
This means that if a visitor lands on your page, reviews your content for several minutes, and then leaves, the session still counts as a bounce.
This is what the bounce rate metric looks like in a UA dashboard:
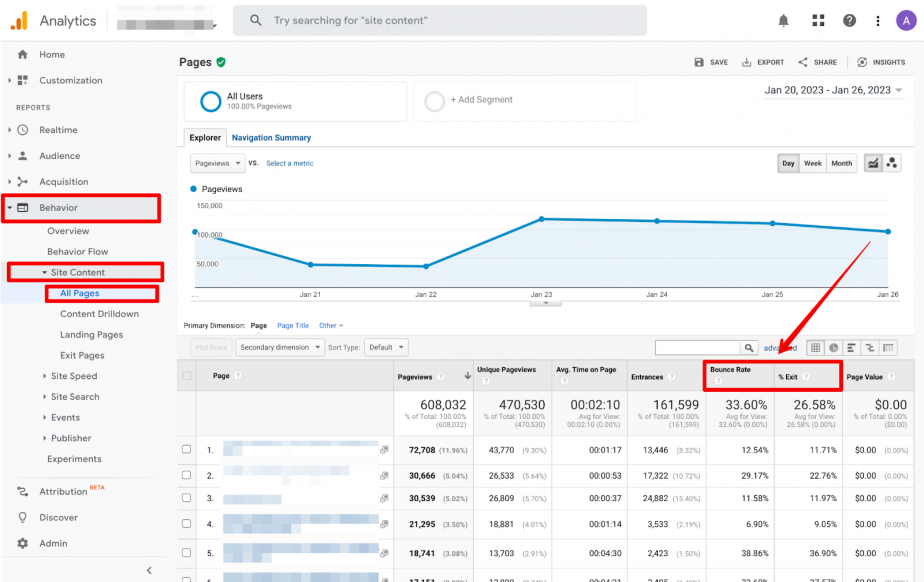
In contrast, GA4 defines the bounce rate as “The percentage of sessions that were not engaged sessions.” An engaged session is a visit that lasts 10 seconds or longer, has one or more conversion events, or has two or more page views.
So, if a visitor lands on your page, reviews your content for more than 10 seconds, and then leaves, the session does not count as a bounce, even if they didn’t perform any other action on that page or navigate to another page.
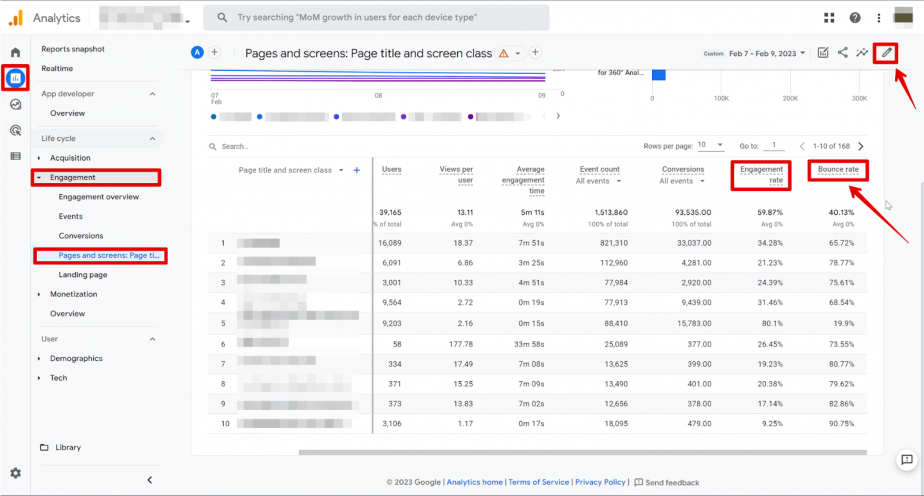
Note that to view the bounce rate and the engagement rate metrics in GA4, you will need to customize your reports or create an exploration report (keep reading to learn how to set them up).
Once they’re set up, you can find these metrics under Reports → Engagement → Pages and screens: Page title and screen class in a GA4 dashboard:
By the way, there are plenty of ways to take advantage of having both Universal Analytics and Google Analytics 4 set up.
How to set up the bounce rate in GA4
In order to see and perform a website bounce rate analysis in your Google Analytics 4 dashboard, more specifically in the Pages and screens report (or any other report), you’ll need to have Editor or Administrator access.
Granted you have such access, what you need to do is:
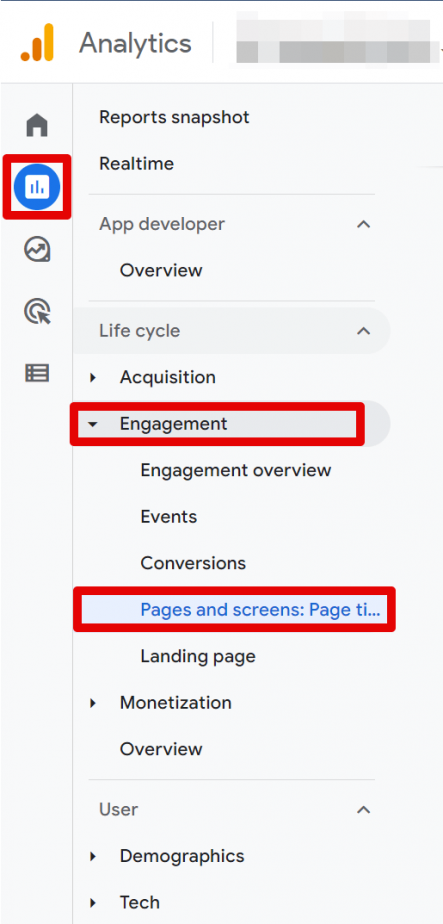
- Click on Reports in the menu on the left-hand side.
- Navigate to the Pages and screens report. If it’s not there, it may have been removed, but you can add it back through the report library or customize a different report to include the metric.
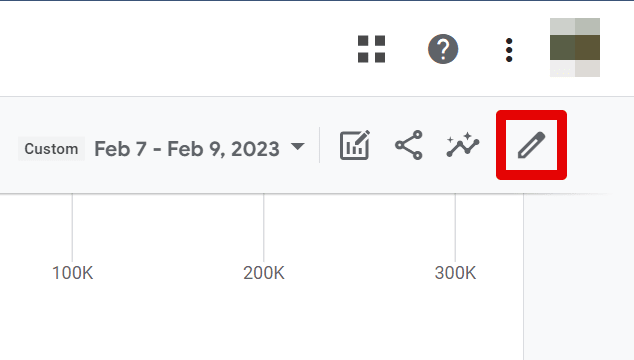
- Once you see the report, click Customize report in the top-right corner. If you don’t see this button, this means that you don’t have the necessary level of access.
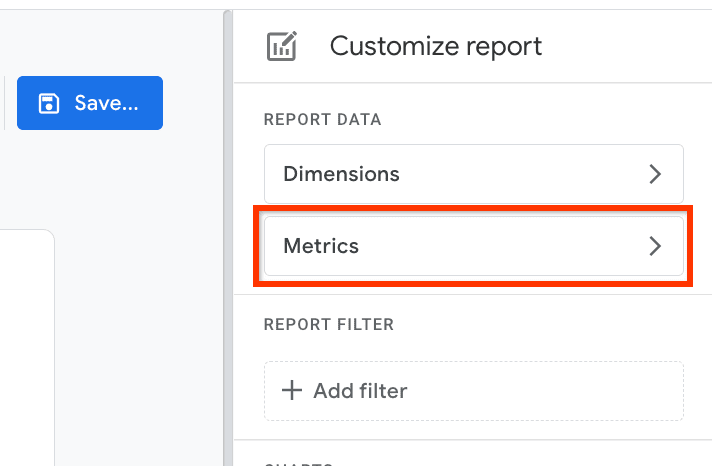
- In the REPORT DATA section, click Metrics and find the “Bounce rate” in the Add metric field. Just make sure to apply the changes and save the report.
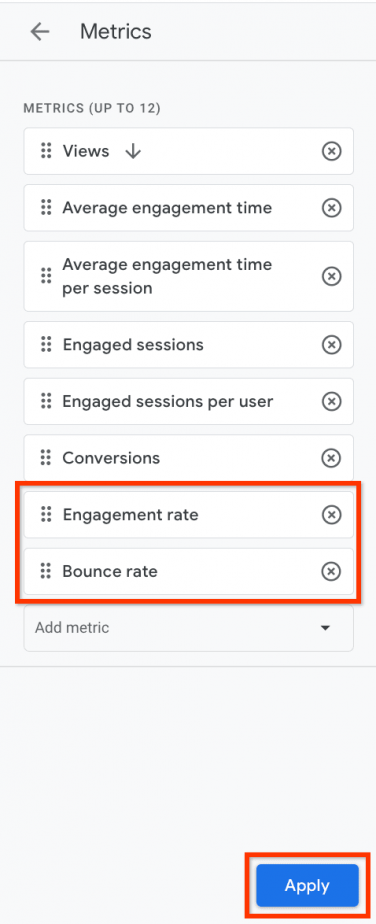
You’re also at liberty to add the bounce rate and engagement rate metrics to an Exploration – a collection of tools for advanced reports which you can leverage to get deeper insights about your customers’ behavior.
Checking the bounce and engagement rates using SE Ranking
Once you connect Google Analytics to your SE Ranking account, you’ll be able to check either the bounce rate or the engagement rate metric (depending on whether you’re still on UA or have already made the switch to GA4) right from our all-in-one SEO platform.
To do this, access the platform, select a website you want to analyze, go to the Analytics & Traffic module, and access the Traffic tab. Here, you can find the metric that you need under the Traffic source and Pages tabs.
You’ll see the bounce rate if you haven’t connected your website as a property to GA4, and are still using Universal Analytics:
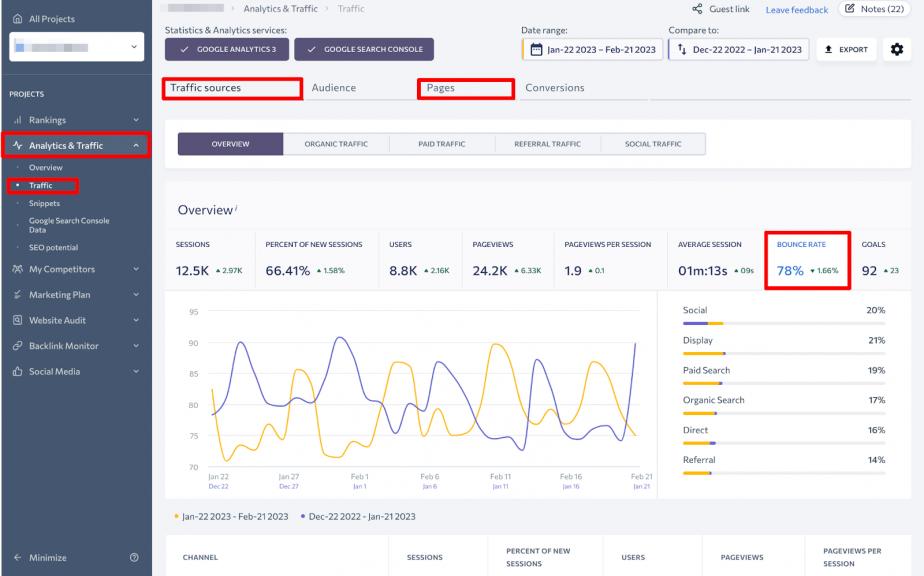
But if you are already in tune with the times, meaning you’re using GA4, you will find the engagement rate right in SE Ranking.
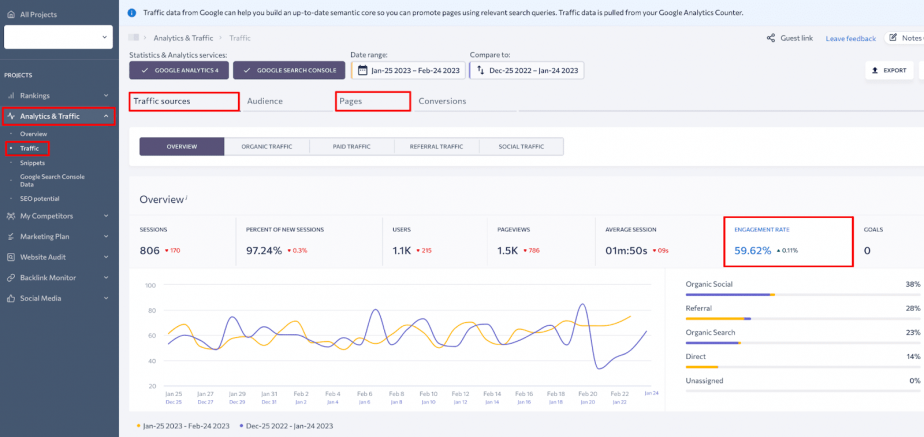
This enables you to analyze how people are engaging with both your overall website as well as for individual web pages without switching back-and-forth between browser tabs.
What can the bounce rate be used for?
Although the engagement rate provides a more detailed understanding of how users engage with your website, the bounce rate still has its uses in SEO. More specifically, the bounce rate can be an indicator of a website’s performance and the page experience it provides.
A high bounce rate could suggest that visitors are not finding what they’re looking for on your website or that the website’s content or design is not engaging enough. This information can be used by website owners and digital marketers to identify potential issues and improve the website’s performance to increase engagement, search engine rankings, retain visitors, boost conversions and achieve their business goals.
Additionally, the bounce rate can still be a useful comparison metric to see how your website is performing relative to other websites or industry benchmarks.
While the engagement rate provides more granularity in user engagement, the bounce rate remains a relevant metric for website optimization and SEO.
Is the bounce rate a ranking factor?
The bounce rate is not a direct ranking factor for search engines like Google. However, some studies have shown a correlation between bounce rate and rankings.
A high bounce rate can negatively affect user experience, which in turn can indirectly affect a website’s ranking. If users are not satisfied with the content, navigation or layout of a website, they may leave without engaging with the site. This can ultimately result in lower engagement metrics, less time spent on the site, and fewer pages visited.
To improve a website’s ranking and provide a better user experience, it’s important to monitor and work on reducing the bounce rate as part of a comprehensive SEO strategy.
Reducing the bounce rate
To improve your user experience and lower your bounce rates, here are seven tips to follow:
- Enhance the loading speed of your web pages. When it comes to Core Web Vitals and page experience, it’s important to focus on three main metrics: the amount of time it takes for the largest element on a page to load (LCP), the amount of time it takes for a web page to respond to user input (FID), and how much the page layout shifts while the page is loading (CLS). Visitors are likely to lose patience and leave if your website is slow and these metrics are not optimized. Therefore, this is crucial to creating a better page experience and keeping visitors engaged.
- Optimize the page experience for mobile devices. With more people using their smartphones to browse the internet, it’s essential to optimize your website for mobile devices. A mobile-friendly website is a key step to keeping visitors engaged and preventing them from leaving early.
- Deliberately incorporate internal links and CTAs within your content. Adding internal links and call-to-action elements your content can keep visitors on your website longer and even convert them.
- Ensure that your content provides a great reader experience. Visitors are more likely to stay engaged and explore your website if your content is top-notch: well-organized, legible, visually appealing, and easy to read.
- Fulfill the search intent of your target audience. Ensuring that your content aligns with the search intent of your target audience can help lower your bounce rates. If visitors find what they’re looking for on your website, they are more likely to stay and explore your content.
- Utilize a table of contents, especially for longer articles. Using a table of contents in longer articles can make it easier for visitors to navigate your content and find what they’re looking for. This helps keep them engaged and prevents them from leaving your website early.
- Reevaluate the design of your website. When redesigning your website, you may want to focus on creating a clean, visually appealing design that is easy to navigate. Use whitespace effectively, choose colors and fonts that are easy to read, have a great website structure, and make sure to provide a great UX and UI across all devices.
By following these bounce rate SEO tips, you can improve your user experience and engagement, leading to lower website bounce rates and better SEO performance.
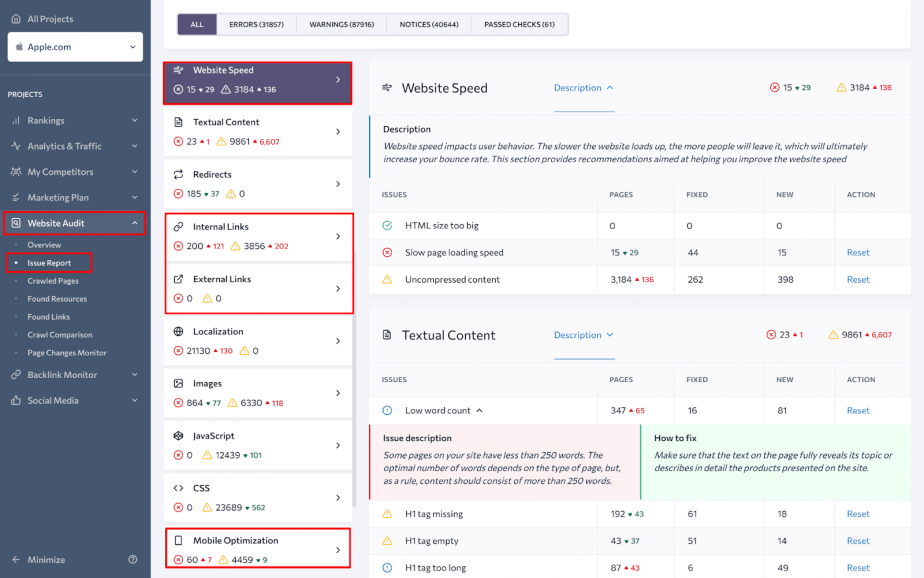
Need a nudge in the right direction? Just run your website through SE Ranking’s Website Audit tool to discover what can be fixed, including links, loading speed, and more.
Final thoughts
In conclusion, understanding the bounce rate in GA4 can help you gauge how visitors are engaging with your content and make informed decisions about optimizing your website’s performance.
However, while bounce rate has traditionally been the go-to metric, the new engagement rate metric offers some advantages in providing a more nuanced picture of how visitors are actually engaging with your website.
By paying close attention to both these metrics and taking steps to optimize your website to provide a better page experience for users, you can reduce and have a good bounce rate, increase the engagement rate, and ultimately achieve your digital marketing goals more efficiently.
Let me know what your experience with the bounce rate and engagement rate metrics is like! You’re welcome to share tips on how to improve and leverage them for better SEO performance.
