Posted by
Shay Harel
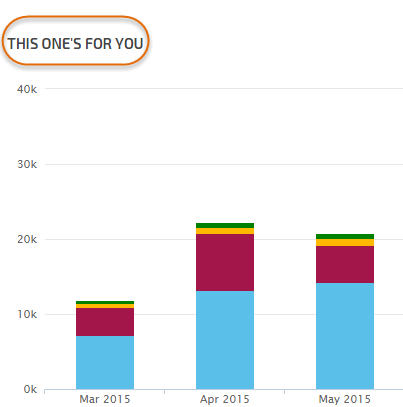
Getting a quick, user-friendly, and dynamic view of your Google Analytics data has never been easier… or this much fun! In a loud and colorful rebellion to dreary and overwhelming data, Rank Ranger is offering its new Stacked Columns widget to bring life to your analytics. We’re excited to launch this new tool that is sure to make evaluating your Google Analytics data more dynamic and more accessible.

Easy Analysis at a Glance
We’ve been told “image is nothing,” but does that remain a given in the world of data reporting and analysis? Experts estimate that 65% of people are visual learners. If your reporting and data is not visually accessible, you are inherently excluding the vast majority of the population from accessing it! Pulling out your magnifying glass to analyze the trends of your data simply isn’t advantageous. The Stacked Columns widget provides the ability to get a clear and user-friendly performance snapshot. By offering an engaging graphic representation of the data, the information it contains becomes accessible to anyone and everyone. Easy on the eyes, impactful on the mind, the Stacked Columns widget provides an instantaneous snapshot of just how well your site is performing. This is particularly significant when attempting to analyze trends over a prolonged period. You want something that is going to catch the eye while providing an instantaneous and meaningful data dive. Truth be told, the Stacked Columns widget offers you the best of both worlds, simply hover over any specific column and a full and easy to read array of numerical data appears.
Customization and Adaptable Reporting
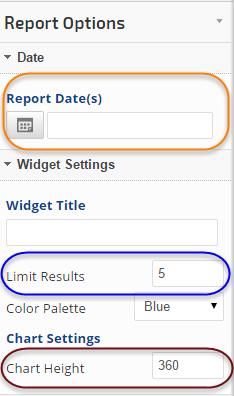
The uniqueness of the Stacked Columns widget shines through (literally) in its captivating visibility. However, we also understand that visibility is not a one size fits all medium. Keeping this in mind, we have provided a plethora or palettes for your viewing pleasure. You may see a red column and want to paint black, with the Stacked Columns widget… you can. This advantage allows you to carefully cater the data presented to your intended user, even if it is yourself!

 Data has a tendency to be overwhelming. Taking this into consideration we’ve enabled you to limit the results displayed in the columns. So if for example, you want to show traffic referrals per social network, you can limit your results to however many social networks you see fit to include. The same holds true with the range of the data itself. You may wish to show a year-long trend, or you may wish to limit the data to say 3-4 months. This again allows you to carefully consider your end-user and their specific needs and preferences.
In fact, the very size of the widget is completely at your disposal. If you would like to feature it prominently in a report you can adjust the size accordingly. Want to feature the graph as sidebar of sorts? No problem, you can size the widget appropriately for such a functionality as well. The adjustability of the display size has significant implications for your reports. Being able to adjust the size of the graph enables you to insert an adjacent text box with supplemental information or explanation. Doing so allows for a dynamic presentation that caters directly to your end-user.
Last, but not least, the customization options that are offered give you the ability to title the widget however you would like. That generic feel that data reporting often engenders is thereby no longer a concern when drafting reports. Imagine it as the white glove treatment to data reporting that would give a warm and fuzzy feeling to any client or end-user. It’s the kind of thing that says, “I care about you, your report is not just any report, it’s your report.”

Friendly Filtering
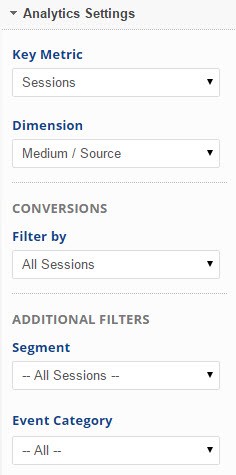
Our Stacked Columns widget gives you access to all of the data filters you’ll find within Google Analytics, with access being the keyword. By offering simple all-inclusive drop-down menus, the Stacked Columns widget lets you change the parameters of your data on a dime without any of the nuisance of having to find your way back to your graph. These filtering options are laid out in a methodical user-friendly way so that you never have to exhaustively search for a specific filter.
 Filter your data by Key Metrics such as (and of course not limited to):
- Sessions
- Bounces
- Page Views
- Pages Per Session
- New Users
The widget further allows for filtering by various Dimensions including:
- Source
- Keyword
- Campaign
- Social Network
- Referral Path
Additionally, the data can be broken down by Conversion types, for instance:
- All Goals
- Buy Now
- Pages per Visit
- Registration
- Time on Site
Lastly, your data can be broken down by Segment, among them:
- Direct Traffic
- Mobile Traffic
- Referral Traffic
- Organic Traffic
- Paid Traffic
No matter how you break it down (or filter the data) the new Stacked Columns widget ushers in a whole new era in analytics visibility. Graphic visibility and friendliness are not a luxury, but an integral, yet often ignored, part of data analysis. The Stacked Columns widget allows you to build that bridge between your data and your user, which after all is the whole point isn’t it?

