Posted by
Rank Ranger
Making sound business decisions is all about meeting a demand that your market thirsts for. One of the basic elements in meeting market demand is understanding your customer base. The better a business understands its end-user, the better it can cater its product or service to meet customer needs and wants. Simple as this point may be, you need a data source than can provide you with potent insights. One of the most common methods of gaining such insights is Google’s Audience Interests. You can now view and filter Google’s Audience Interests data in our reports, and share any of the graphs or tables in white label reports.
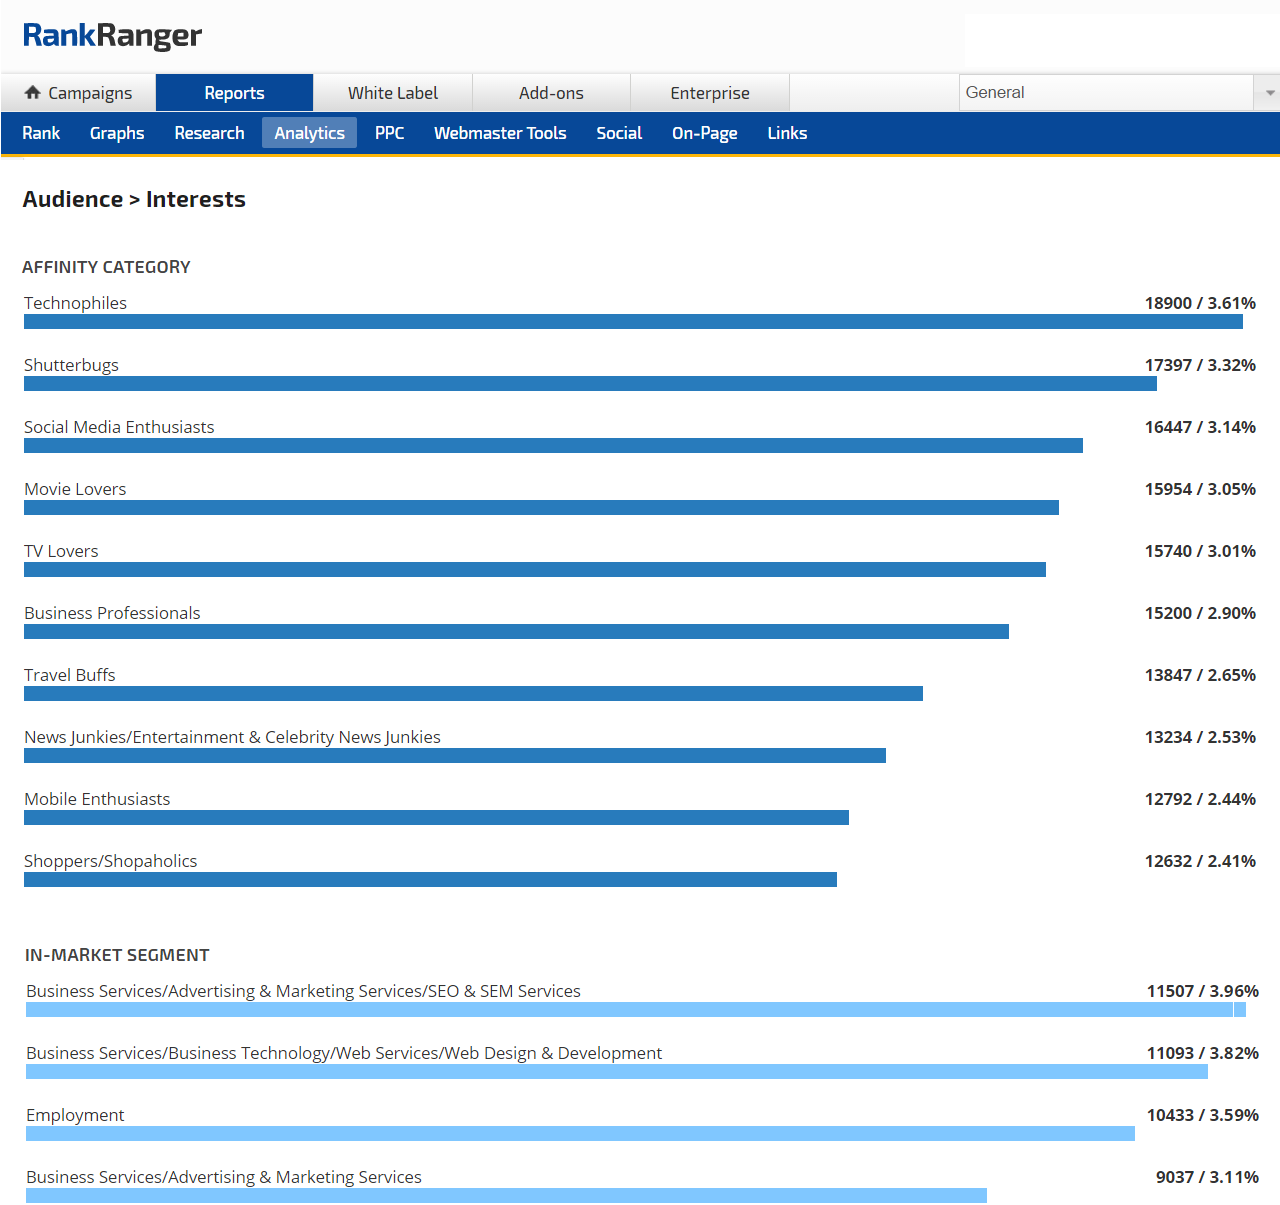
Customizing Google’s Audience Interests Reports
Qualifying your Google Analytics traffic data, Google’s Audience Interests gives you insights into the passions, hobbies, and tendencies of users who have visited the tracked site. What we’ve done with our Audience Interests Report is to put a unique set of customization options at your disposal so that you can display and analyze your Audience Interests data according to your needs and preferences.
In-platform Audience Interests Graphs and Tables
Google breaks down their Audience Interest data into three classifications: Affinity Category, In-Market Segment, and Other Interests. Each category provides a unique breakdown of your audience’s preferences. As such, the Affinity Category organizes users based on hobby and lifestyle, whereas the In-Market Segment breaks down users closest to making a purchase by their area of interest (the Other Interest segmentation consists of users that don’t fit into either of the other two categories). Of course, there is a natural use for such data when setting up PPC campaigns. Knowing the interests of your users, particularly those honing in on a purchase, can make for a highly effective PPC campaign. Similarly, measuring the success of utilizing Audience Interests data as part of your PPC campaigns is of equal importance, which is why we also offer a slew of reports to track such campaigns.
Taking into consideration the simple fact that our own users have different data presentation preferences, we’ve made it possible to show your Google Audience Interests data both graphically via horizontal bar graphs, or numerically via a series of tables.
Audience Interests Horizontal Bar Graph
The Audience Interests graphs present an easy to decipher visual depicting an interest based breakdown of the users found within a given category. The horizontal columns within the graph are accented by a figure indicating the number of users within that specific segmentation, along with the percentage of overall users the segmentation represents.
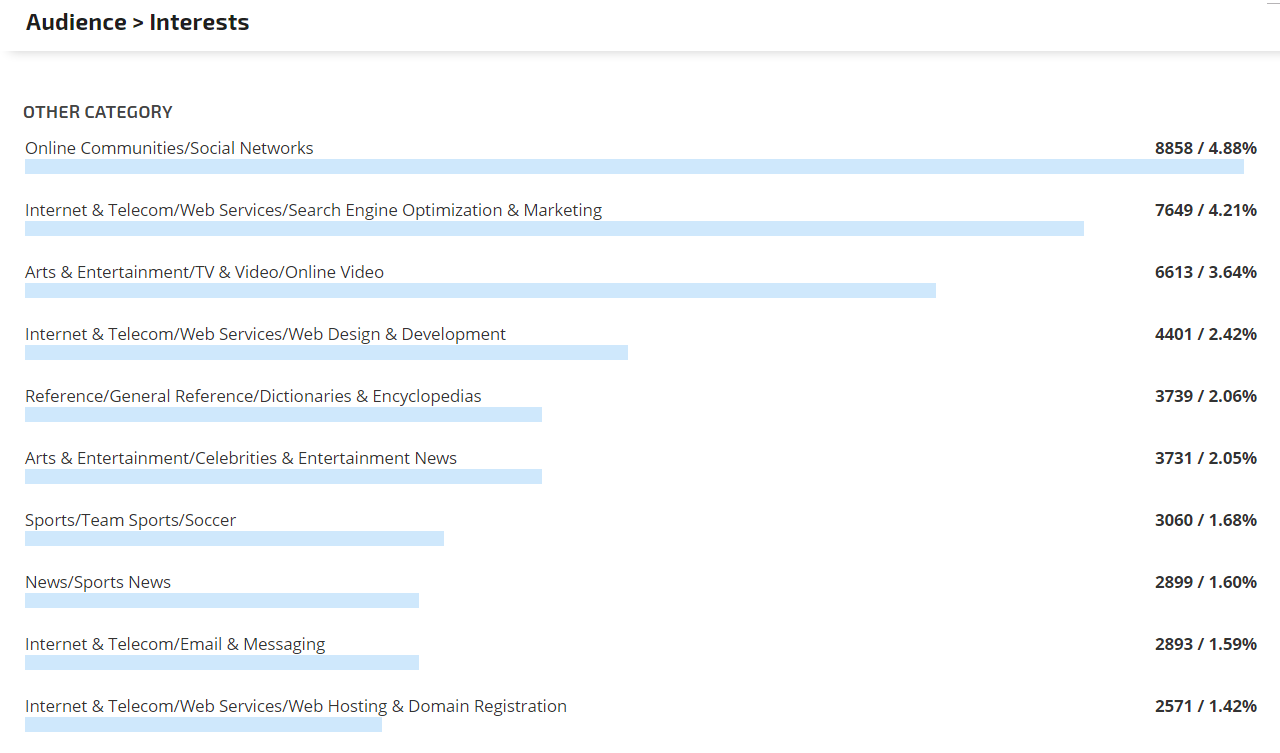
A graph displaying the top 10 sub-divisions of the “Other Category” within Google Audience Interests
Audience Interests Tables
Depicting your data in a strictly numerical fashion, the Google Audience Interests tables present the following metrics for each of the available categories:
- Sessions
- % New Sessions
- New Users
- Bounce Rate
- Pages/Sessions
- Average Session Duration
Each of these metrics can be displayed in either ascending or descending order. Additionally, and unlike the graphs within the report, tables can be set to limit results to specific threshold. Meaning, that unlike the graphic elements available within the report, the Audience Interests tables can be set to show a full breakdown of the interests subdivisions within an “interest category” or a specific number of subdivisions.
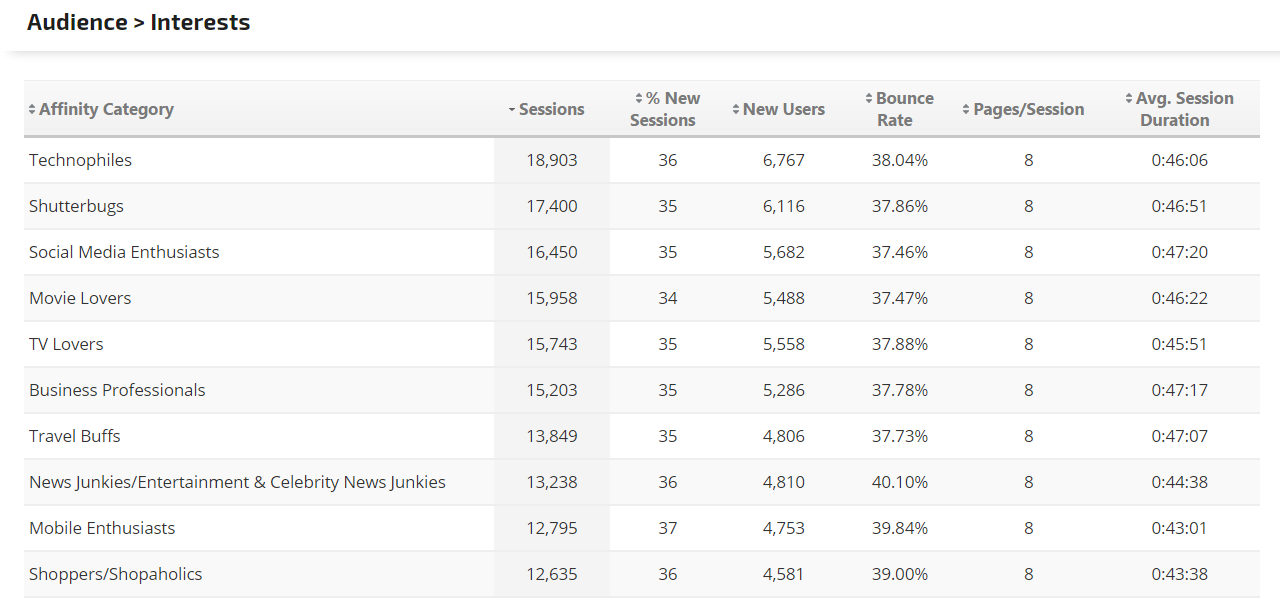
A table presenting various metrics related to the Affinity Category within Google’s Audience Interests
Custom Audience Interests Display Options
By segmenting each category of Google’s Audience Interests data, and by offering both graphic and numeric presentation options, we’re able to offer you a unique way to access your audience insights.
Firstly, you have the option to either show or hide any graph or chart within the report. That is, as we’ve broken up the Audience Interests data by category, with each category having its own graph and chart, you can choose precisely which data you want displayed and in what format (graph, chart, or both).
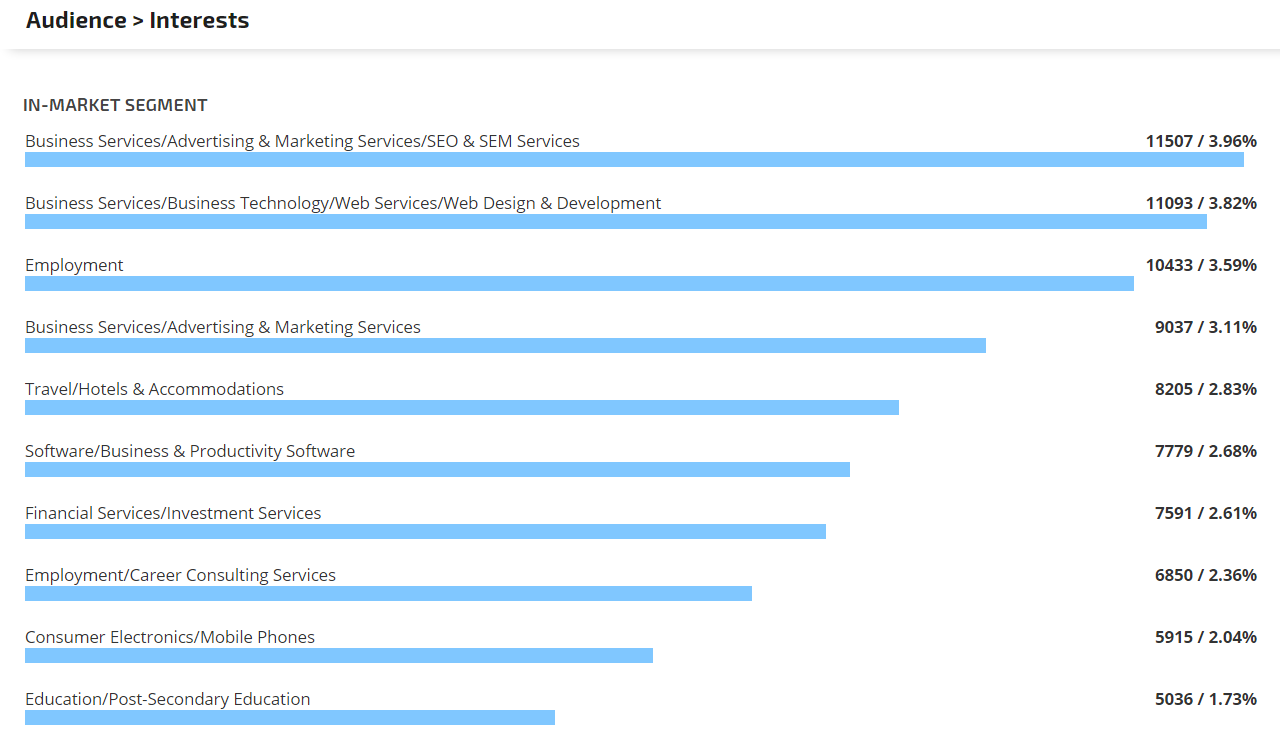
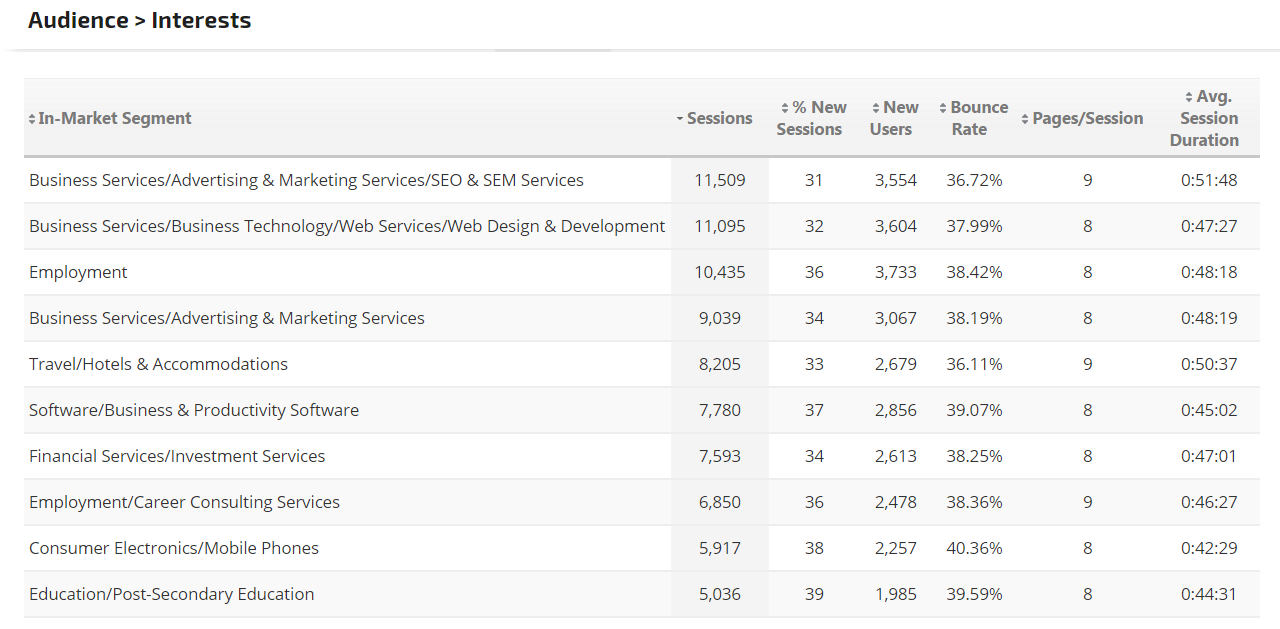
The Audience Interests report set to show only the In-Market category’s graph along with the category’s accompanying chart of metrics
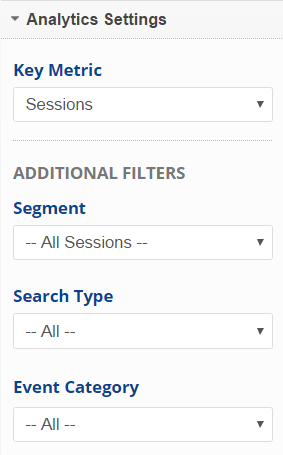 Further, and since the data being displayed is sourced in Google Analytics, our report allows you to filter your Audience Interests data in any way allowed for within Google Analytics. As such, you can show interests data according to specific segments (such as Converters, Bounced Sessions, New Users, etc.). You can further filter your audience insights by search type. Meaning, you can show Audience Interests data according to traffic source (i.e. organic, paid, social, etc.).
The result is the ability to view your Audience Interests data according to the segmentations that are most pertinent to you or your clients. Having the data available to you in this manner streamlines your ability to access the audience information that is meaningful to the context of your or your client’s business operations. As such, you are afforded the data and insights you need, in the format you need, so as to make more informed business decisions without the clutter of irrelevant information.
Google Audience Interests Data in White Label Reports
With the integration of Google’s Audience Interests into our software, you can now present your data within any of our white label reporting options. Doing so offers you the unique ability to present audience insights under either your or your customer’s logo and label. In accordance with our numerous white label options, you can either share such data within automated PDF reports, as part of our active data Client Dashboard, or within our 100% white label Marketing Dashboard.
Via the recently launched Marketing Dashboard you are able to insert your Audience Interests data within a reporting dashboard that offers you full access to the HTML and CSS. As such, your Google Audience Interests can be seen within a KPI dashboard that can be coded to look and feel like your or your client’s website. Further, you can easily combine your Audience Interests data with other Google audience measuring information, such as geo-location and audience demographics.
The white label Marketing Dashboard displaying Google Audience Interests data along with a breakdown of audience geo-location and demographics
Peak Your Interest with Audience Insights
Obviously knowing the customer is of the utmost importance, and as such Google’s Audience Interests is well… of self-evident interest. The question is how to make it work for you in a way that is efficient, effective, and easy. With the custom display options we’ve built you can see the Audience Interest data that you want to see and how you want to see it. What’s more, by including Audience Interests in your white label reporting you can offer your clients a deeper look at the makeup of site traffic all while considering and catering to client specific needs and reporting preferences.

