Posted by
Shay Harel
Just in time for a Google SERP fluctuation frenzy, the newly released Mobile SERP Feature Tracker saw a seesawing series of SERP features over the course of July. Join me as I investigate what went up, what went down, and which SERP feature data trends on mobile corresponded to desktop throughout the month of July.
A Highly Fluctuating Mobile SERP
The end of July saw a continuous series of high SERP fluctuations on mobile. When I say the “end” of July, I literally mean the last 10 ten days of the month saw an uninterrupted series of warm to high fluctuations on the mobile SERP. Hitting a high on July 28th with a Risk Level of 81, the mobile SERP was bouncing all over the place with a set of fluctuations that seemed to never end.
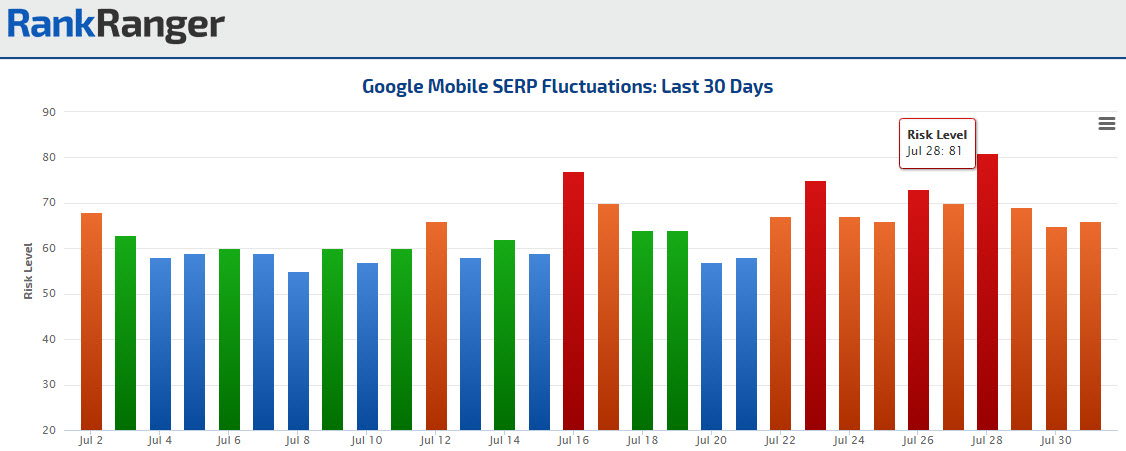
Fig 1. The Rank Risk Index monitoring Google SERP fluctuations on mobile saw a 10 day series of moderate to high fluctuations with a Risk Level peak of 81 on July 28
There’s obviously no ignoring a set of fluctuations like the ones shown here on the Rank Risk Index. Luckily, with the roll-out of Rank Ranger’s Mobile SERP Feature Tracker, I can now show you an in-depth analysis of mobile SERP feature trends and patterns. As always, I can certainly show you the corresponding data, but any conclusions I may make are of course my own speculation as no one really knows what lies beneath the shadows of the SERP.
Mobile SERP Features Trends: July 2016
In taking a dive into the deep end data of last month’s mobile SERP feature **** let’s backtrack to July 12. If you look again at Figure 1 you’ll notice that the July 22nd fluctuation was preceded by a quick one-day fluctuation event that took place on the 12th. Quite interestingly, two SERP features on mobile showed some movement right around that time. When I plotted the data from the Mobile SERP Feature Tracker onto an Insight Graph, I got some interesting results and patterns which can be seen below.
Related Questions and Local Pack’s Mobile SERP Data Shift
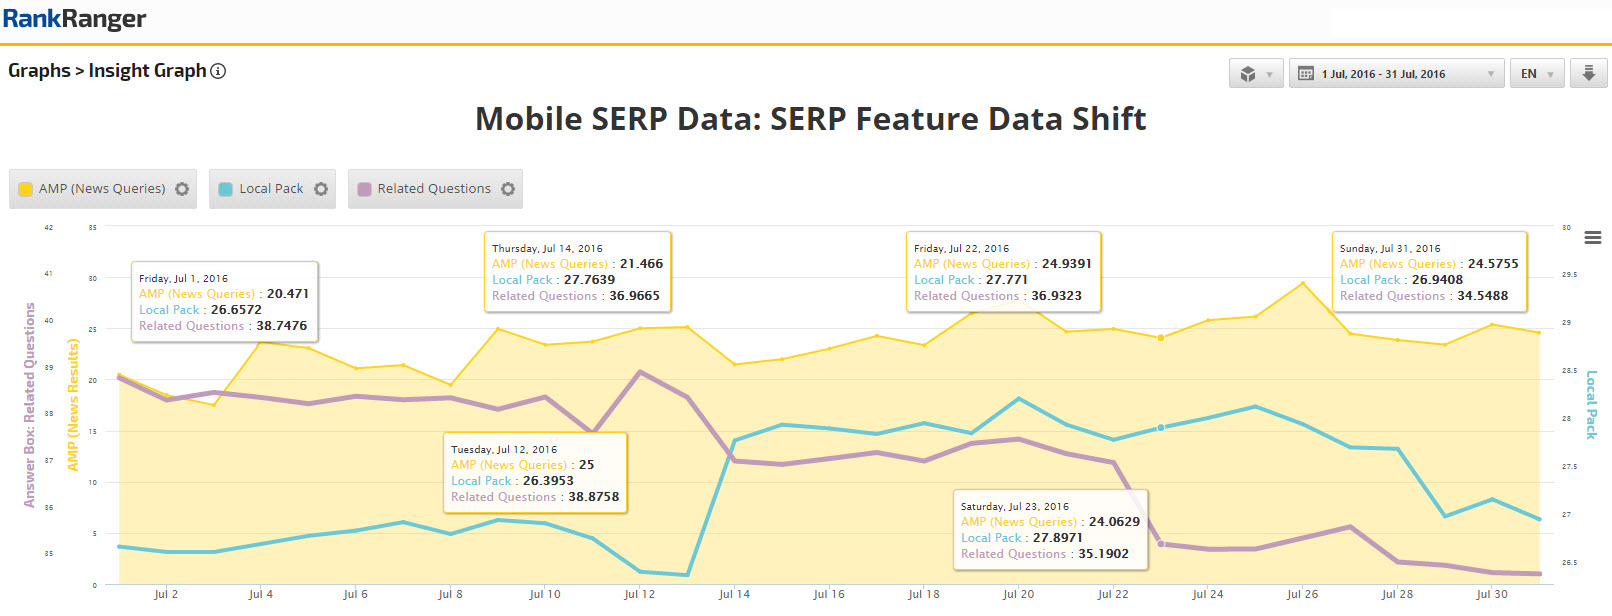
Fig 2. Local Pack and Related Questions on mobile shift in correlation to a July 12 fluctuation on the Rank Risk Index (mobile)
Let me first begin by unequivocally stating that a lot of the upcoming data you will see is not tremendously impressive vis a vis numbers per se. Rather, and in my mind more importantly, the data you will see reflects shifts in SERP feature trends that correlate to fluctuation levels. This data should be viewed in aggregate, forming an overall SERP data pattern, a pattern that leads towards certain conclusions – disclaimer done.
With formalities out of the way, Related Questions on mobile, which began the month showing on 38.7% of Page One results, took a bit of a dive that, you guessed it, began on July 12. By the time the 14th rolled around, the feature lost almost two whole percentage points, showing in 36.9% of Page One results. Local Pack followed an inversely similar path, spiking from showing in 26.4% of Page One results on the 13th to presenting itself in 27.8% of Page One results on the 14th. You’ll notice in Figure 2 that this sort of shift is uncharacteristic of the feature, though not completely out of the question (in line with the moderate, not yet high, fluctuation level of July the 12th).
Back to the real action on July 22nd and the features here did not disappoint as Related Questions downshifted yet again starting on the 22nd losing another roughly 2.5 percentage points by month’s end. Local Pack also seemed to be part of the end of month madness, dropping about one percentage point within the same time frame. (Just in case you’re wondering why I showed AMP data that does not correspond to any of the above data shifts… how could I talk about the mobile SERP without indicating AMP data, so there, obligation fulfilled!)
A Series of Mobile SERP Feature Trend Shifts
I know what you’re thinking, two SERP feature shifts to explain all of those fluctuations, come on?! (Actually how could I know what you’re thinking, but wouldn’t it be nifty if I could?) Be at ease, there is plenty of mobile SERP feature trend shifting to go around!
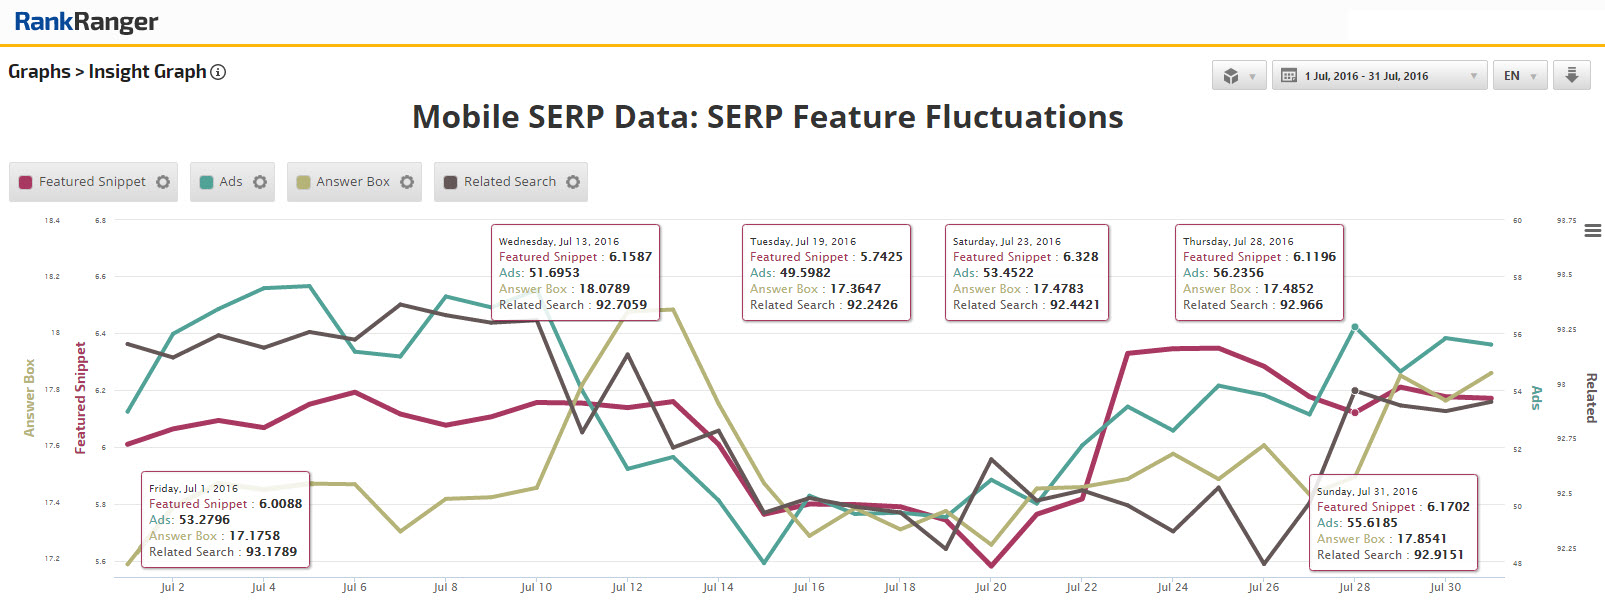
Fig 3. A series of SERP features on mobile show a mid-month drop off followed by a late month resurgence
Return to Figure 1 for a moment and you’ll notice that the one day and moderate fluctuation of July 12th was followed by a two day and more serious fluctuation that began on the 16th. Lo and behold, that series of features took a mid-month dive with some features dipping as early as July 10th. By the time we get to the 16th a new and observably lower data trend is in effect, just in time for the fluctuation spike indicated in Figure 1. By the time we get to July 19th, Featured Snippet decreased to 5.7% of Page One results (from 6.2% on July 13), Ads lost nearly 8 percentage points (as measured from July 10), Answer Box dropped to 17.5%, and Related Search dipped about .5 percentage points (keep in mind that Related Search is typically one of the most stable features on the SERP).
Here’s the best part of it though, you’ll notice here that the features rejected their new data path and began to up-shift to more traditional levels from the 22nd and on…. which corresponds to…. the ten day fluctuation spike indicated in Figure 1!
But wait there’s more…. another three features, though not taking a major mid-month shift (though they did “bump” a bit), showed peculiar end of month fluctuations.
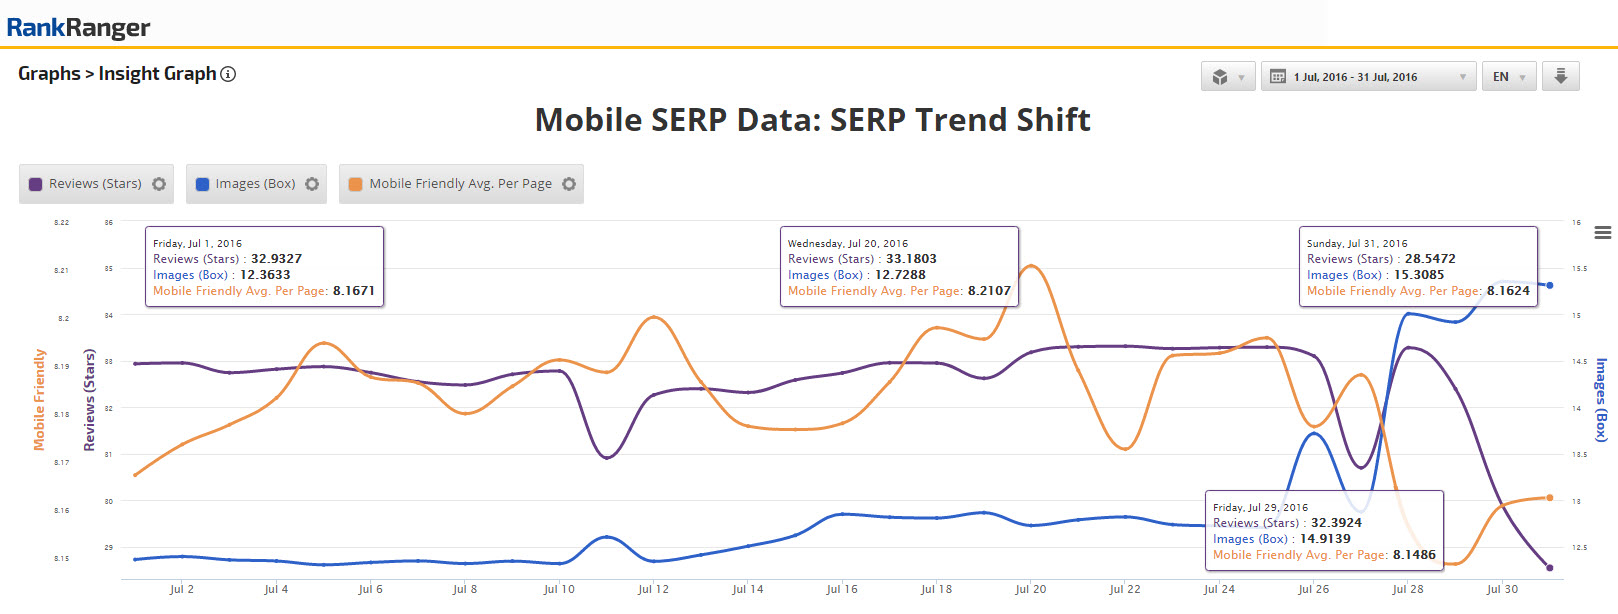
Fig 4. Reviews, Images (Box), and Mobile Friendly (Average Results) undergo a data trend shift towards the end of July
When looking at the pre-shift performance of these features on July 20th in comparison to end of month (and post-shift) levels, Reviews sunk over 4.7 percentage points, Images (Box) spiked over 2.5 percentage points, and Mobile Friendly (Average per Page) hit a monthly low, appearing in an average of 8.1 Page One results. Again, you’ll clearly notice that the features shift and entangle in relation to the ten day, end of month, mobile SERP fluctuations.
Organic Results Mobile Decrease
Wrapping up our look at mobile SERP fluctuation (potential) causality and definite symmetry are the number of organic results that displayed on mobile. In what might be the most significant mobile SERP pattern to shift last month, the total Results per Page, along with the percentage of Page Ones showing 10 Organic Results took on a late month decrease. A decrease that coincided with a large portion of July’s 10 day fluctuation spike.
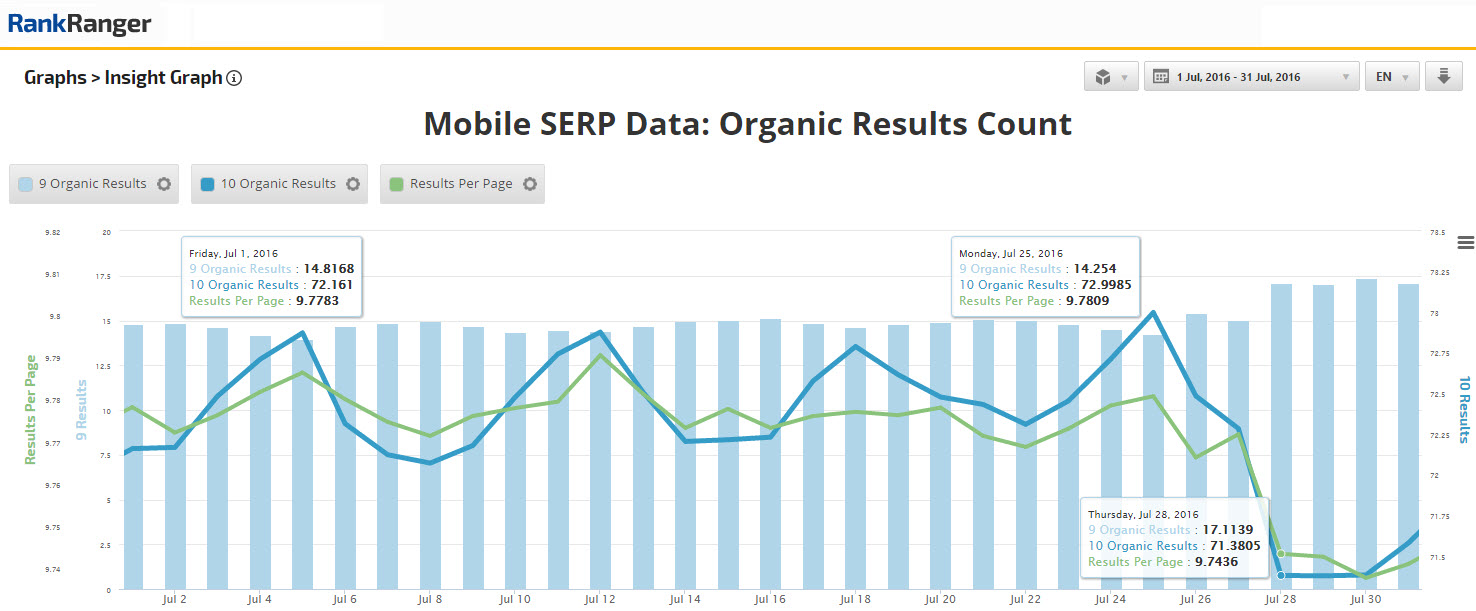
Fig 5. Organic results on mobile show fluctuations that correlate to the end of month fluctuations on the Rank Risk Index
In fact, just as the mobile Rank Risk Index hit its fluctuation high of 81 on the 28th, Results per Page and 10 Organic Results hit their new lows. In relation to July 25th highs, 10 Organic Results saw a roughly 1.5 percentage point decrease by the 28th. With perfect logic, the number of 9 Organic Results catapulted, gaining just shy of 3 percentage points between the 25th and 28th.
SERP Analysis of Desktop SERP Feature Fluctuations
While not as volatile as the mobile SERP, fluctuations on desktop, particularity at the end of the month (like mobile), were significant.
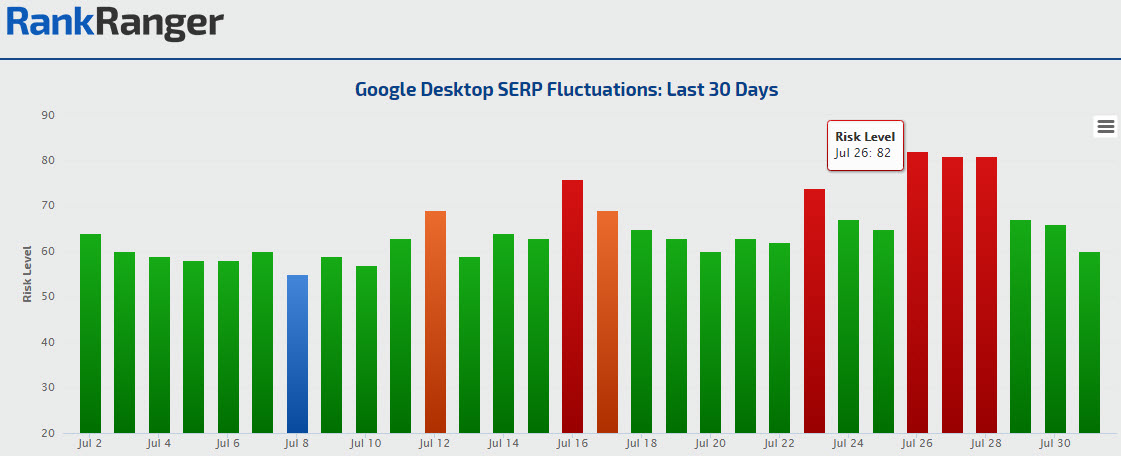
Fig 6. Like the mobile SERP, the Rank Risk Index indicates a series of end of month fluctuations on the desktop SERP
Though not quite a 10-day series, fluctuations on desktop from July 26 though the July 28 were quite high and followed a spike on July the 23rd as well. Correlating to mobile fluctuations, Risk Levels on desktop were moderately high on the 12th, and showed a two day bump from July 16th to the 17th.
SERP Features on Desktop Data Behavior
Getting back to desktop with the SERP Features Tool, and integrating yet again with an Insight Graph, some familiar faces appear. Like on mobile, Answer Box, Local Pack, Reviews, and Images (Box) underwent a SERP pattern shift.
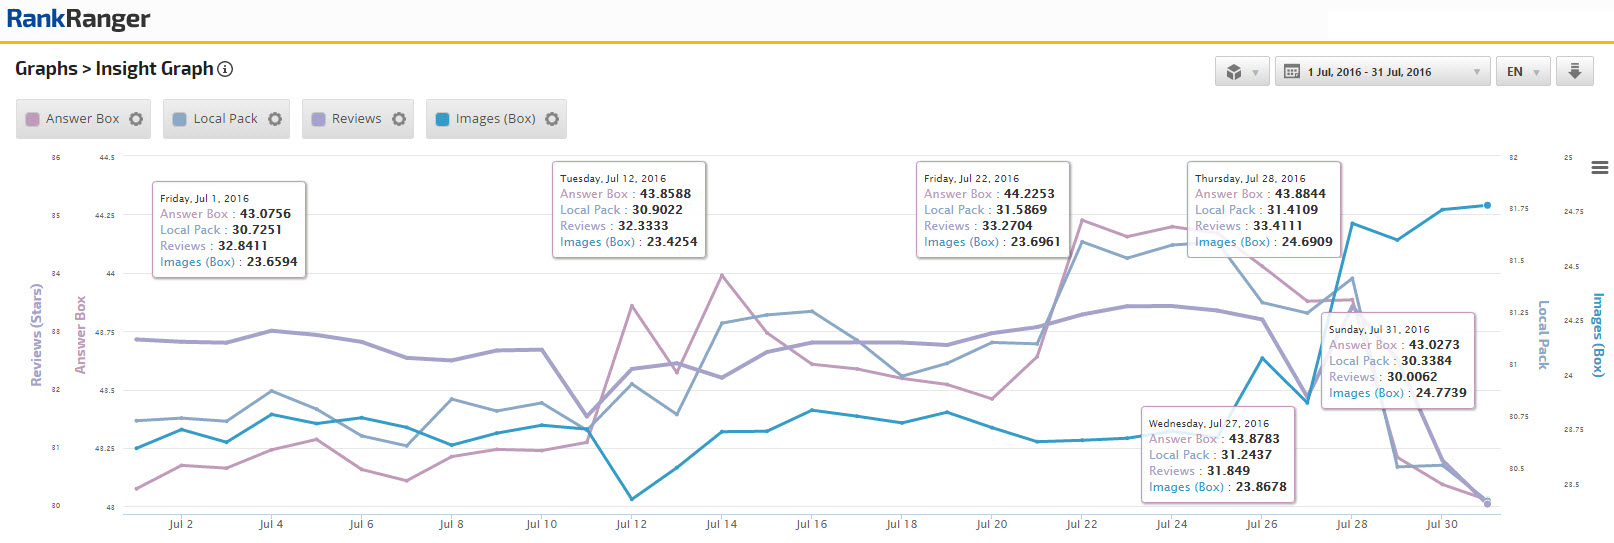
Fig 7. Answer Box, Local Pack, Reviews, and Images (Box) undergo a set of two data shifts in July that correlate to Risk Index fluctuations
Timing is everything and the timing here couldn’t really be more perfect. You’ll notice that the features started out the month showing relatively little volatility. You’ll also notice that around the 12th things start to pick up a little and some volatility enters the arena, which is coincidentally when the Rank Risk Index presented a moderate spike in fluctuations. As the month continued to progress, volatility remained minimal, until about the 24th, which again is just about when the index showed some serious SERP fluctuations.
Both Answer Box and Local Pack followed a similar data path with a spike beginning circa July 20th followed by a drop off by month’s end. Specifically, Answer Box began a spike on July 20th rising almost a full percentage point by the 22nd. However, the feature ended the month down roughly 1 percentage point from its July 20th high.
After some initial fluctuation, Reviews peaked on July 28th showing within 33.4% of Page One results although it was all downhill from there as the feature lost just over 3 percentage points in that many days, ending the month within 30% of Page One results. Quite the inverse, Images (Box) spiked to 24.8% by the 31st, up over a point from its July 12th monthly low (again, you can easily see that the feature generally does not fluctuate to this extent).
Featured Snippet, Ads, and Related Questions also saw late month volatility that was in line with the index’s fluctuations. In fact, Related Questions spiked to a monthly pinnacle on July 12, before slumping by the 16th, two behaviors that are again consistent with overall SERP fluctuation levels. Similarly Ads saw a short decline from July 11 – July 13 before picking back up.
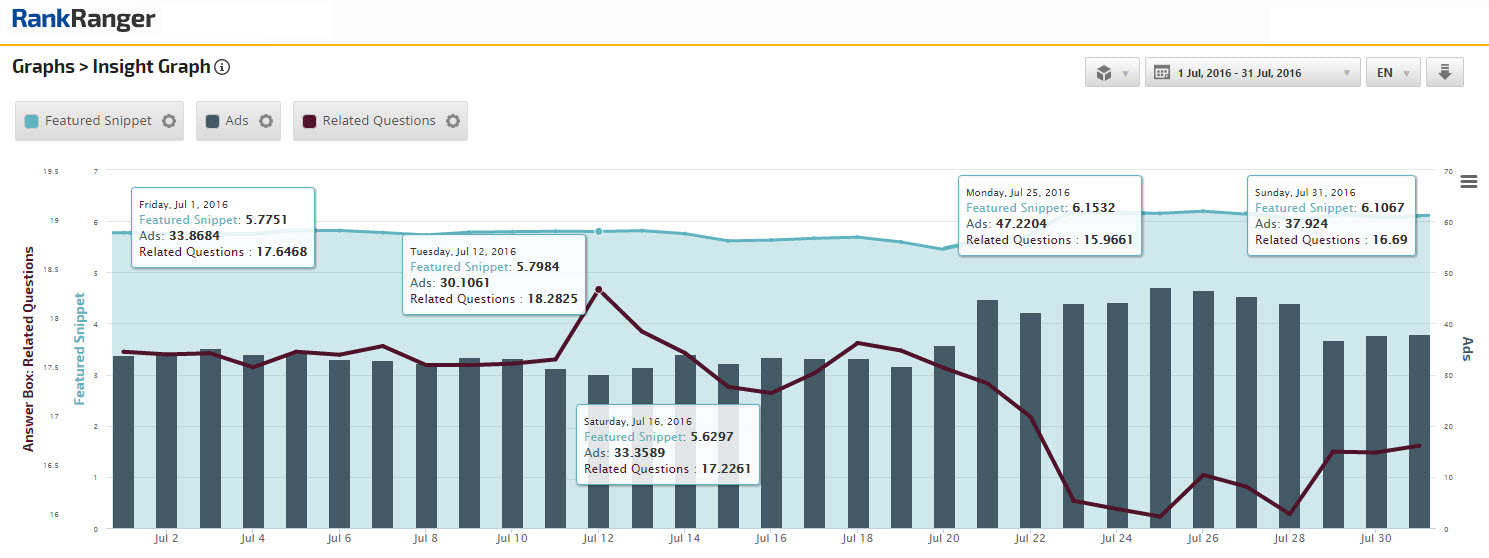
Fig 8. Featured Snippet, Ads, and Related Questions show higher than average data volatility on desktop from July 21st and on
Though Featured Snippet showed less mid-month volatility, it ended the month breaking the 6% plateau, this after climbing more than half a percentage point between July 20th and the 24th. Ads saw a spike towards the end of the month rising just over 13 percentage points between July 19th and 21st. However, by July 31st, Ads lost over 9 percentage points from its July 25 high of 47.2%. Though perhaps more gradual, Related Questions also presented a data pattern adjustment consistent with late month index fluctuations losing over 2 percentage points between July 12th and the 28th (after which the feature rebounded slightly).
SERP Composition Changes on Desktop
Like mobile, organic results on desktop underwent a late July adjustment. Peaking on July 25th, Results per Page along with 10 Organic Results plunged by the 28th with 10 Organic Results losing over 1.5 percentage points.
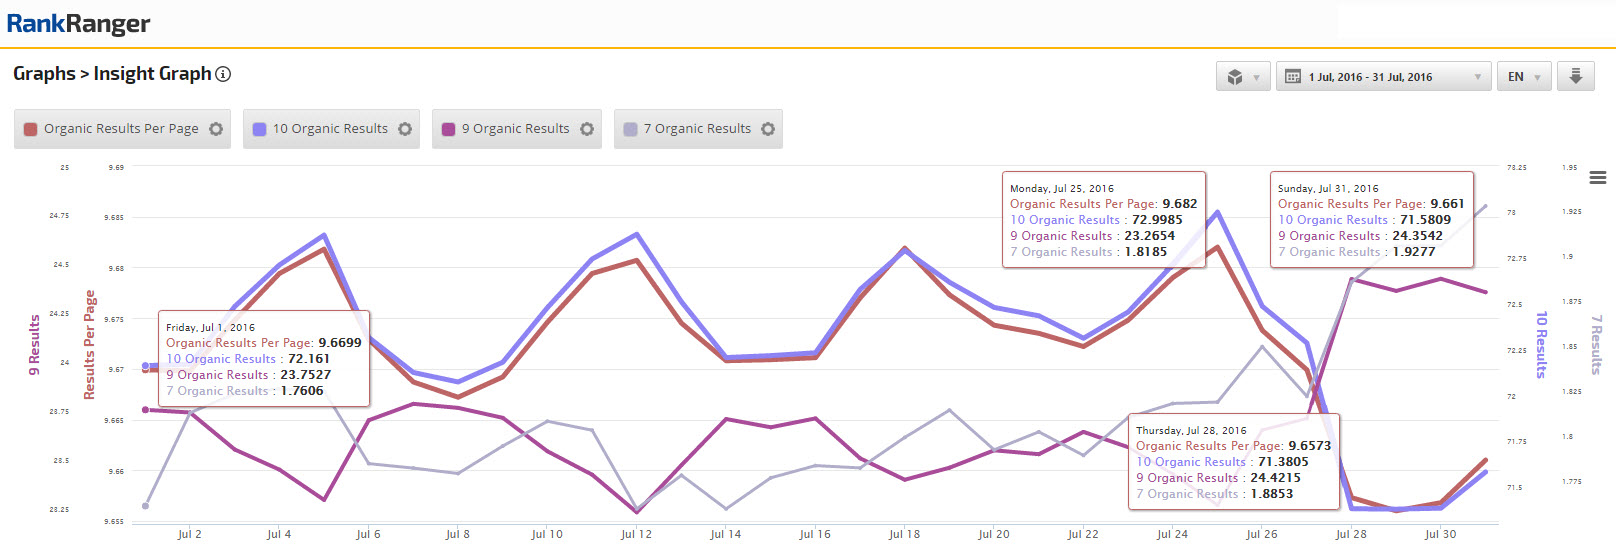
Fig 9. Organic results display steep data changes between July 25 through July 28
Again, similar to mobile, as 10 Organic Results fell 9 Organic Results climbed over a full point between the 25th and 28th. Unique to desktop however, 7 Organic Results saw an uncharacteristic climb that corresponded to that of 9 Organic Results.
More than just changes within the organic results landscape, the SERP format on desktop saw an additional set of unique scheme/configuration changes. Home Page Results, Description Length, and Title Length all saw SERP data changes that paralleled overall SERP fluctuations.
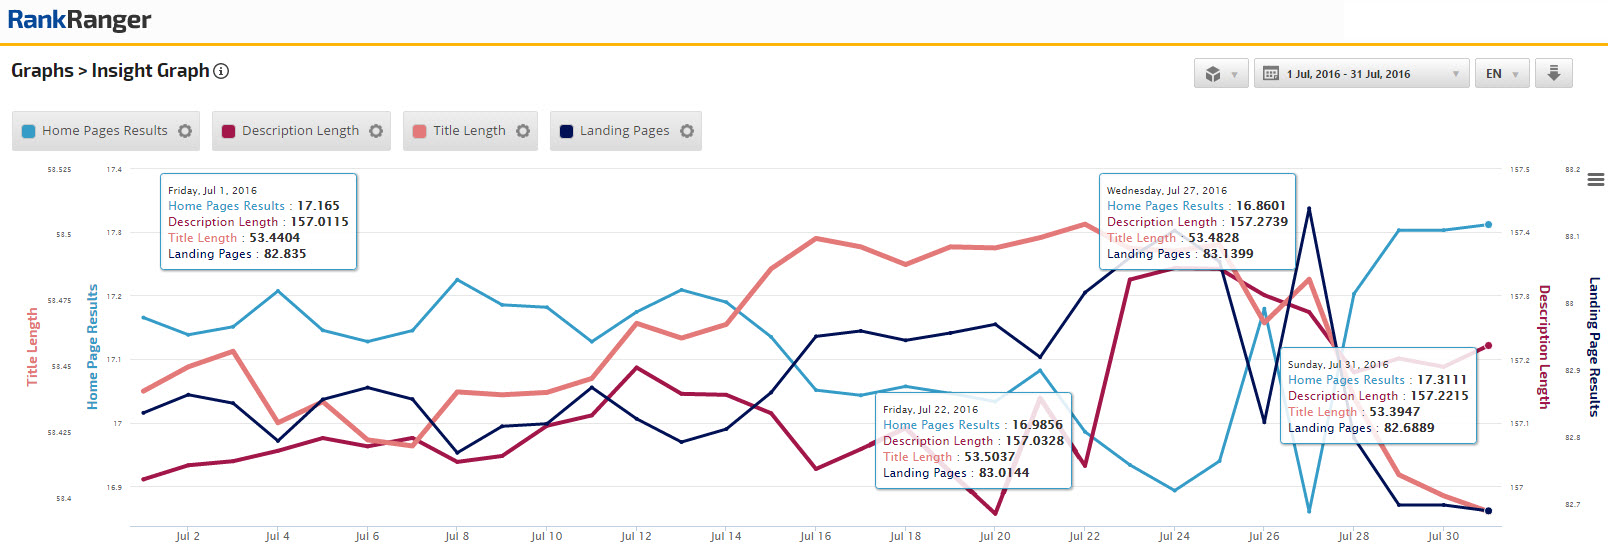
Fig 10. The scheme of the SERP undergoes changes as Home Page Results, Description Length, Title Length, and by default Landing Page Results fluctuate
The most notable data changes related to these SERP elements came circa July 20th…. need I say that this correlates to…?! The sharpest shifts came between July 25th though the 29th when Home Pages went though a series of peaks and valleys that saw the number of such pages on Page One of the SERP drop almost half a percentage point (which is a huge fluctuation in this particular case). By July 31st Home Page Results gained its losses back ending the month with 17.3% of results on Page One consisting of home pages.
Wrapping up our analysis, Description Length leaped almost .5 characters between July 20 and July 23rd. Keep in mind this means that the average length of descriptions on Page One of the SERP saw an increase, on average, of over an additional 1/2 a character. Title Length saw the opposite, sloping down from the 27th until the end of the month in what you can see was, relatively speaking of course, a deep decline when considering tradition performance.
SERP Fluctuation Causality
With the plethora of perfectly timed SERP feature volatility on both mobile and desktop, it’s hard to deny the correlation between feature data changes and the SERP fluctuations caught by the Rank Risk Index. At the same time, and as I mentioned earlier, no one other than Google can offer a purely decisive explanation. That being said, there does seem to be a strong case that the high fluctuations were directly related to shifts I’ve noted.
What do you think was behind the wild SERP fluctuations we saw during July?
Have you been impacted by the changes to the SERP? If so, how?
Will next month bring a correction or are the new data patterns of some of the noted features here to stay?
Per personal policy, I’d **** to hear your thoughts. Until then, stay watchful of SERP fluctuations and shifts and let me know what you see as the month progresses!

