We analyzed 500k queries to find patterns and triggers enabling SGE results.
We started to research SGE in June 2023 and have conducted bi-weekly scrapes of 100-500k keywords along with data analysis from our R&D team.
From this data, we have in-depth findings about SGE development and ranking factors.
While verticals are not the only aspect that affects whether we’ll see generative AI in search result pages or not, the vertical’s topic is the strongest of all the factors we’ve measured.
Although Google’s Search Generative Experience (SGE) is not showing up for all of the user queries, the rollout of SGE will have a different impact on your organic traffic acquisition, depending on the vertical in which your business operates.
Let’s start with the statistics and what we found.
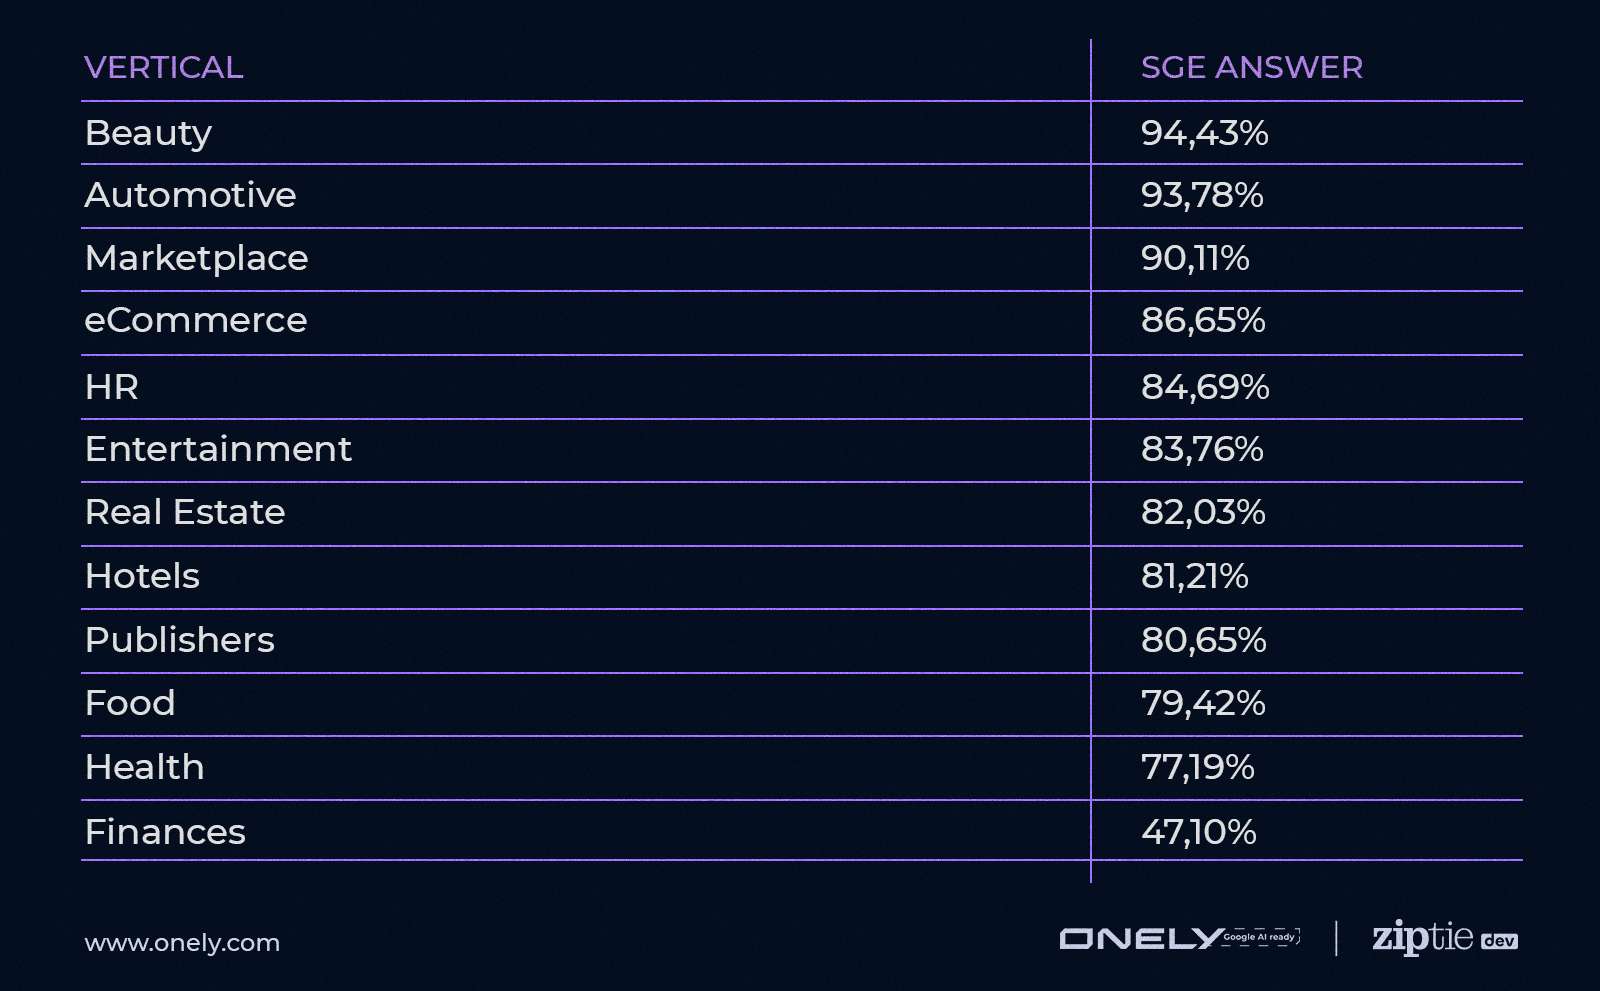 Image from author, April 2024
As you can see above, the verticals differentiate significantly. This is a key data point when starting your SGE optimization journey.
While most verticals seem to be in the 80-90% range, the financial vertical is a strong outlier, with 47% SGE coverage compared to the beauty industry, which has 94% query coverage.
Before I dive into more exciting findings from our research, I wanted to stop for a second and address the elephant in the room: Google SGE and YMYL & E-E-A-T.
Google SGE, YMYL & E-E-A-T
Google began to hold websites to a higher standard around 10 years ago, and the guidelines for so-called “Your Money, Your Life” (YMYL) content became stricter year after year.
Two of the verticals (health and finance) with the lowest Google SGE coverage fall into that category. However, what came as a shock for me is that despite it being one of the lowest-covered categories, health-related queries were covered almost 80%.
Google SGE presents AI-generated answers to queries like [cure for cancer].
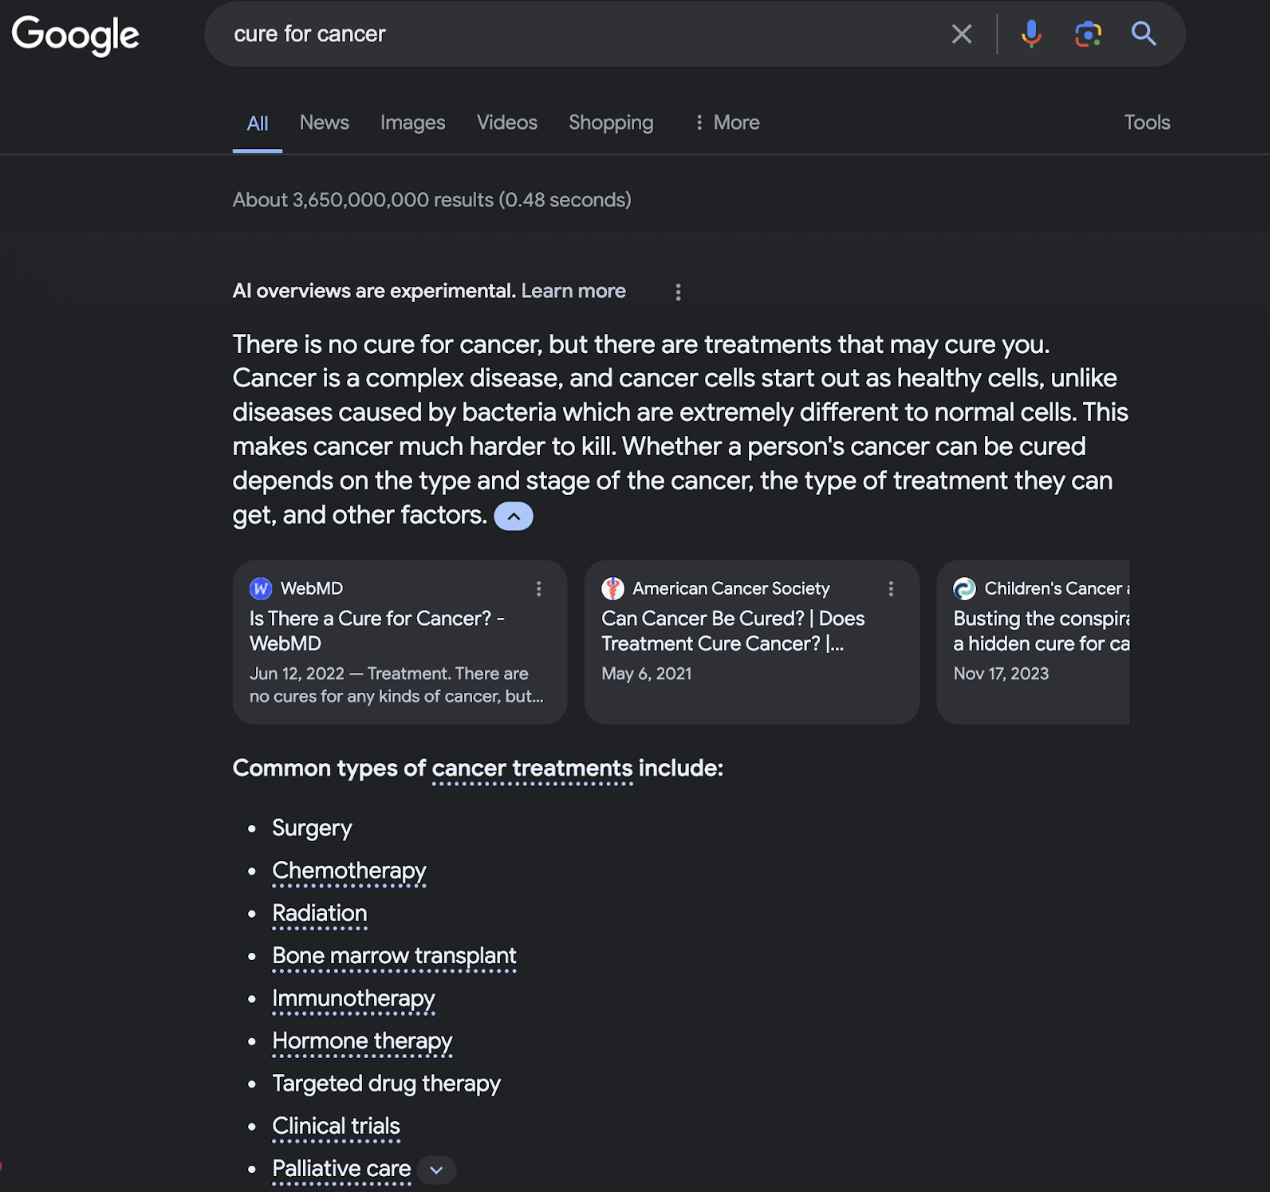 Screenshot from search for [cure for cancer], Google April 2024
Not only is Google SGE using AI to cover YMYL queries, but our research suggests that Google’s AI search results will be present more often in the future.
Google SGE Will Cover More Queries Over Time
Our early Google SGE research on July 1, 2023 revealed that the finance/investing vertical was only 22% covered. Our check in April 2024 showed 47% coverage of the same group of queries.
We have been tracking Google SGE coverage since its inception and observing Google’s efforts to increase SGE coverage month after month.
Based on these trends, my prediction is that we’ll see more Google SGE results as soon as Google gathers more data, allowing for a higher certainty of high-quality results with lower chances of AI hallucinations.
Understanding The “Generate” Button And How You Can Use It To Prioritize Your SGE Optimization
If you’ve been using Google SGE for a while, you’ve seen this button multiple times. In some cases, Google will show a “Generate” button rather than showing Google SGE results by default.
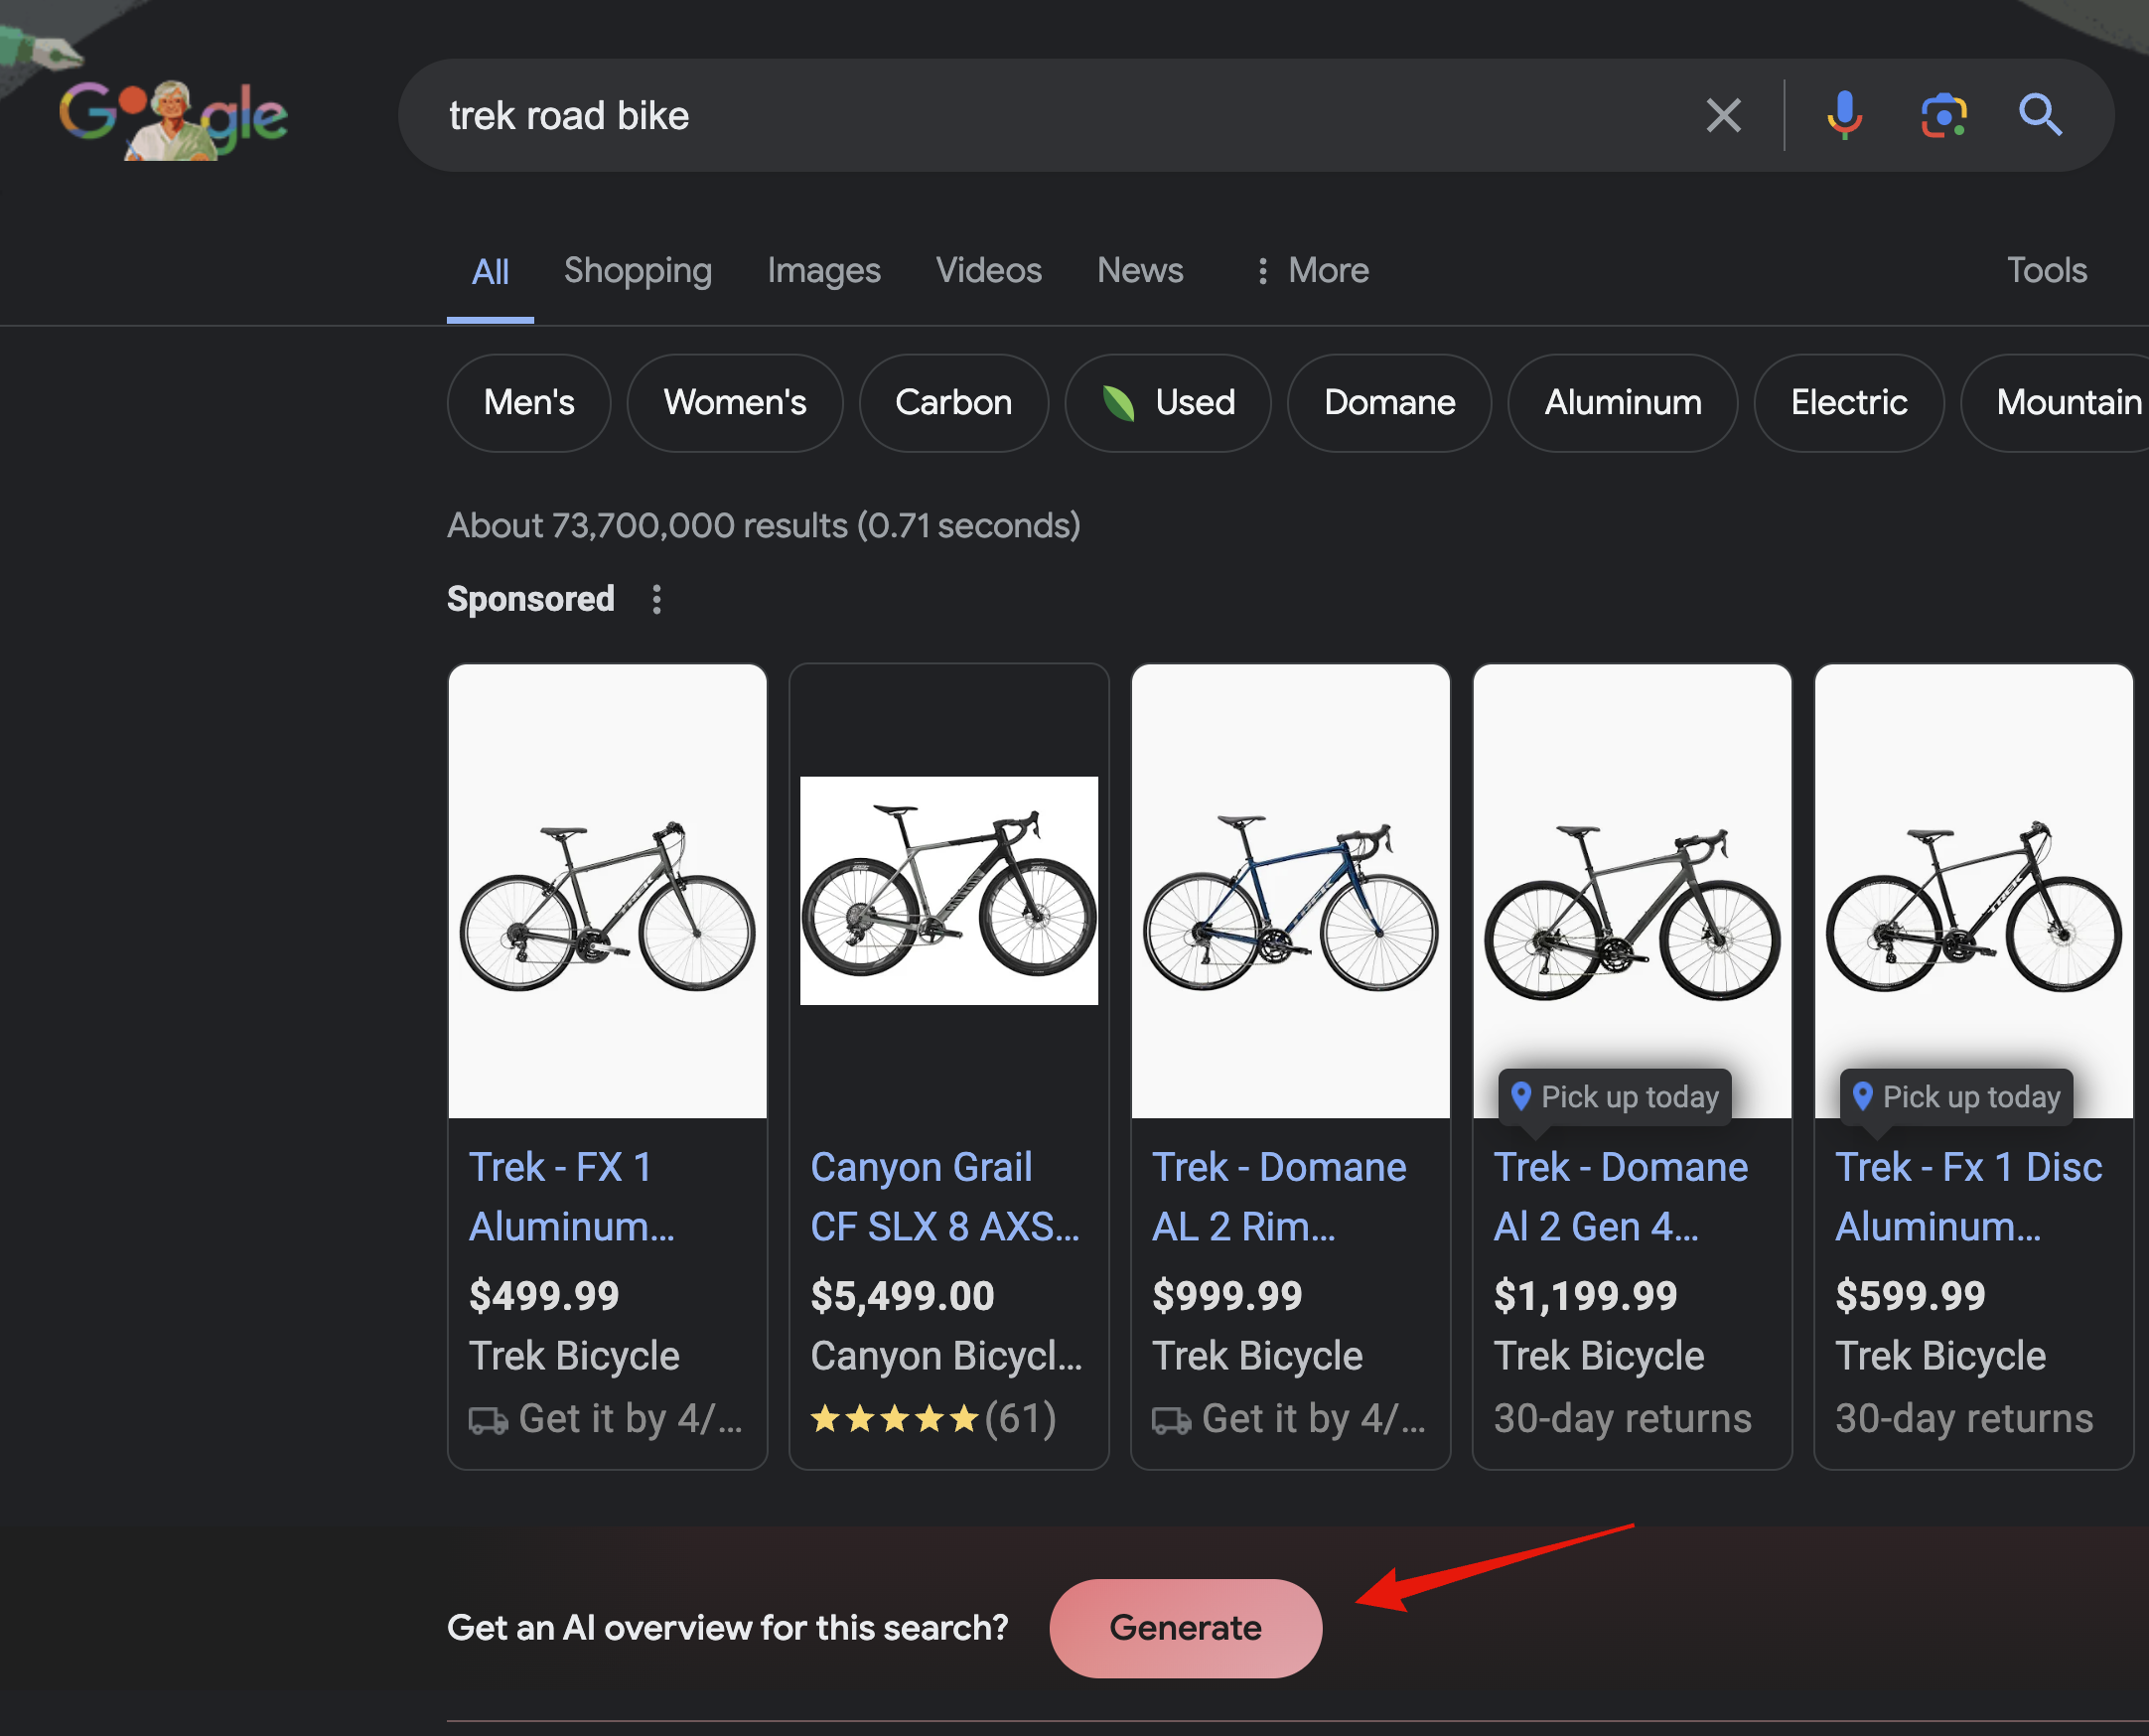 Screenshot by Gyazo.com from search for [trek road bike], Google April 2024
After looking at the ratio of the default Google SGE layouts compared to the ones showing the generate button, we realized that this ratio is different for each of the verticals analyzed.
How Often Does Google SGE Is A Default SERP View?
The ratios of auto-generated Google SGE compared to the ones with the generate button depend on the vertical you are in. The graph below will show you the ratio for your set of queries.
Why is this important? Auto-generated Google SGE results don’t require any action on the user’s end to cover the whole viewport on both mobile & desktop. Based on this SGE behavior, I expect auto-generated SGE views to disrupt the search experience, effectively pushing the “traditional” Google SERPs down. To be exact 905 px down (average height of Google SGE response in our research).
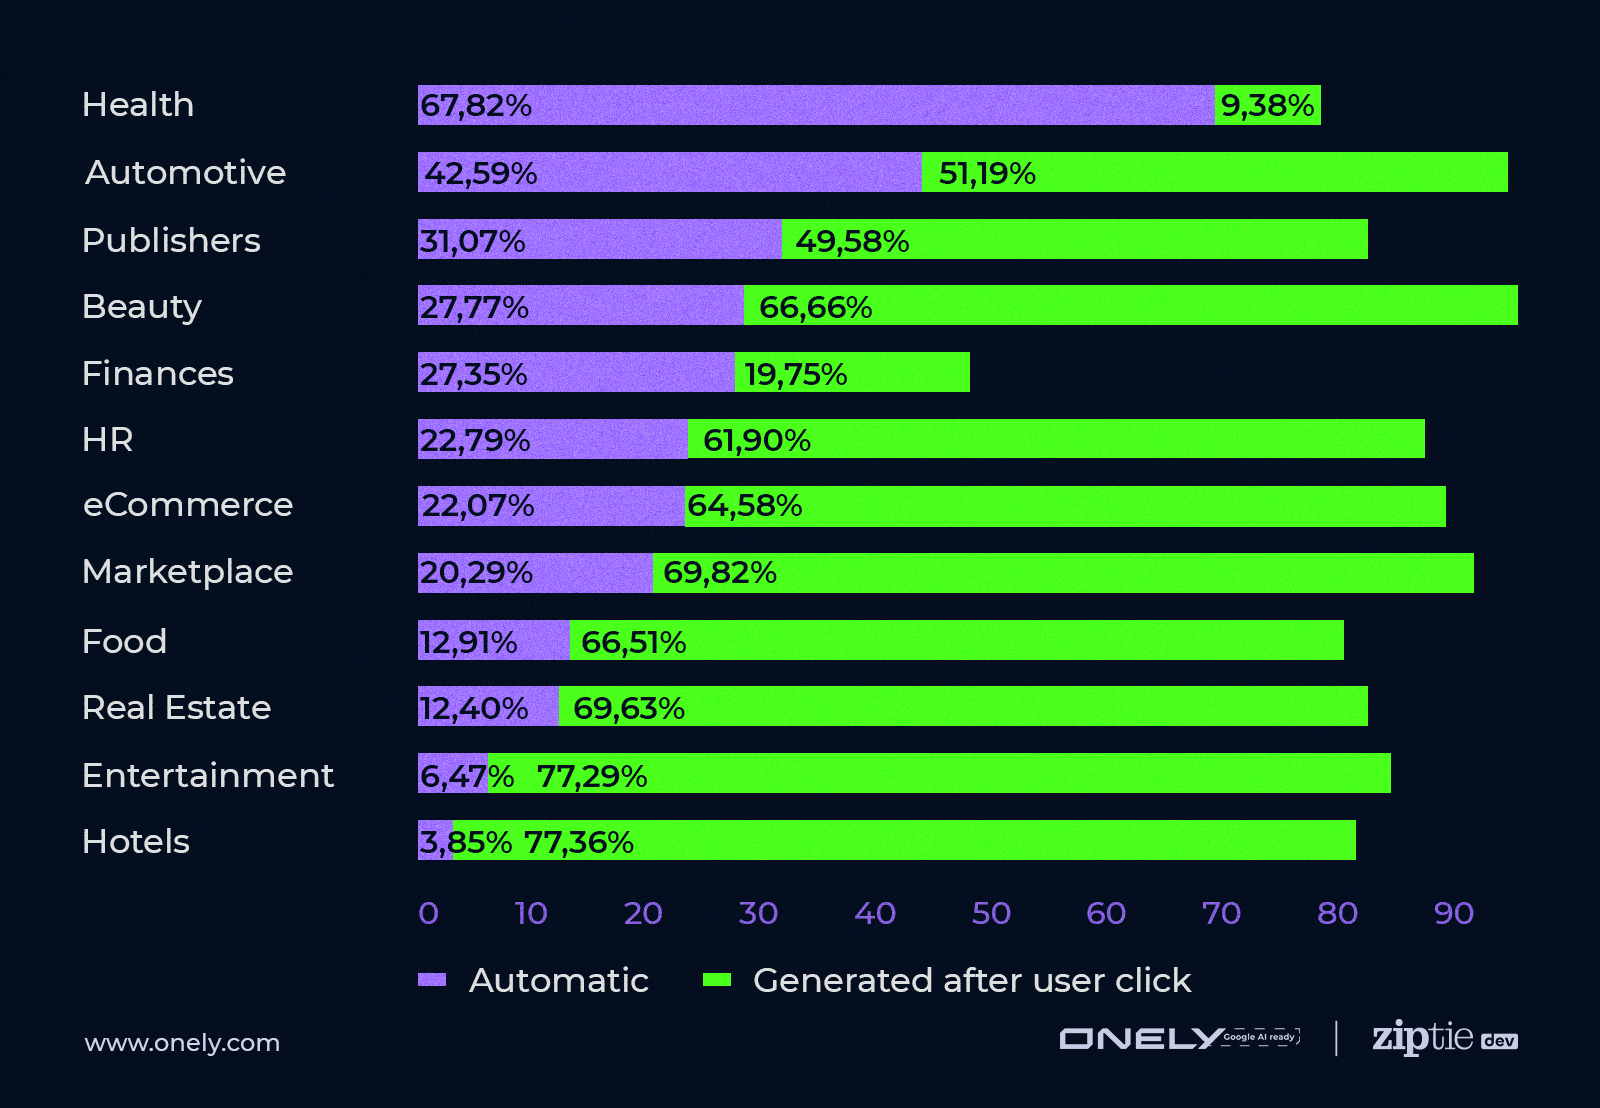 Image from author, April 2024
The health vertical is shockingly an outlier, with 68% of queries returning Google SGE automatically and only 9% showing the generate button.
On the other side of the spectrum, hotels, and entertainment have only 4% to 6% auto-generated Google SGE pages, with 77% of Google SGE queries showing the generate button for each of these verticals.
The impact of Google SGE will depend on multiple metrics, with SGE coverage being one of them.
However, we can assume that the queries with auto-generated AI responses will be affected sooner than the ones returning the generate button.
Let’s see how you can use this data to prepare your business for this shift.
Data Over Time
We’ve tracked the manually and auto-generated rations for a diverse set of queries since June last year, and the rations changed in the following way:
- June 2023: 58% (auto) – 13% (manually).
- November 2023: 48% – 31%.
- March 2024: 46% – 27%.
How To Use This Data?
Estimating Google SGE’s Impact On Your Brand
Prioritization is key to estimating Google SGE’s impact on your brand.
Looking at the data above, the health industry will be impacted quicker than any other in the list as users will be automatically presented with Google SGE response.
Hotels, entertainment, real estate, and food verticals will have more time to prepare, with 4-12% of queries returning Google SGE automatically.
Action Point #1
- Gather Google SGE data for queries that cover 80-90% of your search volume (you can use a free demo of ZipTie.dev to run mass checks of Google SGE coverage).
- What percentage of your traffic and queries comes from queries returning auto-generated Google SGE vs. manually generated SGE?
- Is there a pattern between these two groups?
Query-Based Google SGE Impact And Prioritization
SEO teams all around the world are shifting their efforts to encompass Google SGE optimization.
Dividing your queries into auto-generated and generated after the click allows you to focus on auto-generated Google SGE queries first and tracking this ratio, as our research shows that Google SGE is covering more queries automatically.
Action Point #2
- After dividing your queries into two buckets – auto-generated and manually generated SGE – focus on optimizing the queries in the auto-generated bucket.
- Track Google SGE’s coverage in the manually generated bucket (over time, Google will show more auto-generated SGE SERPs).
Once you have a clear set of optics for your queries and know SGE’s impact on your brand, it’s time to look into the sources.
Spoiler alert: The number of Google SGE sources also depends on the vertical.
SGE Sources And Why Hotels May Get Up To 40% Fewer SGE Clicks Compared To Other Verticals
You can only get organic traffic from Google SGE when users click on the source of the AI-generated content. This is where it gets interesting. Depending on the vertical you are in, the number of sources varies from three to five.
This 40% to 50% difference will make Google SGE optimization more difficult, especially in the finance or hotel vertical, where Google SGE shows an average of around three sources per query.
The data below shows an average number of Google SGE sources quoted on the search engine result page.
Interestingly, some of the queries do not return any sources (Google is generating the answer based on its internal database).
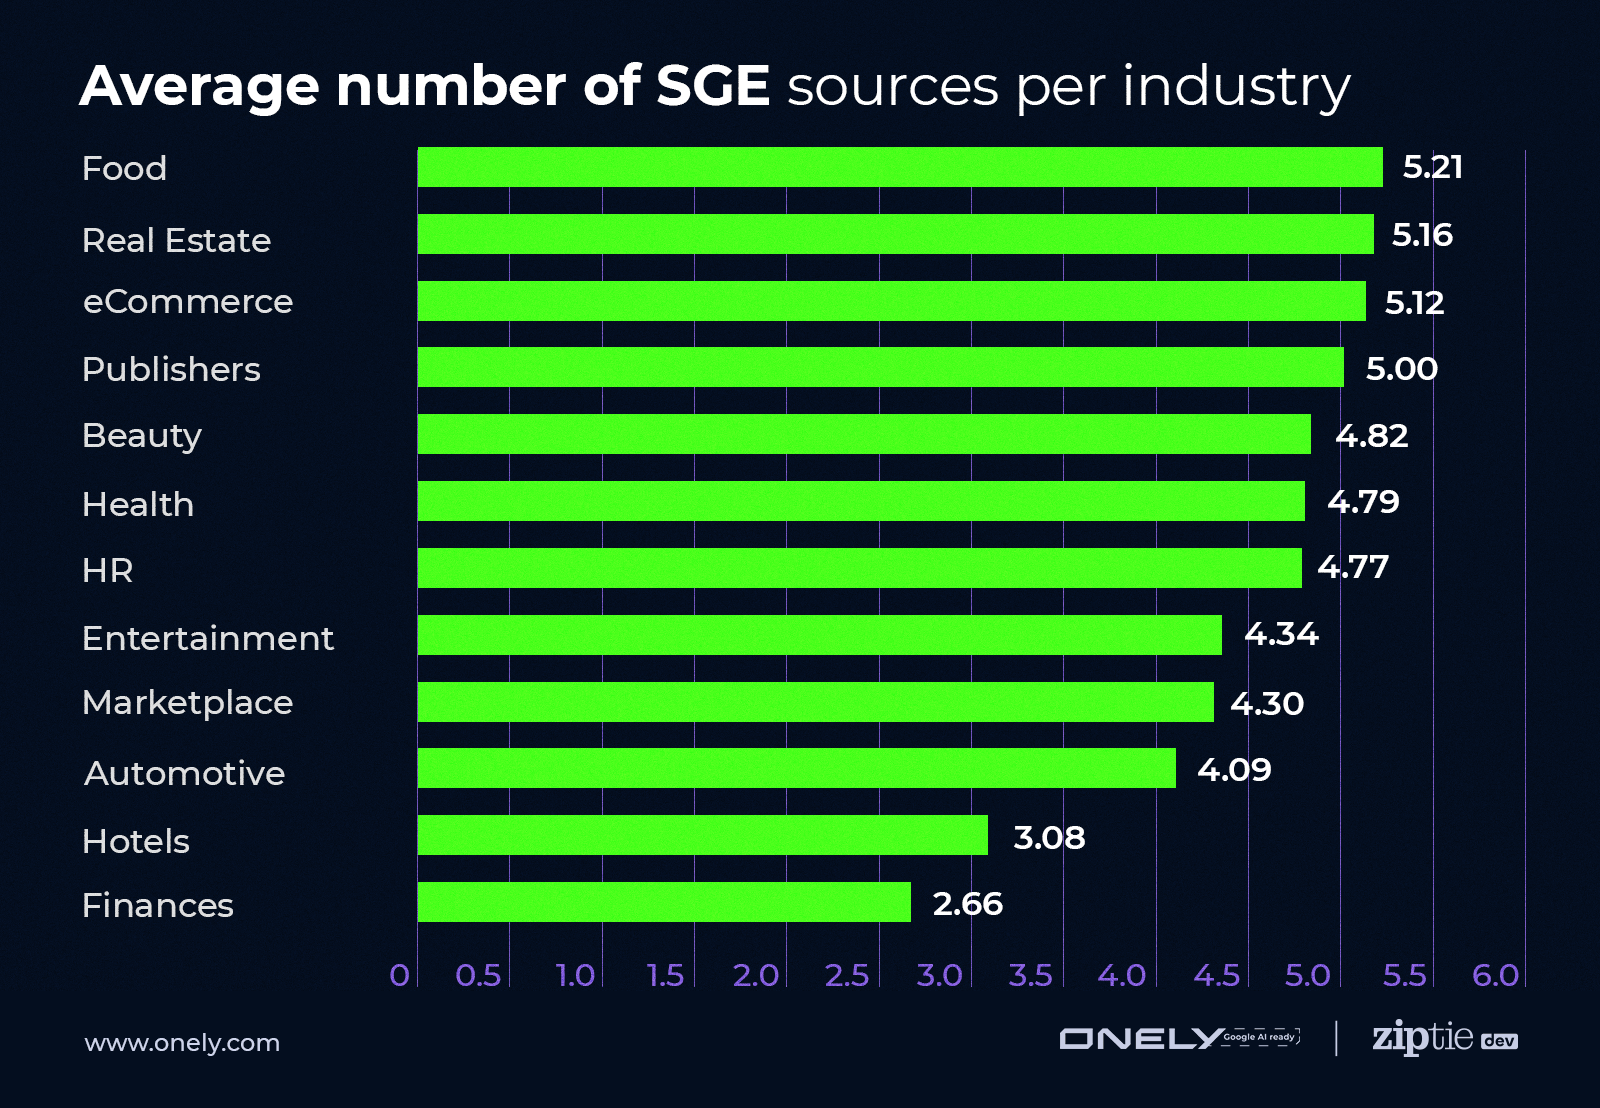 Image from author, April 2024
SGE results that mention fewer content sources have a higher chance of generating traffic due to higher average CTR (click-through rate). At the same time, these queries will be more difficult to optimize for due to limited real estate.
This makes queries with a limited number of sources a bit more complex to track and strategize.
Google SGE Will Not Show Any Sources For 5% of The Queries
Our research shows that 5% of the queries will return Google SGE results with no external sources quoted. This topic is one of the most interesting and also quite complex in our research due to the risk of Google taking over a ton of traffic, but also because Google seems to be using different logic for zero-sources SGE for different verticals and types of queries. We are still running checks & experiments; however, to understand this feature, we need to track it over time and spot more queries that went to the zero-sources bucket. I’ll keep you posted.
Carousel Rankings – To The Top Left
We are all used to aiming for the top of SERPs. Google SGE results with more than three sources will come with a challenge that’s new to us SEO professionals: horizontal scrolling.
Being included within the first three sources (counting from the left to the right side) will mean that your URL is visible without scrolling horizontally, leading to higher CTRs and more impressions.
Action Points
- Track the number of SGE sources for all of your queries.
- Prioritize your SGE optimization efforts for queries with the least amount of sources (higher returns from higher CTRs).
- For queries with more than four or more sources, track carousel positions and aim to be included in the top 3 sources to gain better visibility and boost CTRs.
Google SGE Sources Vs. Traditional Rankings
Google SGE operates on a brand-new algorithm, and your current rankings will not translate to Google SGE one-to-one.
Shockingly, these data points are also completely different when analyzed per vertical.
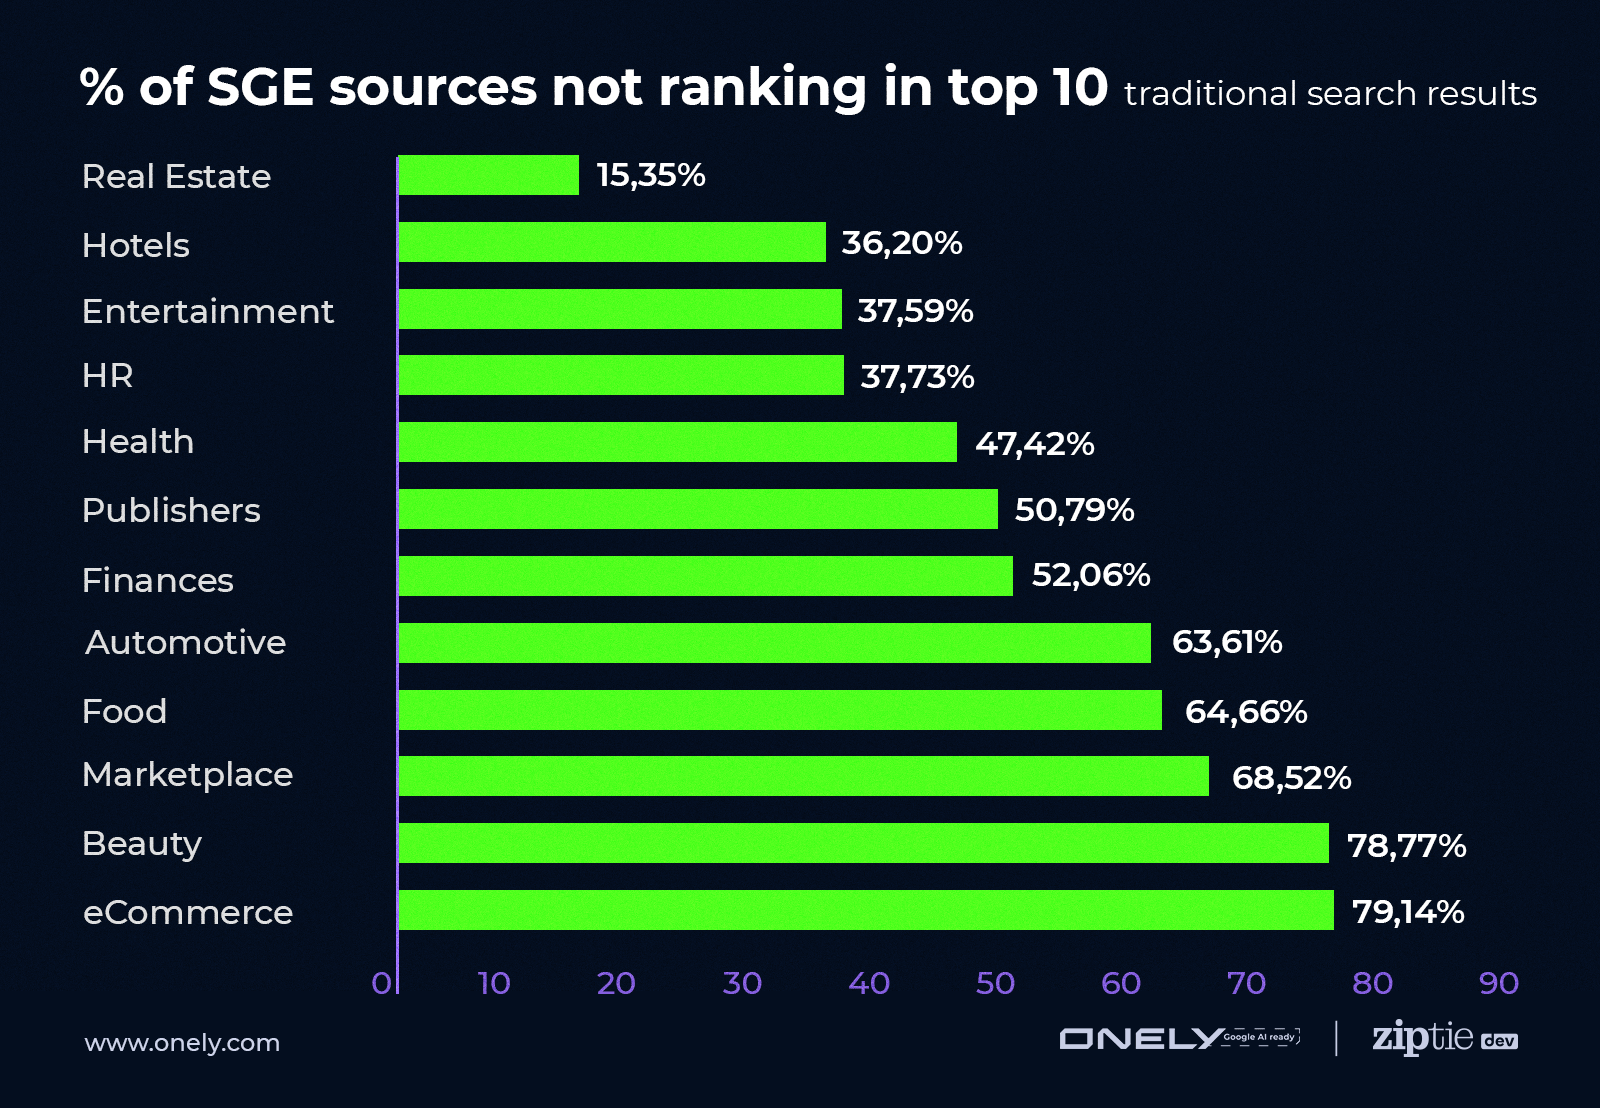 Image from author, April 2024
Industry winners
While analyzing our study, we found that Google SGE seems to favor a few specific domains per vertical. In many cases, the key factors driving these outliers were lean technology combined with content structure focused on answering the query in a concise and clear manner.
Final Thoughts
With Bing rapidly becoming a co-pilot rather than a search engine and Jeff Bezos threatening Google’s Perplexity, the SEO industry needs to adjust to this never-before-seen pace.
I believe that navigating this change without overwhelm and chaos is only possible with a proper set of optics and wisely chosen battles.
I hope the data I shared in this article can help you prioritize and make better strategic decisions. We are going to share more insights into each vertical over the next few months here on SEJ.
If there’s anything else you’d like to know or understand about how Google SGE is reshaping organic search, reach out to me, and I’ll do my best to get the data needed to help our industry during this time of transition and change.
Happy optimizing!
More resources:
Featured Image: BestForBest/Shutterstock
Source link : Searchenginejournal.com
