Posted by
Rank Ranger
Going on the theory that more is better, we added a barrage of new metrics to help bolster your Yext integration data reporting. In fact. we’ve added more than a dozen new metrics covering data from Facebook to Instagram to Yelp to Yext. Of course, and in typical Rank Ranger fashion, we’ve integrated these new metrics into our custom, and may we say beautiful, graphs and widgets!

New Yext Metrics Added to Rank Ranger
Thirteen new metrics have been added to the Yext integration for display in Insight Graphs and Single Metric Widgets. The new options include data from Facebook, Instagram, Yelp, and Yext, giving you the ability to create impressive marketing performance dashboards. In total, integrating your Yext account with Rank Ranger places these 27 metrics in your reporting toolkit:
- Facebook Check-ins
- Facebook CTA Clicks
- Facebook: Likes (lifetime)
- Featured Message Clicks
- Facebook Page Impressions
- Facebook Page Post Impressions
- Facebook Page Views
- Facebook Talking About This
- Facebook
Were Here - Foursquare Daily
Checkins - Google My Business Customer Actions
- Google My Business Map Views
- Google My Business Search Views
- Google My Business Search Queries
- Instagram Posts
- Yelp Customer Actions
- Yelp Page Views
- Yext Average Rating
- Yext Featured Message Clicks
- Yext New Listings Live
- Yext New Reviews
- Yext PowerListings Live (lifetime)
- Yext Profile Updates
- Yext Profile Views
- Yext Publisher Suggestions
- Yext Searches
- Yext Social Posts
Custom Design Your Yext Data
As mentioned earlier, you can show the above-listed metrics within our custom graphs and widgets, offering you a flexible and visually striking way to showcase your data.
As such, Single Metric Widgets provide the design malleability needed to build a comprehensive dashboard of data from Yext (and a wide variety of additional integrations). Use the widgets to simply display performance metrics, include colorful trend graphs, or present a comparison of current performance to previous periods.
An example of a few of the many options for displaying marketing performance with Single Metric Widgets
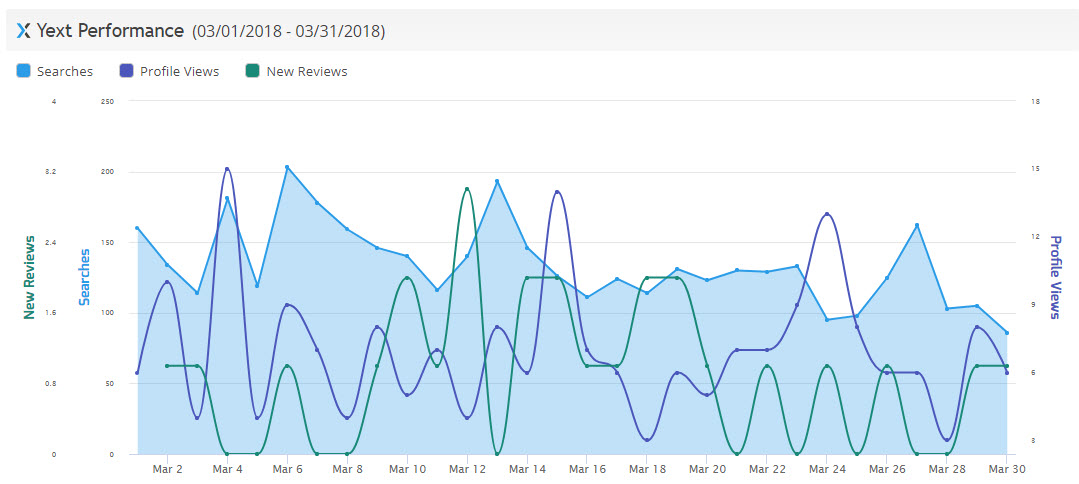
In addition to Single Metric Widgets, and when you wish to highlight data trends, the Insight Graph enables you to artistically plot metrics in your choice of colors and formats by day, week, month, quarter, or year over year. You can additionally create unique comparisons by plotting information from other data sources.

An Insight Graph trending Yext searches, profile views, and new reviews
Unique Yext Data Filters
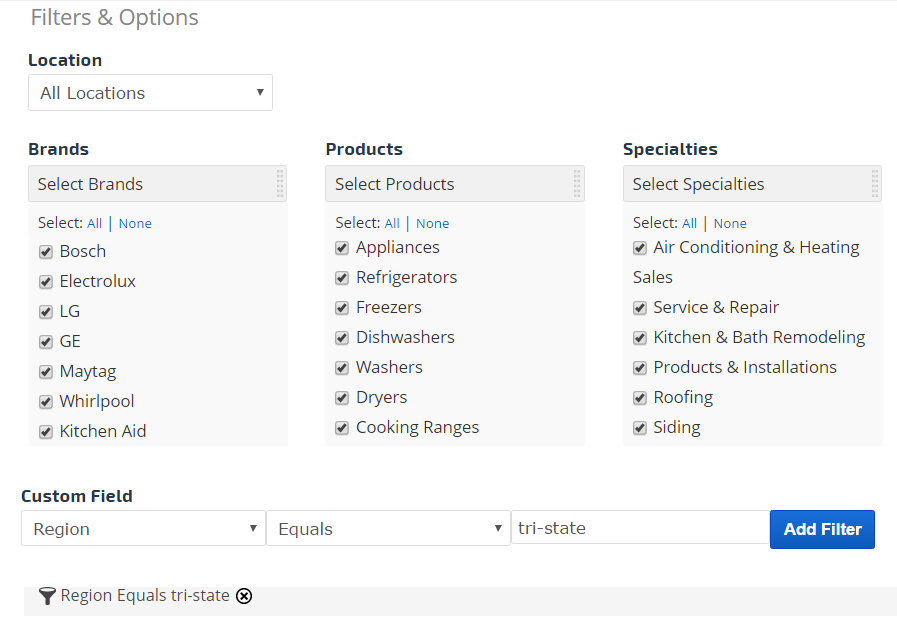
Beyond giving you multiple ways to display your Yext data, our reporting options give you easy access to extensive data filtering. When choosing the All Locations option, you can filter the selected Yext data by Brand, Product, and/or Specialty. You can even create your own custom filters. The result is the ability to highly target the specific information you wish to access for pinpoint data analysis.

An Extensive set of Yext Insight Graph filters
Make Yext Data Reporting Fun
Who says creating extensively filtered, spot-on Yext data reporting can’t be fun? Unlock your inner artist. Plot Yext, Yelp, Facebook, and Instagram metrics on one of our custom graphs and widgets and give your data a striking look according to your tastes and preferences. Creating graphs and widgets with the variety of data available from Yext can be a fun and creative adventure, learn more – and, as always, contact our support team for assistance or to proudly share your creations.
Get started now!

