Posted by
Shay Harel
The green eyed monster of PPC makes its global appearance while the mobile SERP gets a taste of summer’s scorching heat. With a SERP significant introduction and heat generating shifts, last week’s SERP has an interesting story to tell. Lift the curtains, activate your SERP Features Tool, and let the music start to play as we venture off into the drama that was last week’s SERP.
Green PPC Labels Go Global
This past week Google got its green thumb as it confirmed that PPC labels around the world will now be going green.
Green Ad Labels: Norway
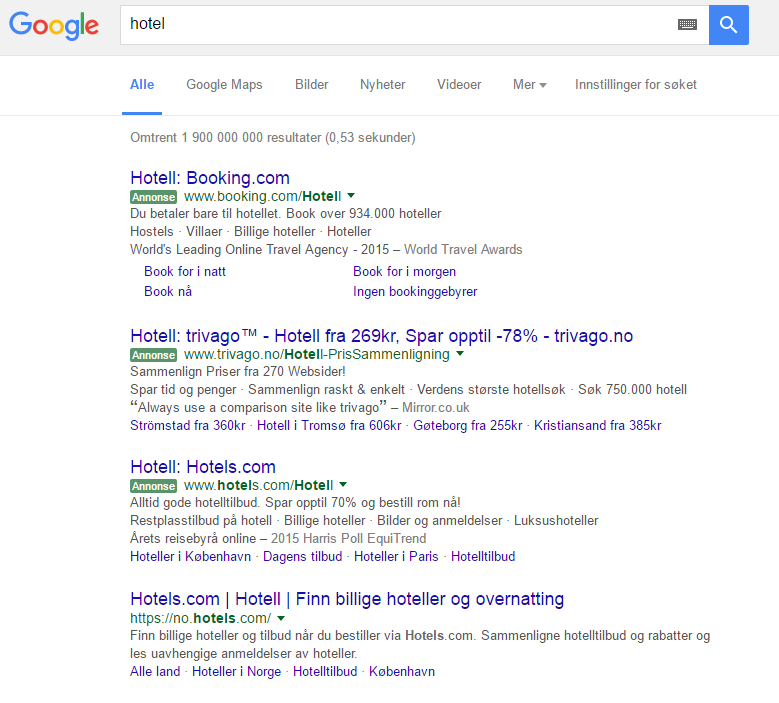
Fig 1. A search for “hotel” on Google Norway produces ads with green labels
Ditching its long standing and never mellow yellow, Google has gone organic with its new label for ads throughout the world. With this green roll-out Google has brought its test to ad labels that began around mid-April full circle.
Green Ad Labels: Spain
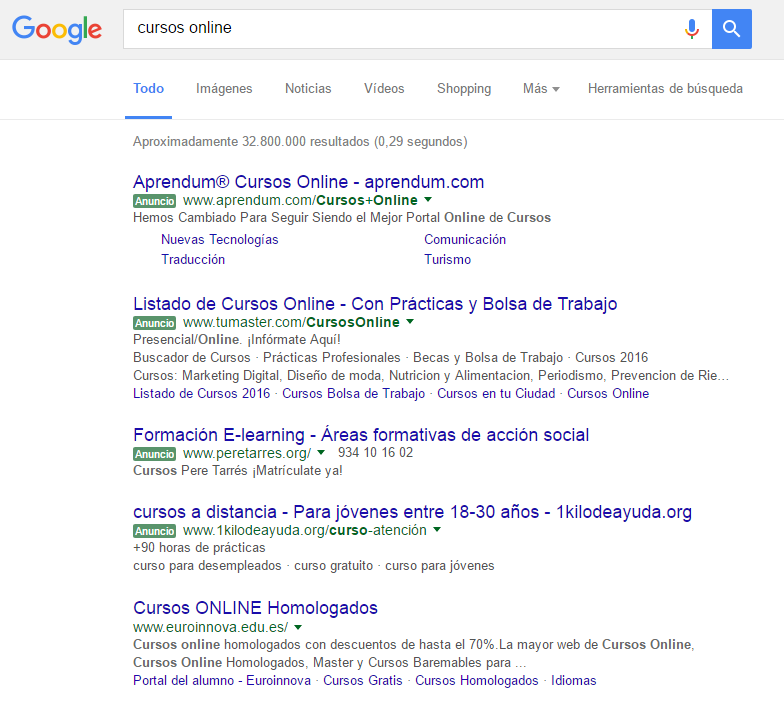
Fig 2. A search for “cursos online” (online courses) in Spain brings up ads with green labels
I for one can’t say that I’m surprised that Google decided to go green with its PPC labels. Google of course has said that the new color choice found favor in the eyes of both advertisers and users alike. In truth, I don’t doubt this, I’m confident that Google would not roll with a new color for its ad labels if it did not have evidence that users would go for it. However, the cynic in me has to wonder if the real upshot to the new organic look of PPC labels is just that, its “organic-ness.” I think it’s safe to say that the choice of green does make the average ad look a bit more like an organic result. Personally, if I were an advertiser, I would most definitely be happy with the more subtlely organic color choice.
HTTPS Climbs to New Heights
When I think of HTTPS I think of the tortoise (from the Tortoise and the Hare), slow and steady wins the race. HTTPS is just one of those good ‘ol reliable SERP features. You can always count on it to rise steadily and gradually (at least in countries like the US)…. which is why I was surprised at its recent behavior.
I noticed last week that the percentage of Page One results showing HTTPS in the US was increasing at a slightly more rapid rate than it usually does. Delving into the data I found that between June 9 – 18 HTTPS showed a 3.63% increase.
HTTPS Increase: June 9 – 18, 2016
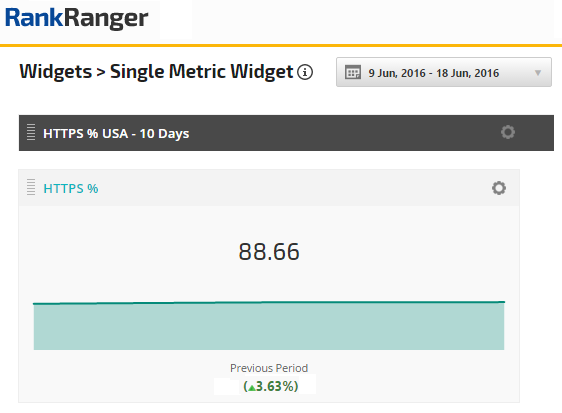
Fig 3. Between June 9 – 18 HTTPS in the USA increased 3.63%
While the increase to HTTPS was not some sort of Herculean climb up the data mountain, it is quite the interesting tidbit of information. Let’s give this some context. Over the course of the entire month of May, HTTPS showed an increase of 1.81%. What we saw last week was essentially a 10 day period showing double the change than that of the entire month of May.
HTTPS Increase: May 2016
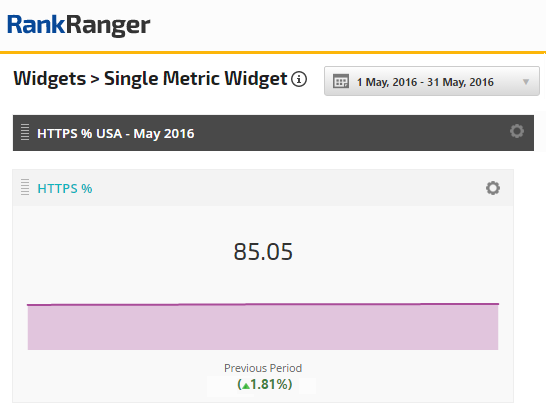
Fig 4. HTTPS between May 1 – 31 shows a 1.81% increase
Keep in mind that HTTPS in the US is notorious for its rock-like performance. Being that the feature gradually increases at a slow pace, day after day, month after month, seeing it fly up the data poll with a 3% increase within a 10 day period is unusual. Simply, when it comes HTTPS one would expect the amount of climb to be in proportion to the amount of time!
Title and Description Length Trends Comparison
With last week’s announcement about the new data being tracked on the SERP Features Tool I would be remiss if I didn’t put some of the new data to good use. While the world of tracking international title and description lengths may lack theatrical flair, it does sport some nifty global patterns.
Average Title Length in the USA
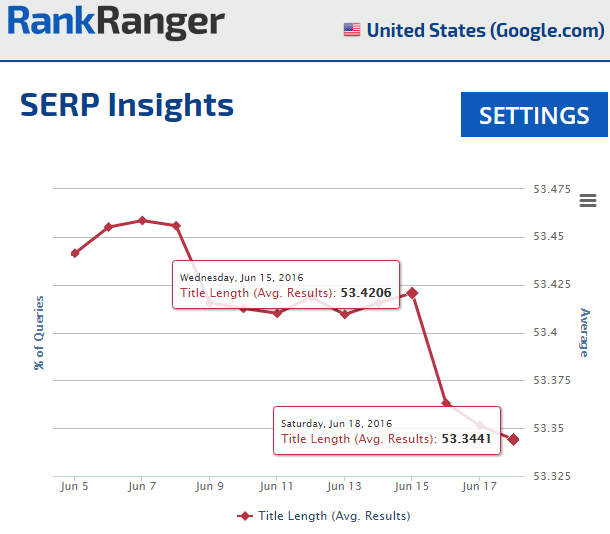
Fig 5. The average length of titles on the American SERP drops slightly between June 15 – 18
Everthing is relative (well most everything), and this relatively small decrease in average title length in the US is actually peculiar relative to how this data performs globally. After exhaustively looking at title length trends from around the globe, I found the US unique in that it does shift, if ever so slightly.
Average Title Length in the UK
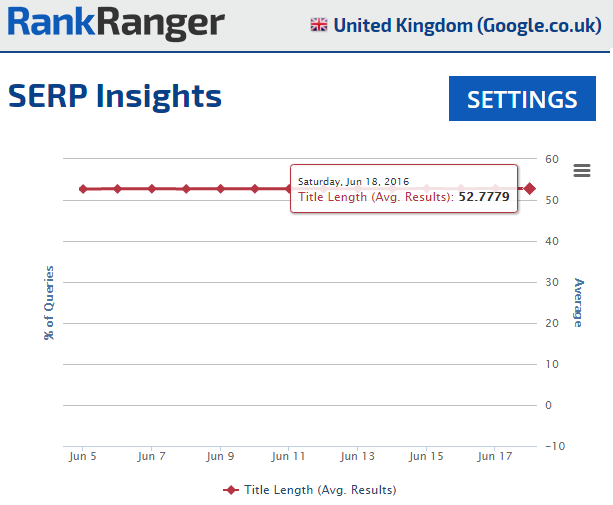
Fig 6. The average length of titles on the UK SERP remain consistent
The data indicated in Figure 6 is pretty much par for course. Like the UK, countries such as Australia, Canada, Japan, Russia, etc. show nominal fluctuations vis a vis the length of titles within results.
In fact, the same pattern holds true regarding the length of descriptions within search results. Again, the US shows some degree of fluctuation, nothing wild, but fluctuation nonetheless.
Description Length in the USA
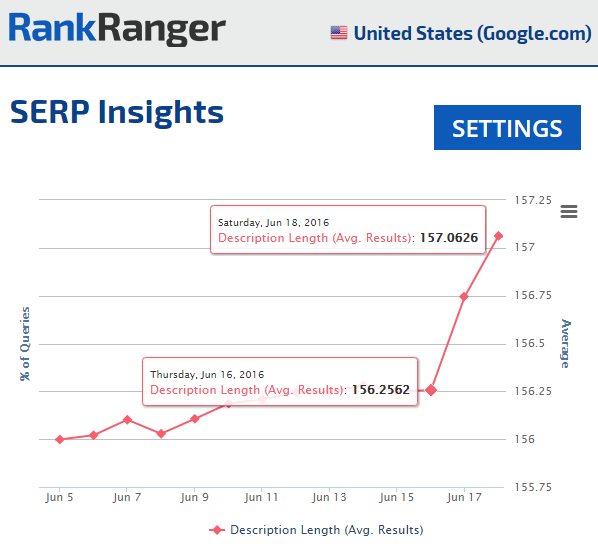
Fig 7. The length of descriptions in the US slightly increases between June 16 – 17
Again, nothing crazy, just a very slight increase in the length of descriptions within results in the US. Though, it is interesting to note that as the length of titles in the US went down, description length went up.
Like average title length, countries outside of the US displayed a different trend as highlighted by the SERP Features Tool.
Description Length in Canada
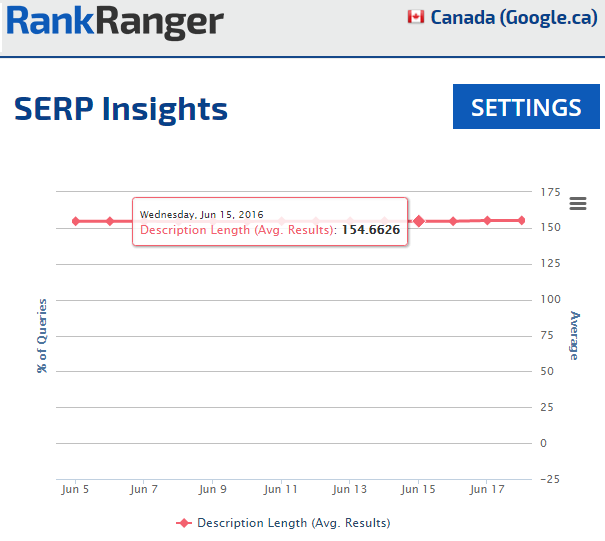
Fig 8. The average description length on the Canadian SERP shows only the slightest fluctuation
True to to its title counterpart, the length of descriptions within results in the UK, Australia, Japan, and Russia remained at highly consistent levels with what is tantamount to no volatility. The question of course if for how long? Will SERPs around the world start to give and take like the US or will their trajectories take on a stoic tradition when it comes to title and description length?
Feeling the Mobile SERP Heat
You didn’t really think I was going to tell you about the soon to be released Mobile SERP Features Tracker (see last week’s SERP Snapshot), give you a small taste, and then throw the tool back into the storage shed did you? I would never do that you! In fact, I can barely contain myself with the mobile SERP as wild as it was last week! While not on fire, the mobile SERP was inching towards singe worthy temperatures on the Rank Risk Index.
Mobile SERP Fluctuations on the Rank Risk Index
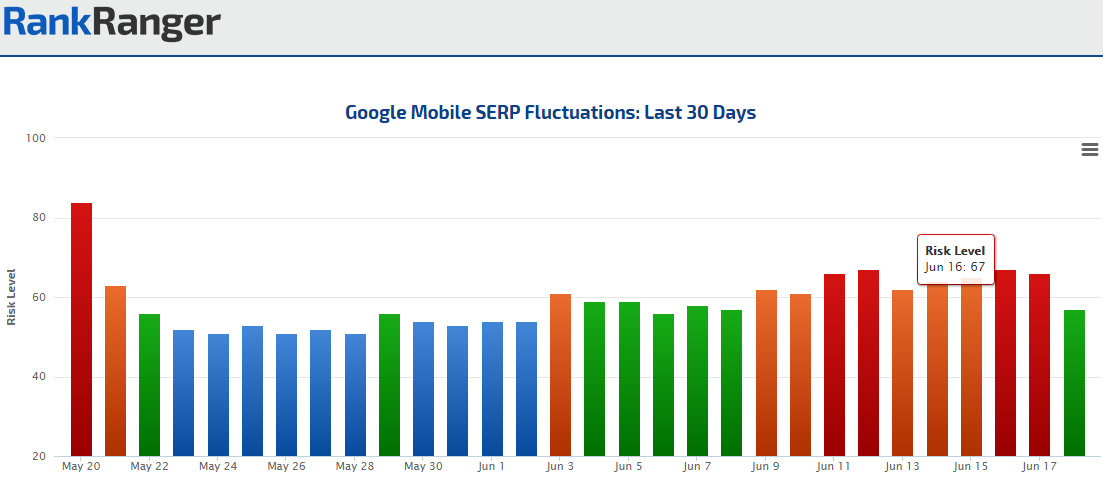
Fig 9. The Rank Risk Index shows elevated risk levels on the mobile SERP for nine straight days peaking on June 16 at risk level of 67
Exclude the 18th, and the Rank Risk Index presents a mobile SERP fever. Going all the way back to June 9, the risk levels on the index have shown that the mobile SERP was at an elevated risk.
After ransacking the yet to be released Mobile SERP Features Tracker for some telling data let’s take a look at two intriguing mobile SERP elements:
- The Mobile Friendly feature
- Organic Results
Mobile Friendly SERP Slip
Like the aforementioned HTTPS, Mobile Friendly in the US performs like a tank, consistent and onwards. In the relative sense, we have not seen the feature take a significant downturn, again in the relative sense. However, last week showed the first significant and multiple day slip of the feature’s average per page data in the US.
Mobile Friendly Average per Page Appearance
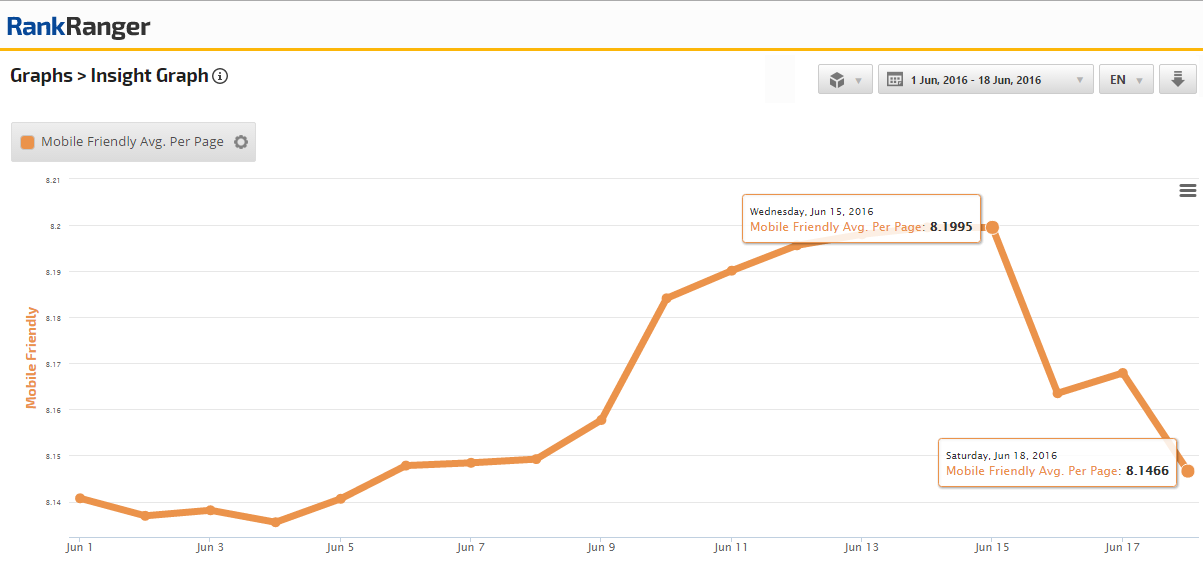
Fig 10. The average number of Mobile Friendly sites listed on Page One of the mobile SERP in the US shows a decrease between June 15 – 18
While not monumental, the slight decrease in the average number of Mobile Friendly sites on Page One of the mobile SERP in the US takes on symbolic significance. This is the first time we’ve seen this data take such a sharp and prolonged decrease. It begs the question, is Google getting tougher on doling out their Mobile Friendly attribution?
I’ll put it like this, and to me this is the real question, how can we have an average of over eight sites on a results page being Mobile Friendly all while Google aggressively pushes the notion that the mobile web is in need of overhaul via AMP? In other words, if every 8.15 out of roughly 10 sites on Page One are considered Mobile Friendly, do we really need AMP in the way Google supposes we do? How can the need for AMP be so pressing when so many sites are mobile adequate?
If I had to put my money on which side of the question was weaker, AMP or Mobile Friendly, I would go with the latter. Other than the fact that many of us most likely encounter a plethora of websites that are just not at all geared towards the mobile web, Google has yet to really separate desktop and mobile. There is still no separate index for mobile sites and Google at the moment still faces a few challenges in doing so. This influences me to lean more towards the notion that the sites we see being labeled as “Mobile Friendly” may not be as friendly as Google really wants them to be ultimately.
All of this makes me wonder, is the downshift presented in Figure 10 the beginning of a tougher stance on Mobile Friendly attribution? The timing is perfect in a way, Google just rolled out its mobile algorithm update in May, perhaps we are now seeing some of its effects.
Organic Results Shift on Mobile
The second notable data on mobile last week was the SERP’s preference for 9 organic results in favor of 10. Last week was truly a week for relatives (the Aristotelian logic kind, not the kind that crash your BBQ unannounced). In this case, the relative increase of 9 organic results and the relative decrease of 10 results is something to talk about since we have not yet tracked such an increase/decrease on mobile to ****.
Organic Results Count Shift on Mobile
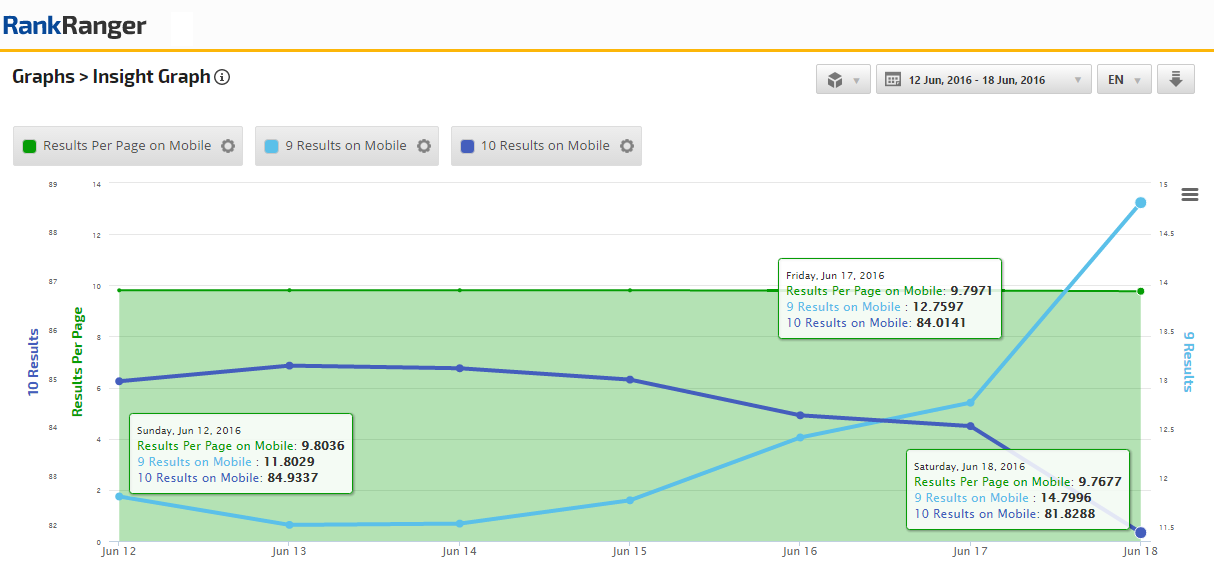
Fig 11. The percentage of Page One results showing 9 results increase roughly 3% between June 12 – 18, while those with 10 results fall approximately 3%
Last week indicated what was a relatively self-evident inverse relationship between 9 and 10 organic results. Between June 12 – 18, the percentage of 9 organic results on Page One of the SERP rose just under 3% while the percentage of pages with 10 organic results on mobile fell just over 3%. The biggest shifts occurred between June 17 – 18. Within that one day period 10 organic results fell just over 2%.
While these numbers may not be staggering, this SERP Snapshot has been brought to you by the word “relative.” For example, between June 12 – 13 the percentage of Page One results showing a count of 9 organic results fell .2898%… these are the kind of numbers we’re used to seeing here and this is precisely why the data in Figure 11 becomes so meaningful.
Take the total Results per Page as another example. Between June 17 – 18, as the percentage of 10 organic results fell, the average results per page dropped to 9.77 from 9.80, a difference of .3. Consider however, that from May 1 – May 31, 2016 the average results per page shifted upwards a whopping .01, making .3 look monumental by comparison.
SERP Relativity Sign Off
How do you feel about ad labels going green? Does their organic look make you feel at one with the SERP?
Will HTTPS in the US slow on down back to more predictably gradual and steady behavior?
When will the Rank Risk Index for mobile cool off? Will nine organic results continue to dominate? Will the average of Mobile Friendly sites on Page One rebound or is this the start of a new data trend?
True to tradition, the invitation for your thoughts and comments is always open.

