SEO is a dynamic set of rules. It is easy to learn but hard to master. To succeed, you need to keep dozens of indicators under control and continuously monitor the current market situation. And that’s not all. For SEO to be highly effective, you need to integrate it into the company’s business model by establishing communication with the sales and marketing departments and project teams. Sometimes, it’s even harder to do this than to catch up with Google.
Fortunately, modern digital has ready-made solutions for everything. Top search engine optimization tool options offer user-friendly dashboards that you can easily adapt to your business needs. Their graphs, tables, and charts help you build perfect presentations for management, partners, customers, and investors. Such services will be indispensable for an SEO agency and a company conducting SEO independently.
The only thing left is to choose the perfect tool to analyze the site for SEO. We’ll examine popular options in terms of functionality, usability, and pricing.
The Value of SEO Dashboards
Instead of thousands of words spoken at meetings, web conferences, and project reviews, you can provide all interested parties in the workflow with access to interactive SEO reporting. It saves you time and effort, which you can use to do important work and solve creative problems. The dashboard will be the link that connects the company’s individual departments, allowing them to exchange information without hindrance and always see the overall business situation at a given moment.
An automated SEO website analysis system also allows you to:
- conduct quick diagnostics of a website;
- promptly discover critical issues that require immediate action;
- always have at hand crucial information necessary for making management decisions;
- provide each specialist and team with the data they need in a few clicks;
- segment SEO reports by keywords, pages, communication channels, competitors, individual elements of the target audience, etc.
Data Sources for Dashboards
First, you should understand that in SEO, Google will be the main information provider in any service. The tech company has resources and databases inaccessible to other market players, so it is essentially a monopolist. It doesn’t matter if you build your own Power BI dashboard or use off-the-shelf solutions from online services; your reports will almost always include data from Google.
Of course, the top players in the field of search engine optimization tool development have their databases. Among them are Serpstat, Similarweb, Moz, DataforSEO, and others. Smaller companies can use their sources under a license, subscription, or paid request.
When analyzing your website using the best performance tools for digital marketing, you can also choose different sources of information. If you use several services that have unique data sets, you can combine their reports in one dashboard using integration software. This flexibility allows each company to develop customized solutions for managing complex business processes. But it also has a downside — the possible complexity of using APIs and additional automation costs.
Top 3 SEO Dashboards
Dozens of services offer extensive website SEO analysis. But if you are looking for a multifunctional set of tools that allows you to build custom reports and offers many integrations with other software, you should pay attention to the following three solutions.
Serpstat
Serpstat is a set of SERP performance-checking tools that increase the efficiency of online business promotion. It has many features that go beyond classic SEO and cover the areas of content marketing, paid promotion, and business intelligence. Its main modules allow you to analyze site SEO according to the following criteria:
- Keywords in organic and paid search results;
- Backlinks;
- Technical condition of a website and individual pages (audit);
- Competitor monitoring;
- SERP ranking;
- SERP features.
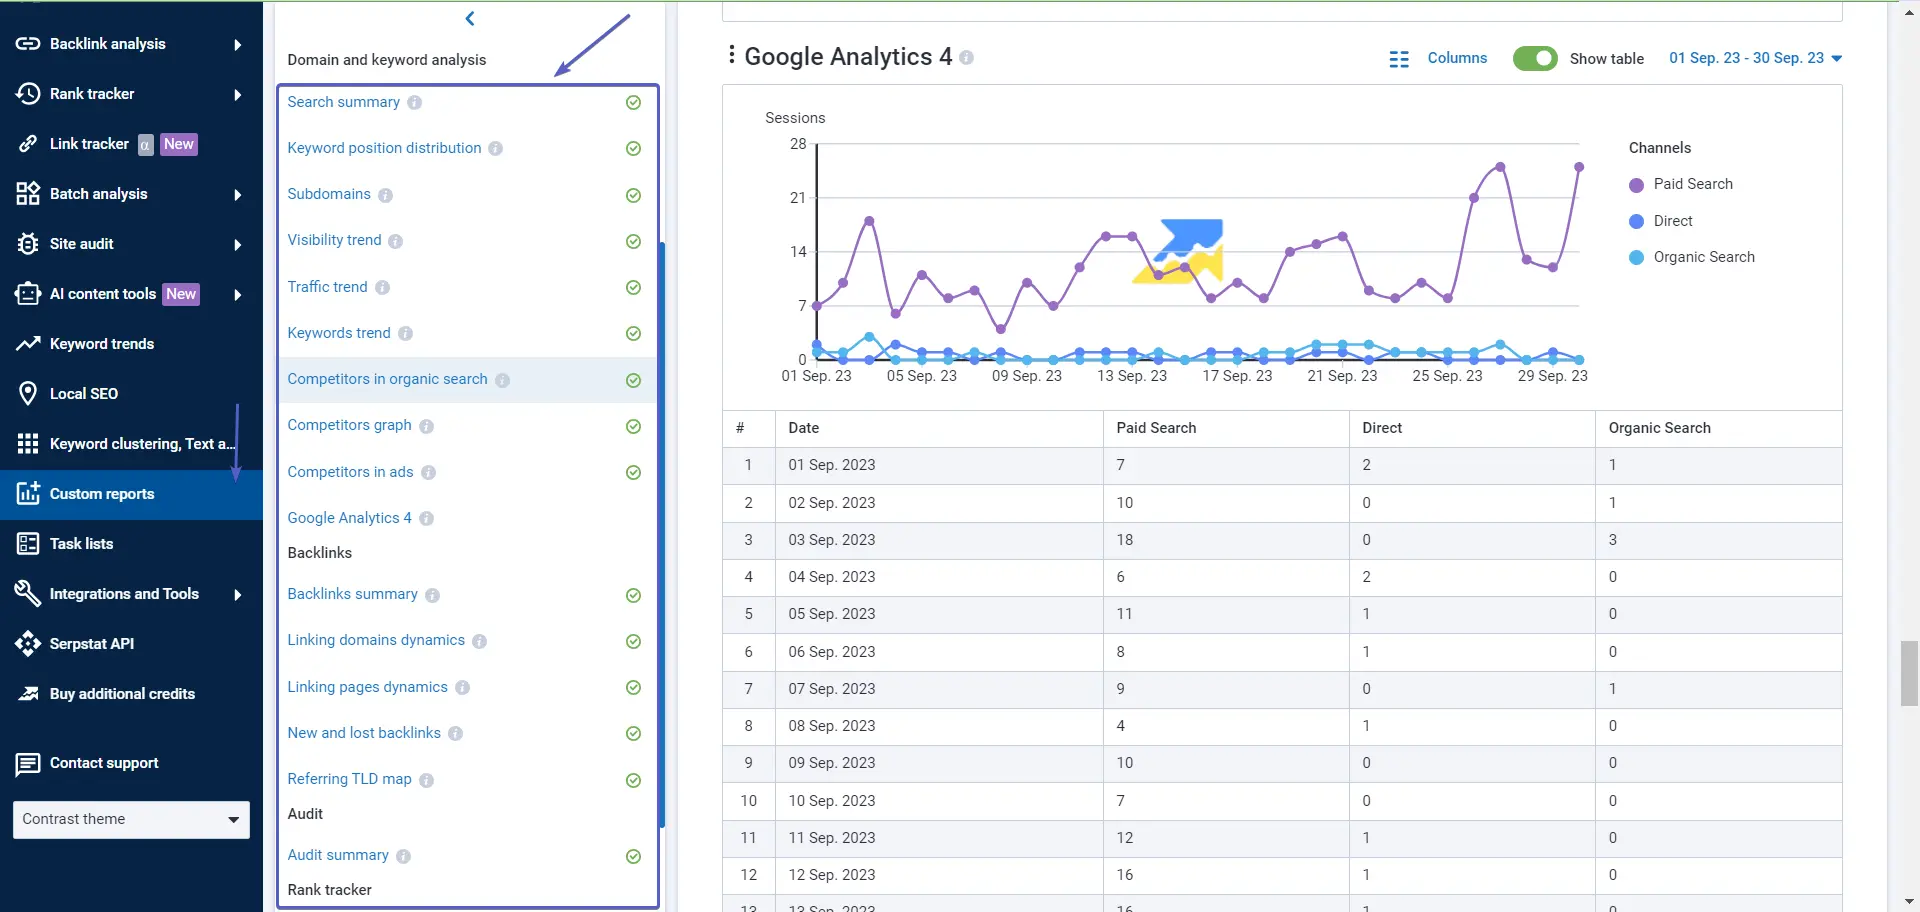
We understand that each company has its own business model, so universal dashboards and examples of dashboards in many SEO toolkits may not be informative and practical enough. Instead, we offer a flexible builder that allows you to create reports independently, adding only the necessary information.

You can select data streams and change the order of visualization tools to create intuitive dashboards. These ensure a quick and convenient start in the SEO. The templates will be especially useful for small businesses that cannot spend too many resources on reporting.
Serpstat has great option for digital agencies: after creating business dashboard, you can turn it into a white-label report. It’s not just about replacing the Serpstat logo with your brand. The service allows you to leave notes on certain data fields, comment on graphs, and highlight the most vital indicators. As a result, untrained users can easily understand your SEO reporting, and you can emphasize the role of your team or agency in achieving success.
Why choose Serpstat?
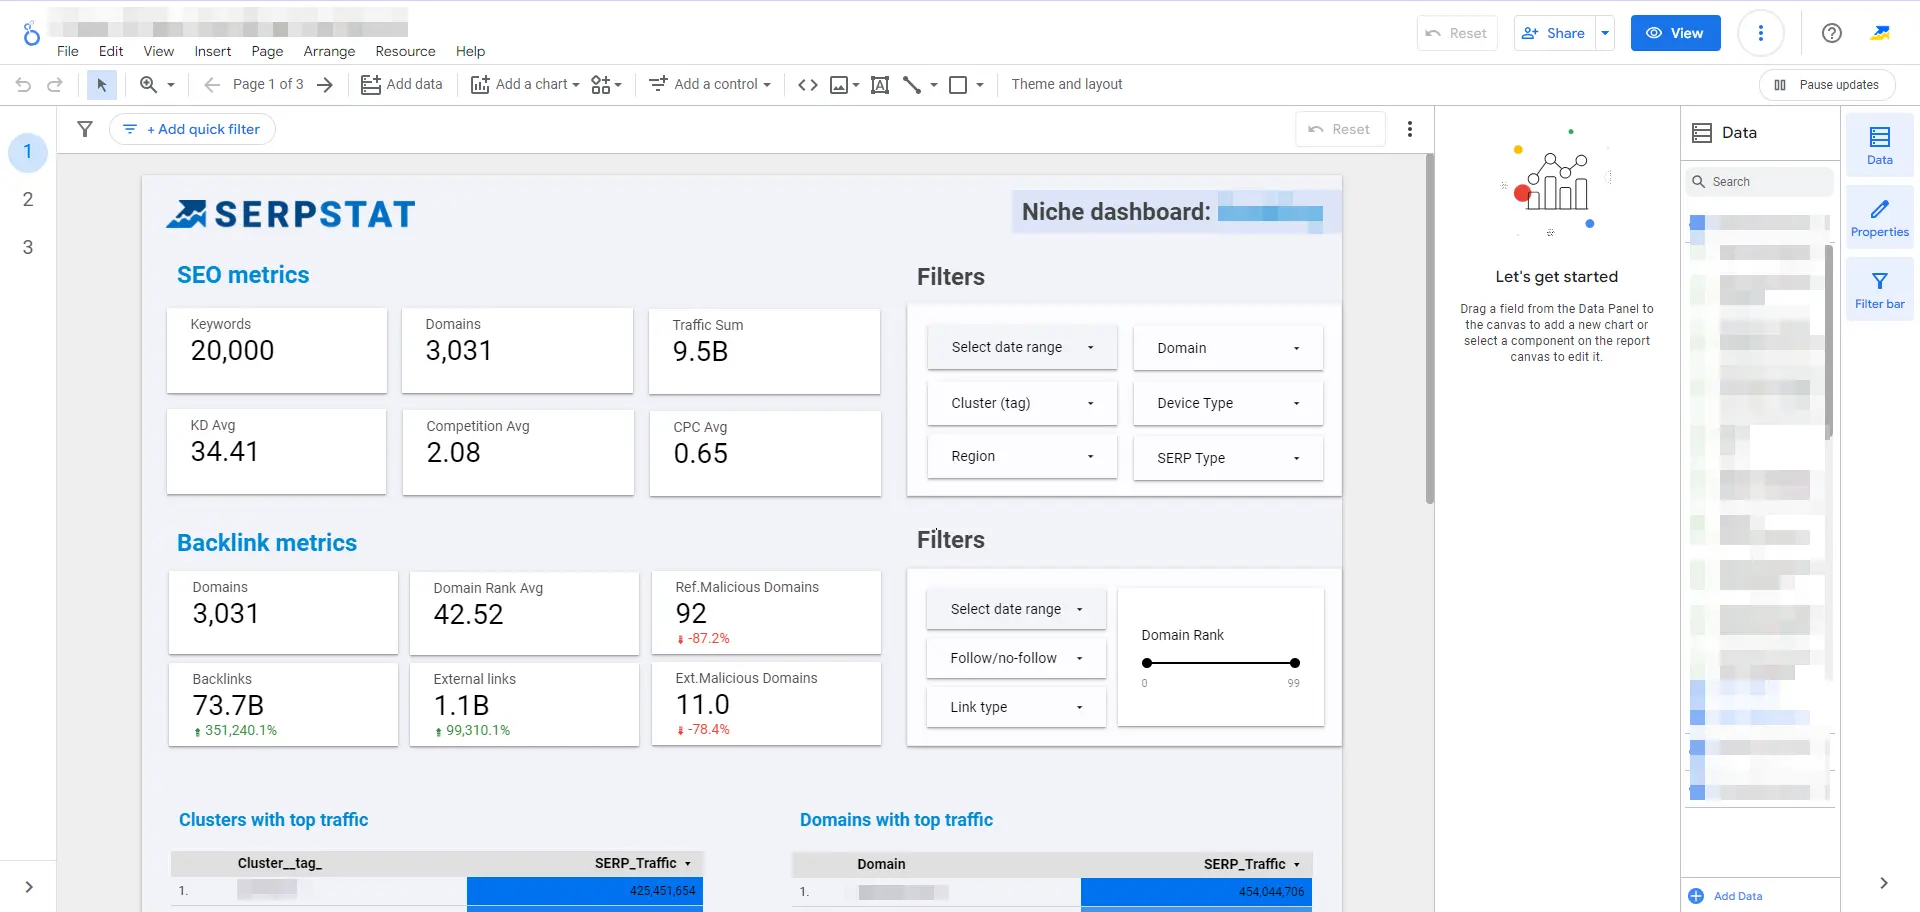
- Access to the API in low-cost subscriptions for small and medium-sized businesses. You can transfer data streams from Serpstat to the Google Looker Studio (former Data Studio) platform to combine information from multiple sources and use it for visualization in custom dashboards. You can read more about how to connect Serpstat with GLS and build reports here.
Additionally, using Serpstat data as service, you can do custom reports in Looker Studio:

- The ability to automate the construction of dashboards and integrate them into your software. The R programming language is ideal for this purpose, as it focuses on data analysis. In this article, you will get detailed instructions on processing key information flows and find a sample code on the Google Colab platform.
- Extensive knowledge base. We publish simple and clear instructions on how to use certain service features. In our blog, you will also find interesting interviews, market reviews, and tips on how to promote your business online. Moreover, the official Serpstat YouTube channel offers guides and webinar recordings. For example, here, you will learn more about building custom reports on SEO:
- In-depth analysis of competitors. With Serpstat, you can analyze website SEO much like you would analyze your own website. Such analysis allows you to get insights into building and improving your digital marketing strategy.
- AI integration. Built-in AI allows you to analyze, improve, and generate text content from scratch. This is a nice bonus that will help you without using additional tools.
Pricing policy
Almost all SEO tools for website analysis, including custom dashboards, are available in the basic Individual plan for $59 per month. APIs, branded reporting, and AI are available in the Team package starting at $119 per month.
GA4 Data Dashboards
Google Analytics 4 is a free platform for comprehensive website performance assessment. If you wonder, “Where can I see the most accurate SEO analysis on my website?” it is exactly the service you need:
- Traffic segmented by communication channels, location, and target audience segments;
- Attracting, retaining and outflow of visitors;
- Session duration, depth of site exploration;
- Conversions for each targeted action;
- Content effectiveness, etc.
SEO analysis of a website with GA4 will be informative, especially since you can integrate the platform with other web services. Integration works in both directions. For example, it allows you to track conversions in popular e-commerce CMSs or transfer the collected data to Big Data analysis software.
This is an example of how the custom GA4 dashboard in Looker Studio might look like:

However, you should understand that free multifunctional solutions cannot be perfect in everything. Despite all its advantages, Google Analytics 4 has a very steep learning curve. Most examples of dashboards require careful study before practical integration into workflows. A person without any knowledge of SEO will face difficulties in understanding GA4. Sometimes, this creates significant problems for small businesses.
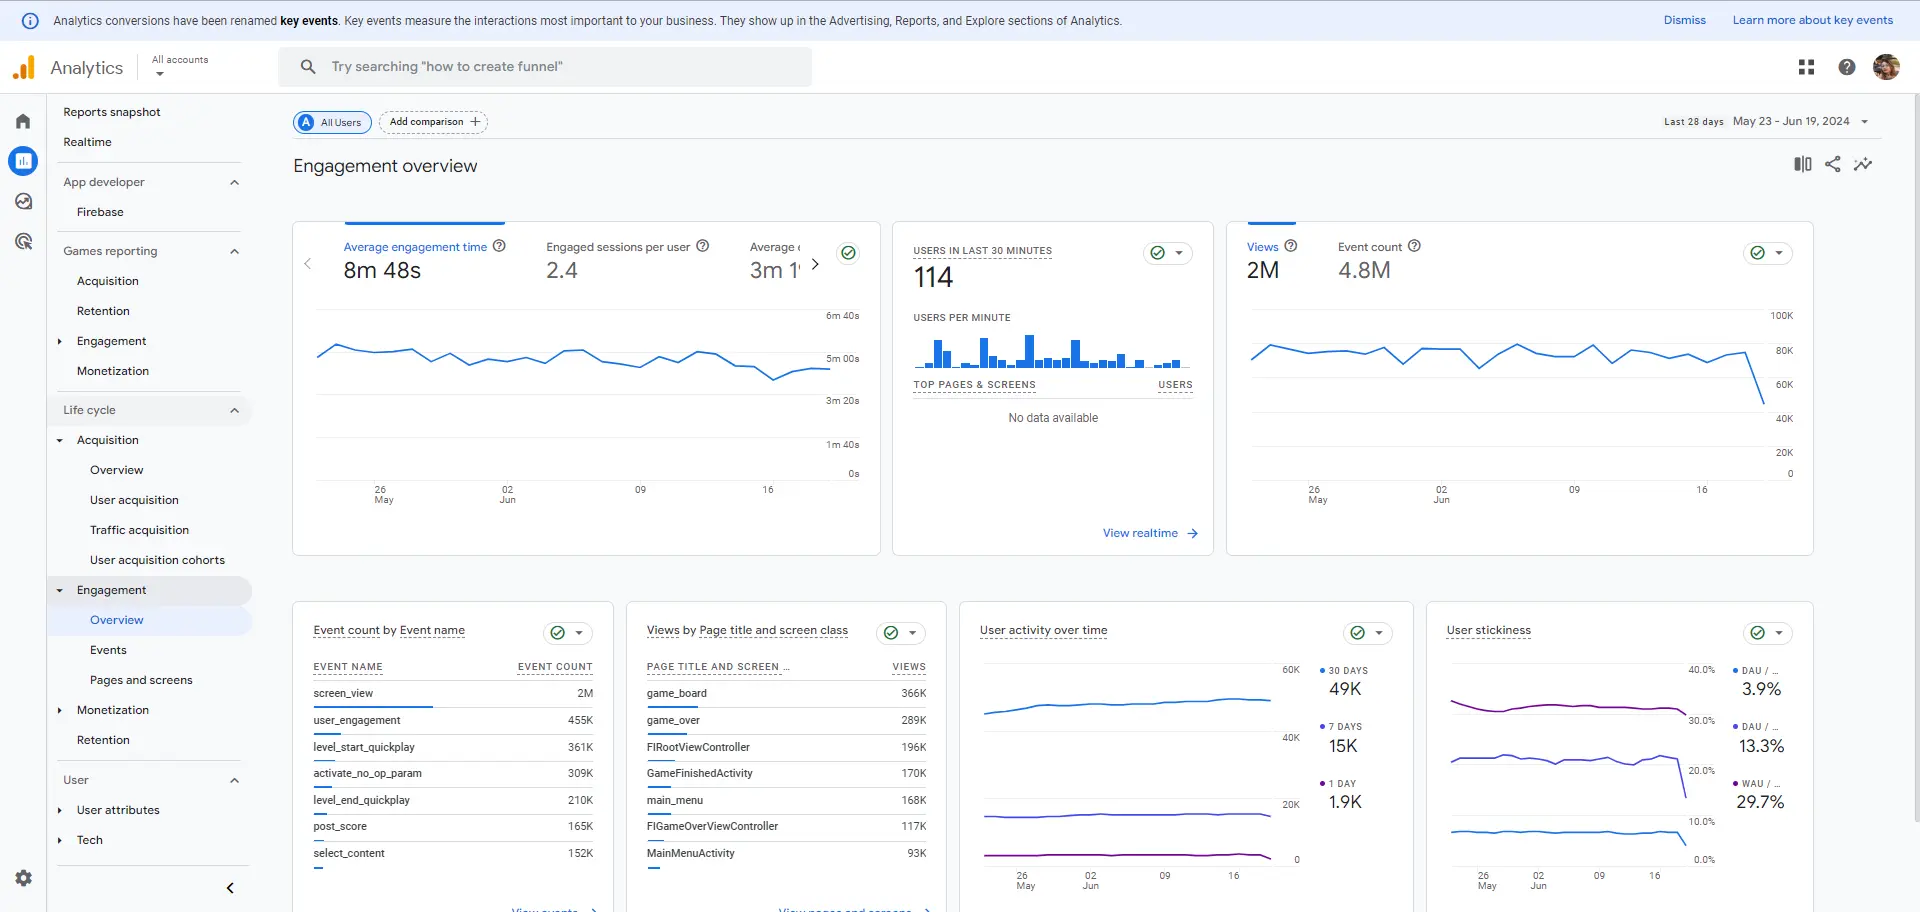
GA4 Interface

Why choose Google Analytics 4?
- No additional costs. All you need is your website and a Google account. You don’t need any paid subscriptions or API integration tokens for web SEO analyze.
- Possibility to quickly check the performance of the website. In GA4, you can see the effectiveness of optimizing each page separately or promoting your business in certain communication channels. The platform is not inferior to paid services in terms of information detail.
- Lots of integrations. Many SEO professionals consider Google Analytics to be a source of information with convenient access to the database. They develop their own business dashboard samples that connect to open sources.
Pricing policy
GA4 is free of charge. Moreover, you can use a test account for training if you don’t have a website yet. However, if you need to transfer information to Power BI dashboards or Big Data analysis tools, you will be charged according to the pricing of the services you choose.
SEOClarity
SEOClarity is a balanced site SEO analyzer. It combines web page audit and competitor monitoring modules with user-friendly reports for keyword research and backlink analysis. Combined with a user-friendly, minimalist interface, it is a good option for SEO reporting.
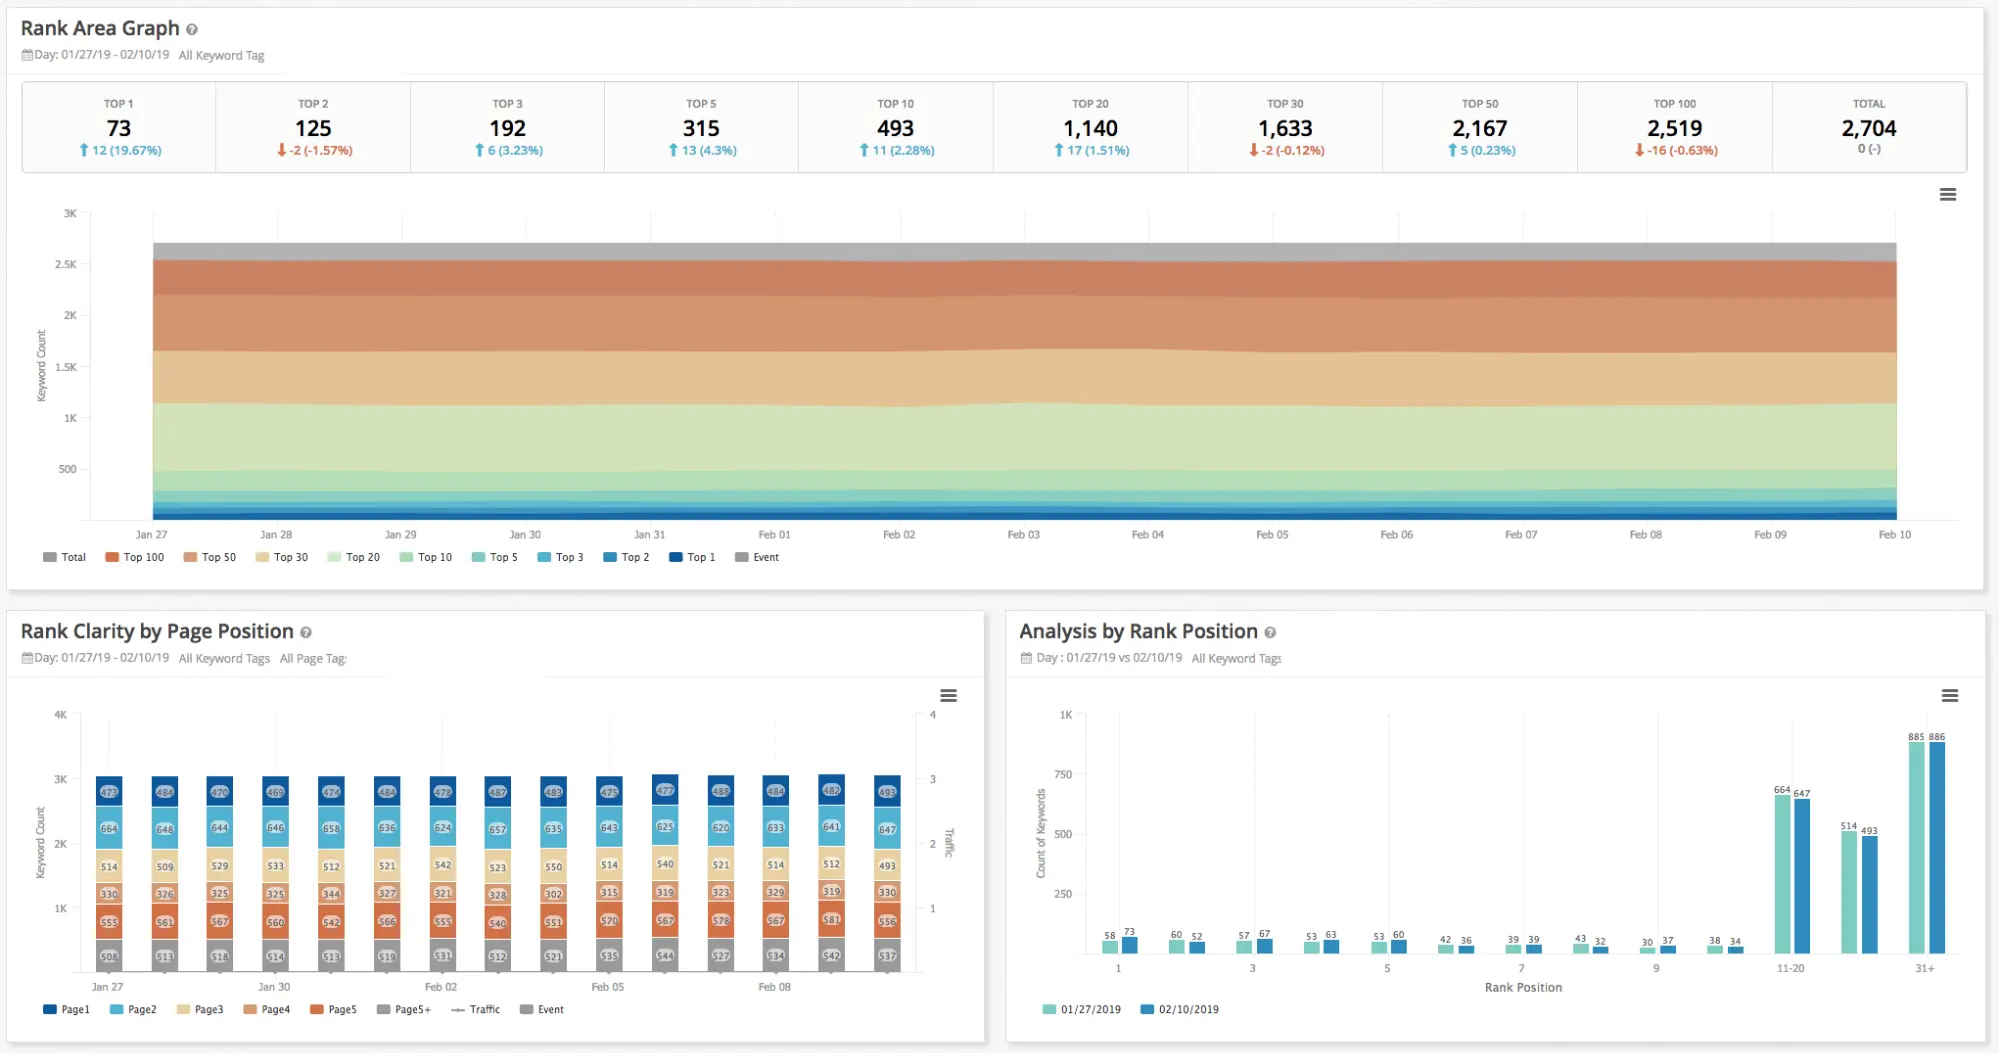
Similar to Serpstat, SEOClarity offers custom reporting: ready-made company dashboard examples and a designer for developing them from scratch. You can also choose the information flows you need, connect other databases, or generate white-label reports. The only thing SEOClarity is inferior to is the number of interactive widgets and other visualization tools. The web performance check will be informative, though a bit difficult to understand.

Why choose SEOClarity?
- Easy-to-customize reports. Ready-made samples of dashboards can be edited using the drag-n-drop method. You can use many filters to instantly select the data fields you need.
- In-depth on-page website analysis for SEO. The service provides important insights to gain competitive advantages.
- Built-in artificial intelligence. An AI called SIA generates draft articles. It can develop the author’s opinion, or make rewrites to increase the uniqueness.
Pricing policy
Unfortunately, SEOClarity’s pricing plans are not transparent. Basic and top subscriptions come with individual conditions discussed with the company’s manager during the demonstration. However the intermediate options are expensive and are more suitable for agencies with many clients than for small and medium-sized businesses. They cost from $3,200 to $4,500 per month.
How to Choose the Best SEO Dashboard?
The top priority in this area will be customization options. If you want to analyze a website for SEO, you should do it on your terms, creating perfect reports for your personal goals — improving communications, speeding up workflows, or attracting investors’ attention.
When choosing SEO tools for website analysis, you should also consider the following factors:
- Information sources. Open Google databases are great. But sometimes, they lack certain industry indicators. Therefore, the opportunity to integrate with other services will be a big plus.
- Ease of distribution. Reporting reveals all its advantages when shared. For this purpose, you can share links to dashboards with other participants in your workflows. It is best to set up access rights to comply with cyber security rules.
- Availability of interactive widgets. A graph or table that reveals more details upon clicking is an ideal alternative to dry reports. The availability of website and SEO analysis services is another nice bonus.
- Exporting. Sometimes, it is still more suitable to get data in a classic spreadsheet, for example, for Google Spreadsheets. This would be the best solution for small businesses that cannot afford complex integration and automation solutions.
- The mobile interface, so, you can analyze website SEO performance using your smartphone. This allows you to literally work on the go without wasting a single extra minute. Therefore, before signing up for a subscription, you should see exactly how the reports look on a small screen.
Conclusion
Choosing tools for site performance tests and visualizing the results can be challenging. On the one hand, there is the publicly available Google Analytics 4 service. It has many functions and solutions for integration with other software. But you should also consider its disadvantages — minimal customization options and the interface complexity. On the other hand, SEOClarity is convenient and informative but expensive.
Serpstat might be the golden mean. It offers a simple custom report builder with many templates and interactive widgets. Small businesses can use its out-of-the-box solutions, while large businesses can access APIs for integration and automation tools using the R programming language. Coupled with a user-friendly interface and affordable pricing, this makes Serpstat the optimal solution for most companies.
Frequently Asked Questions
Basically, it is a dashboard for managing key business processes. It demonstrates key indicators in a convenient form—tabular or graphical. This greatly simplifies the SEO website analysis and the evaluation of other areas of the company’s activities.
The most crucial indicators are traffic volume, conversion rate, and visitor engagement metrics. When you analyze websites SEO, you can consider them in terms of target audience segments, communication channels, geographic regions, or even the types of devices used to view pages. But you should remember that each company has its set of key metrics that should be aligned with its strategy and goals.
A dashboard is an interactive version of a report that is updated with minimal delay or even in real time. Dashboards allow you to drill down into certain areas of analytics and rebuild data fields using filters.
