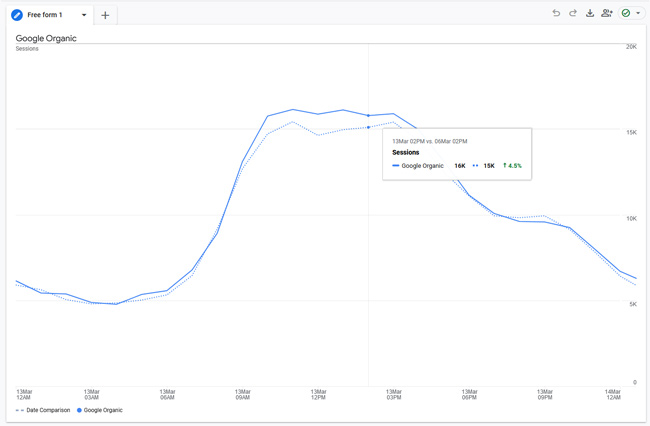
I was just asked on Twitter if there was an easy way to compare Google organic traffic hourly like you can in Universal Analytics. That’s a great question, and that’s a super useful report to have as major algorithm updates roll out. You can typically start to see the separation over time as the update rolls out (if your site was heavily impacted by a major update like broad core updates, Product Review Updates, etc.)
So I fired up GA4 and created a quick exploration report for analyzing hourly traffic. Here is a short tutorial for creating the report:
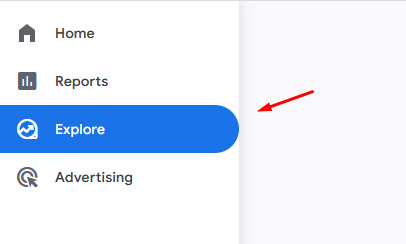
1. Fire up GA4 and click the “Explore” tab in the left-side menu.
2. Click the “Free Form” reporting option.

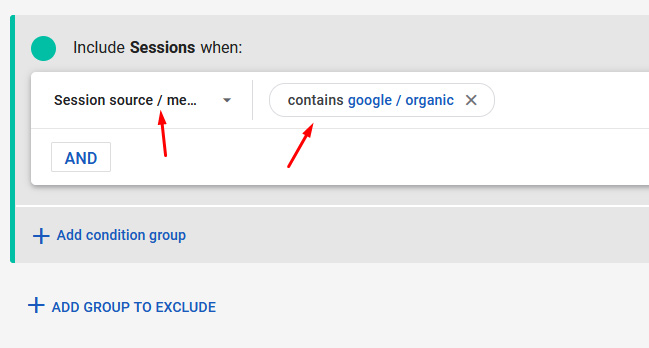
3. Click the plus sign next to “Segments” to add a new session segment. Then create a segment for Google Organic by adding a new condition, selecting “Session source / medium” and then adding a filter for “google / organic”.
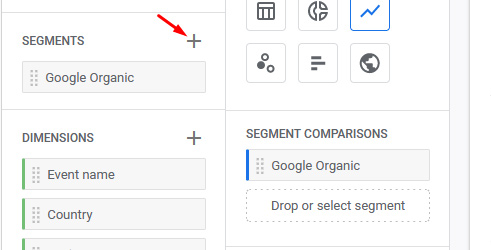
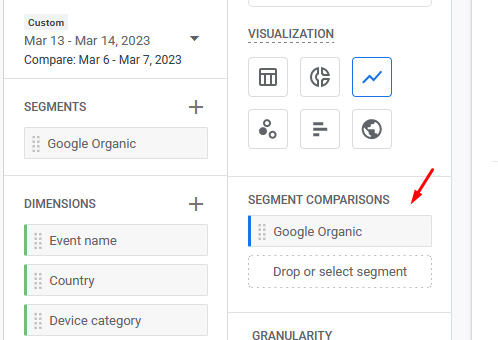
4. Add that segment to your reporting by dragging it to the “Segment Comparisons” section of the report.
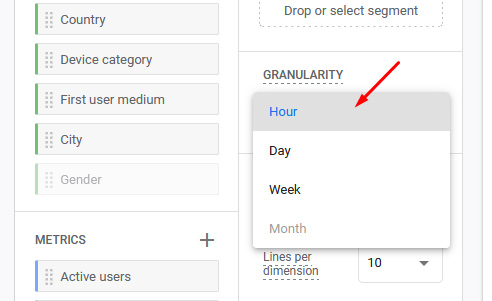
5. Set “Granularity” to Hour.
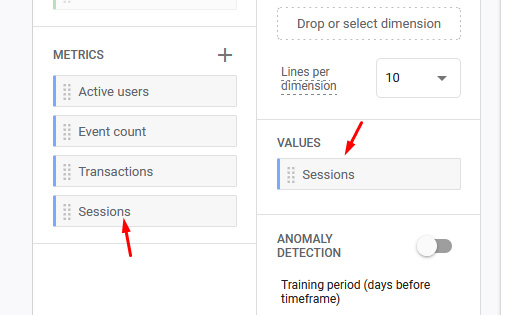
6. Add a new metric and select “Sessions”. And then drag “Sessions” to “Values”.
7. Change the visualization to line chart by clicking the line chart icon.
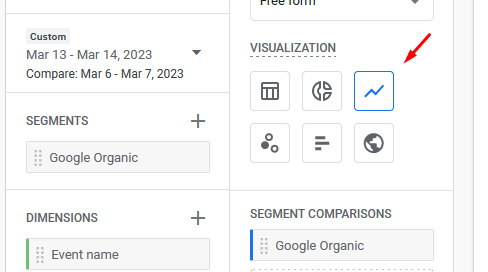
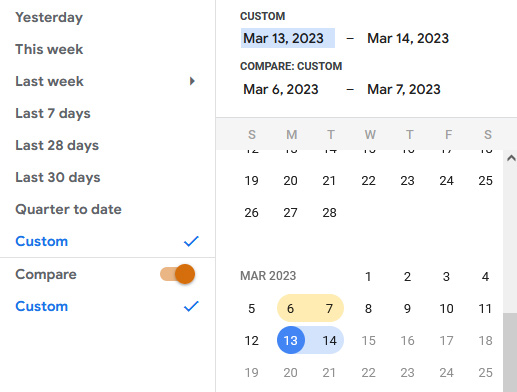
8. For timeframe, select “Compare” and choose a day. Then choose the day to compare against. Note, GA4 isn’t letting me choose today (which is a common way to see how the current day compares to a previous day). So, you’ll have to just compare the previous day to another day. Sorry, I didn’t create GA4.
9. Name your report and enjoy comparing hourly sessions.
I hope you found this helpful, especially since the March 2023 broad core update is currently rolling out. Have fun. 🙂
GG
