Scroll depth in Google Analytics 4 is a measure of how far users scroll on your page before leaving.
Scroll depth is expressed as a percentage of up to 100%, where 100% represents a user who has scrolled all the way to the bottom of your page. Depending on your specific implementation, you may choose to track scroll depth at percentages like 10%, 25%, 50%, 75%, and 90%.
Here’s an example of a portion of the scroll tracking setup process within GA4.
In this article, you’ll learn how to track scroll depth in Google Analytics. And how you can begin to use your scroll data to optimize your content.
Why Is Scroll Depth Important?
Scroll depth provides actionable data about how your users are interacting with your content.
Let’s say you wanted to uncover which pages resonate most with your audience.
Without scroll tracking, you could review your Google Analytics sessions and event data to see your most popular pages.
But with scroll depth data, you can see how those pages hold your readers’ attention as they scroll through your content. That is data you can act upon to improve your website’s performance.
You have two options when it comes to generating scroll data in Google Analytics:
- You can use the default that will trigger a scroll depth event when someone scrolls 90% of your page
- Or you can create a custom event to measure scroll activity in more detail
Let’s review the default option first.
You can track Google Analytics 4 scroll depth automatically as long as you turn the proper enhanced measurement event on. When enabled, this will generate scroll event data every time a user makes it 90% of the way down the page.
Why 90%?
Webpages often have a footer that sits below the conclusion of an article that most readers will not fully scroll through. So you can generally consider a scroll depth of 90% to mean a user has read your full article.
Before getting started, you need to ensure that you have set up Google Analytics on your website.
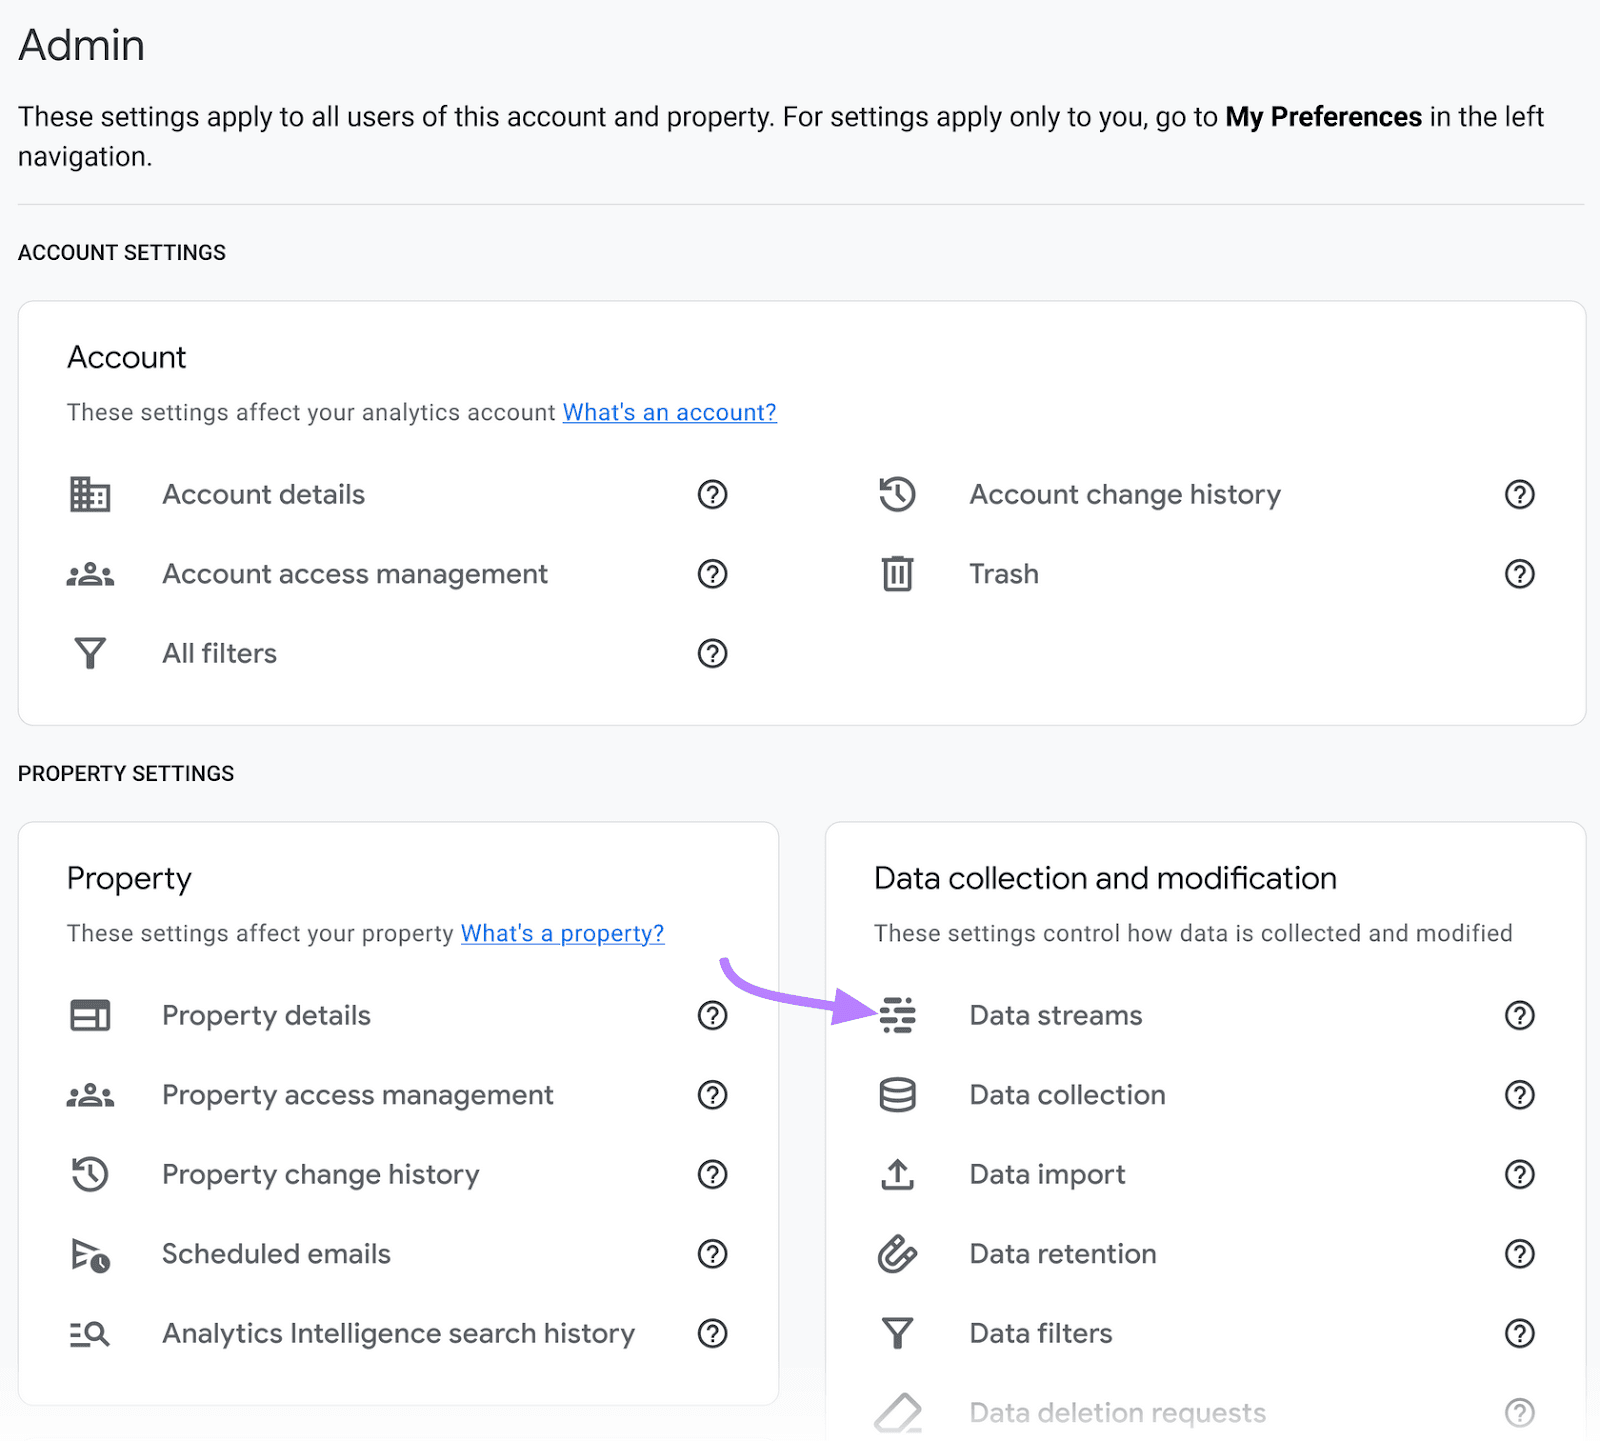
From there, click on the gear icon in the bottom left of GA4 to go to the “Admin” section.
Then, click “Data streams” within the property settings (under “Data collection and modification”).
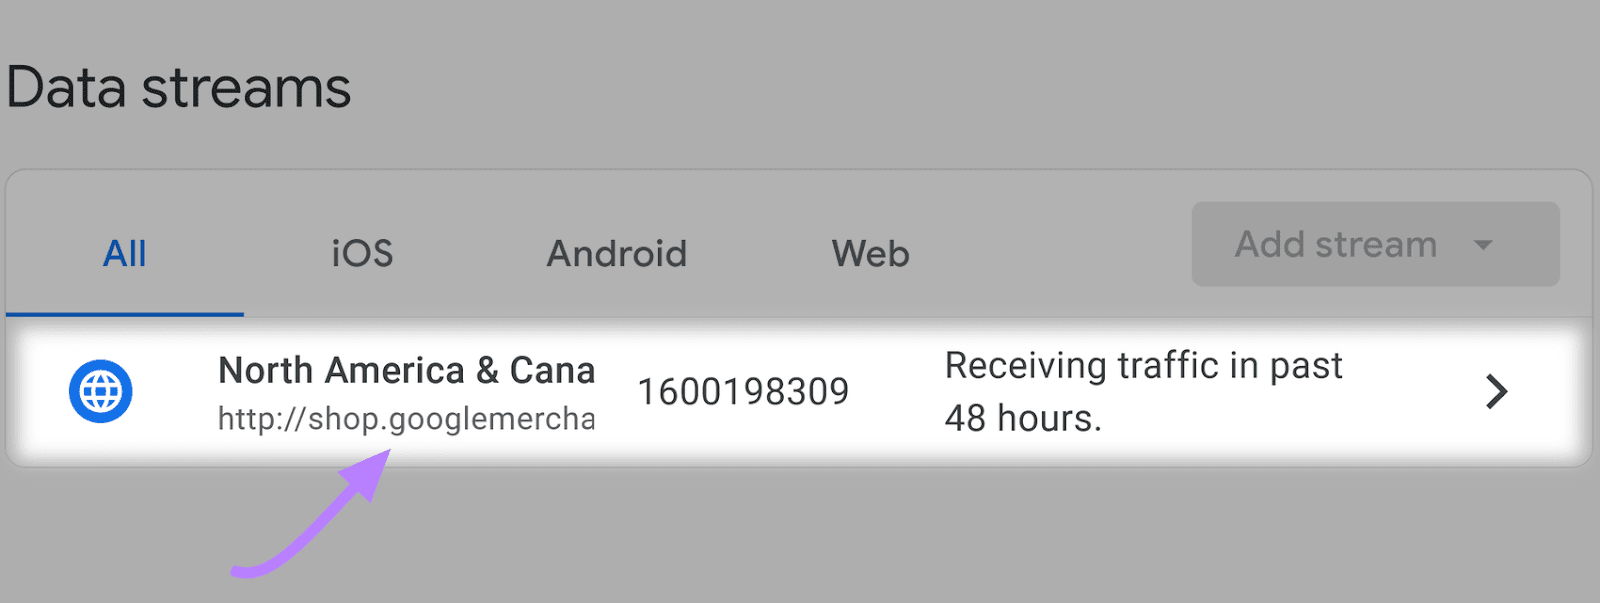
Click into your website’s data stream.
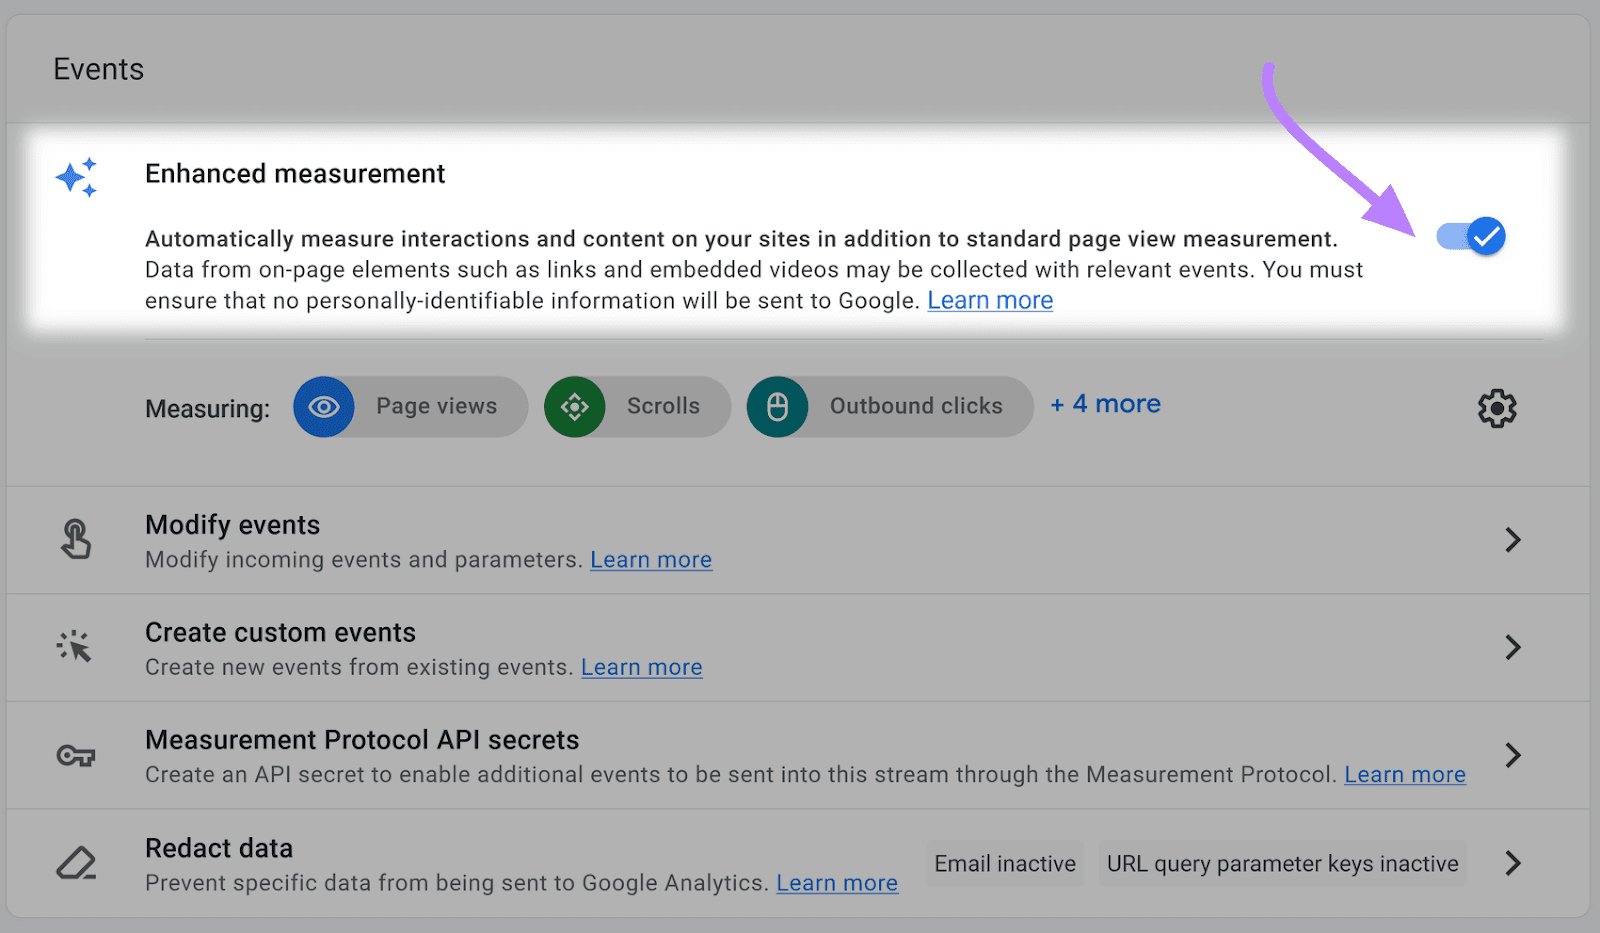
Ensure the blue bar to enable “Enhanced measurement” is toggled on. (It should be on by default.)
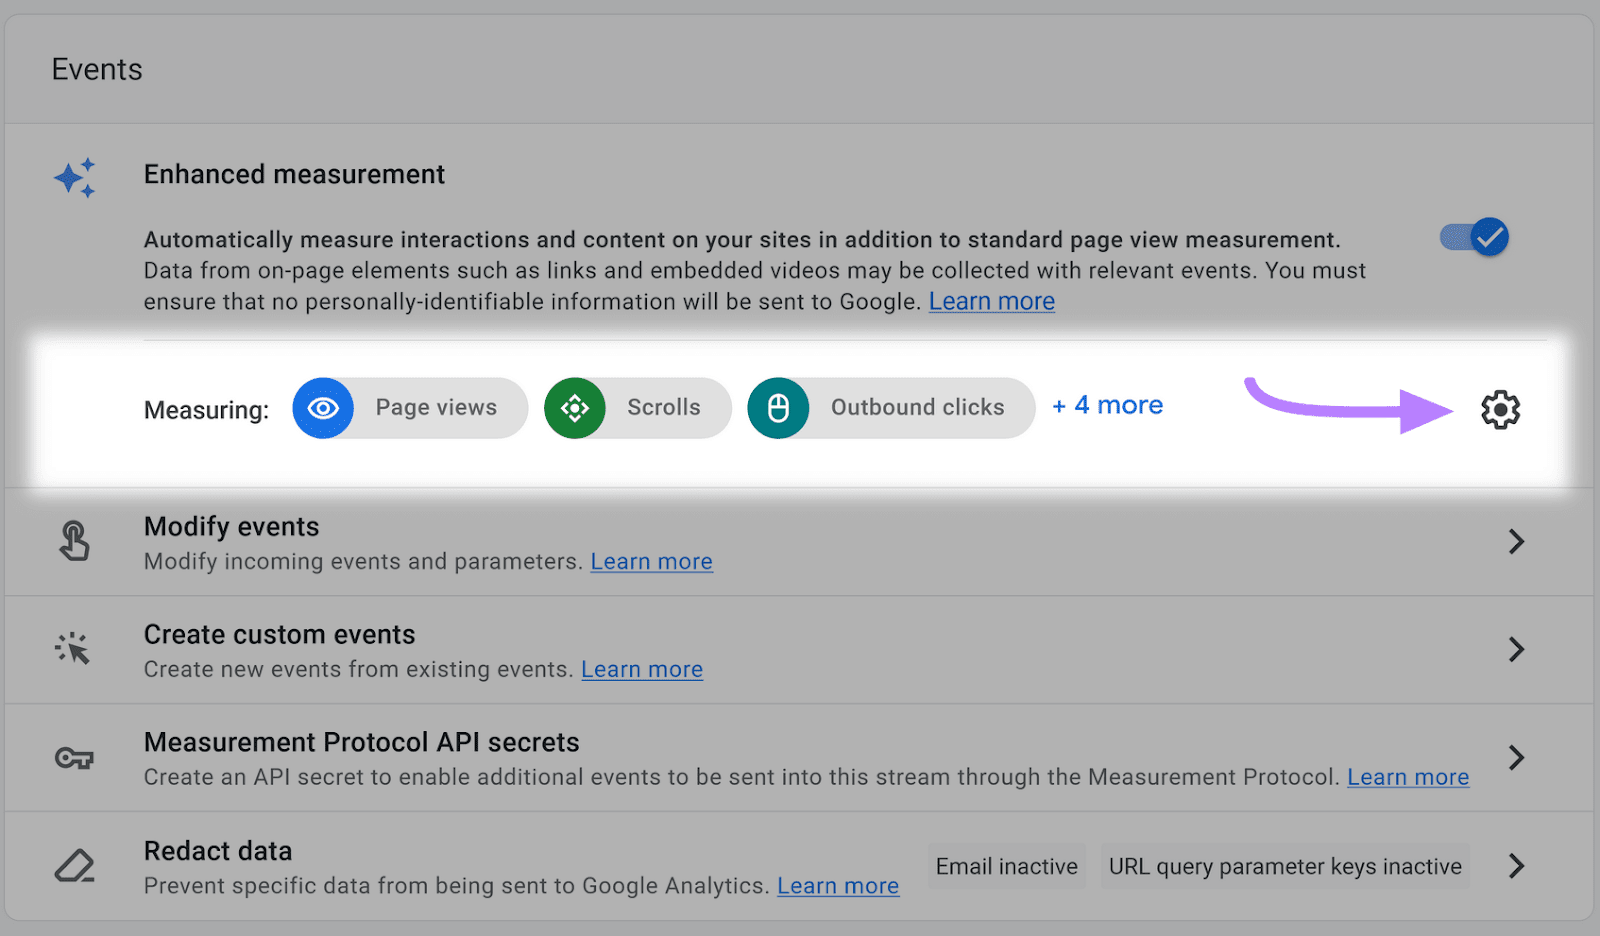
Now, click the gear icon to access settings for individual enhanced measurement events.
You’ll see a list of enhanced measurement events you can turn on or off with a single click. Below, we can see “Scrolls” is not turned on. To activate it, simply click the toggle switch and then click “Save.”
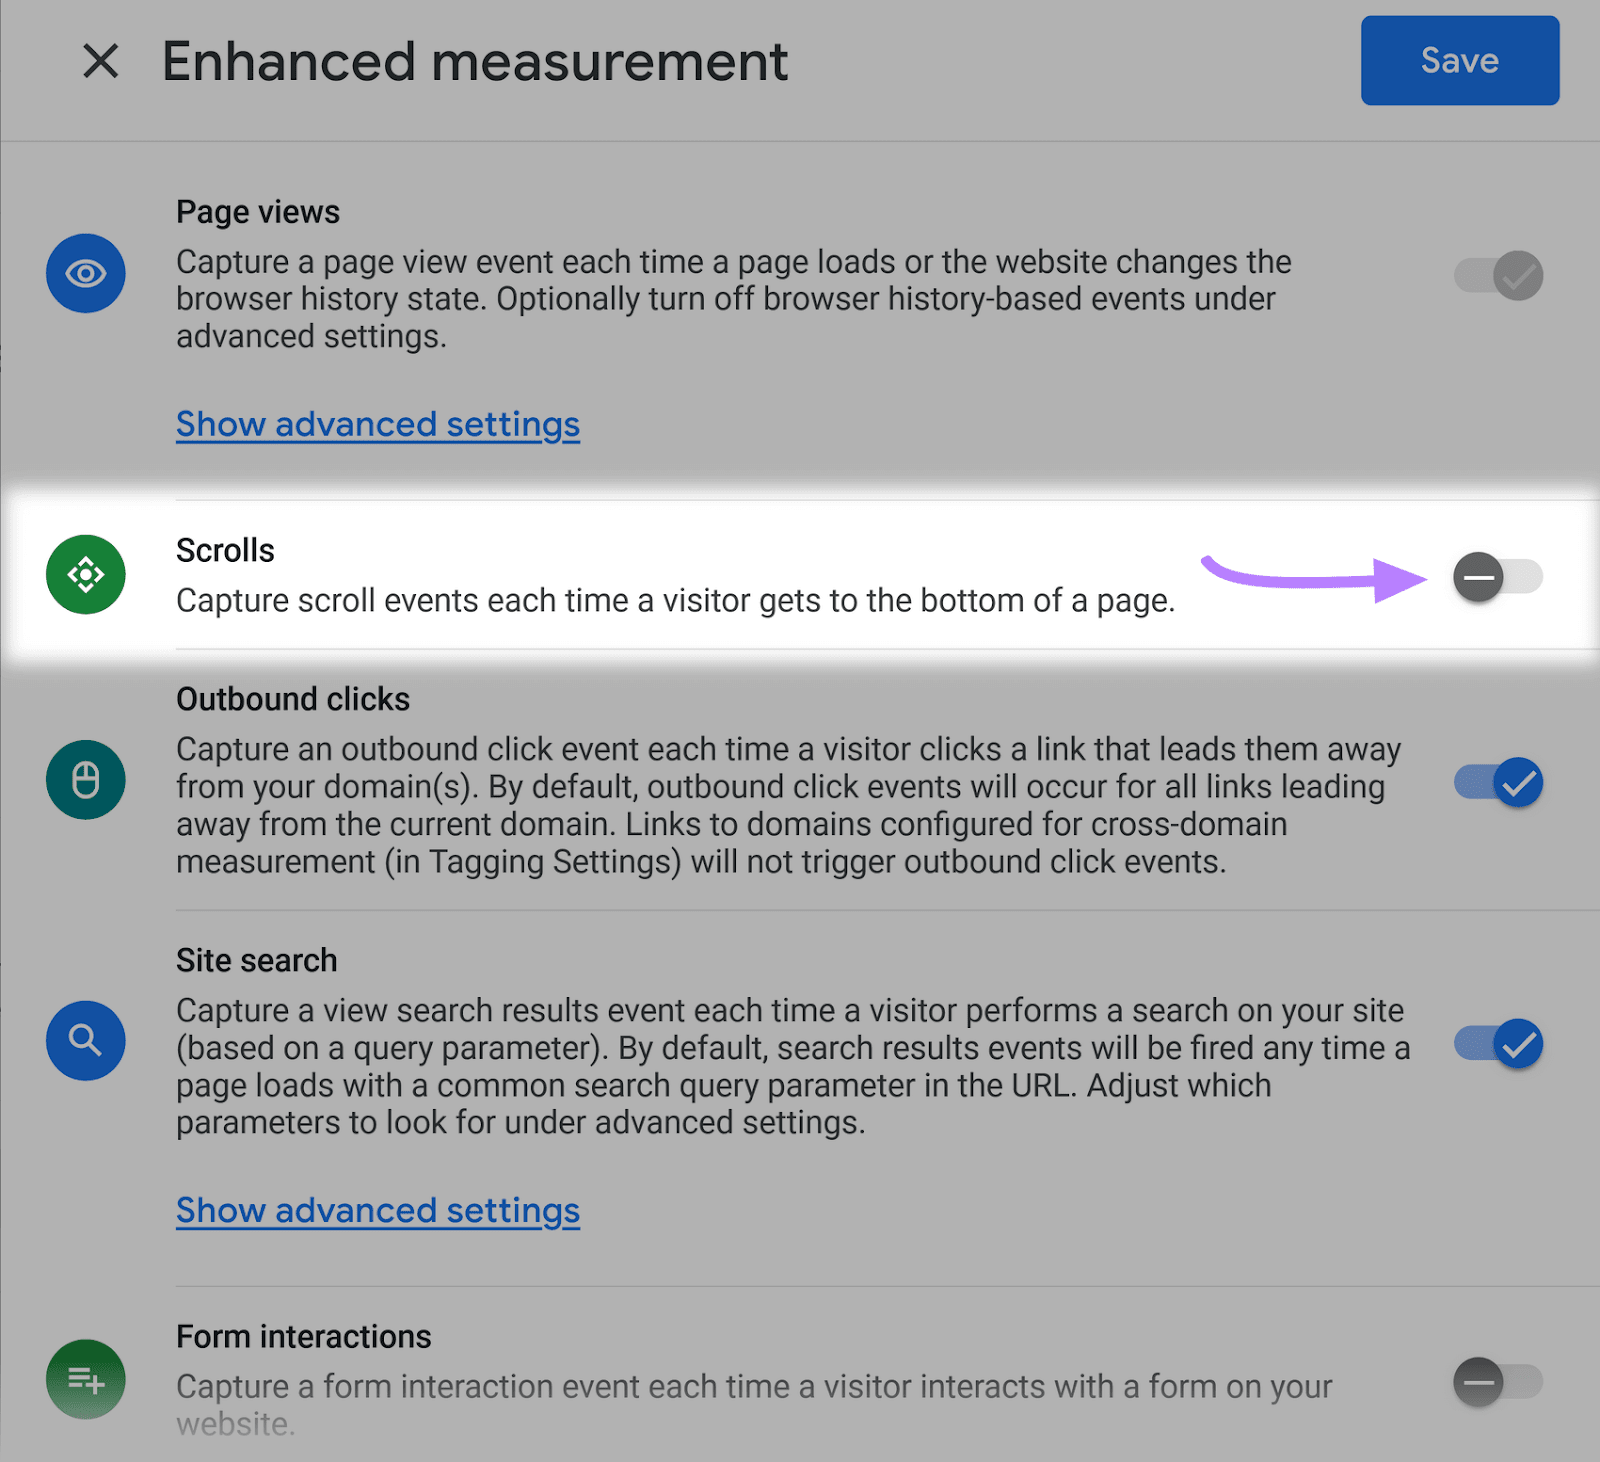
With this, you’ll now be tracking scroll activity whenever your readers scroll 90% of the way to the bottom of a page.
But what do you do if you want to see scroll depth with more detail?
To do that, you’ll first want to turn off the toggle switch we just reviewed here. (This avoids potentially double tracking the same scroll events.) And you’ll need the help of Google Tag Manager.
You can track scroll depth with greater specificity by combining Google Analytics with Google Tag Manager (GTM). If you don’t have this set up yet, check out our full Google Tag Manager guide.
You’ll be able to track scroll depth at any percentages you choose by using a tag, a trigger, and variables that will generate GA4 event data. In this guide, we’ll use 10%, 25%, 50%, 75%, and 90% to get the data we need.
Let’s first define these three important Google Tag Manager terms before you set them up.
Tags, Triggers, and Variables in Google Tag Manager
Tags, triggers, and variables work together in GTM to create GA4 event data:
- A tag is what will create the scroll depth event data that will flow into Google Analytics
- A trigger tells the tag when to fire and create the scroll data
- A variable is a placeholder for a value that will change, such as the specific vertical scroll depth percentages that you want to track
Strategically combining tags, triggers, and variables is the essence of using Google Tag Manager to create GA4 custom events.
How to Configure Your Scroll Depth Variables in GTM
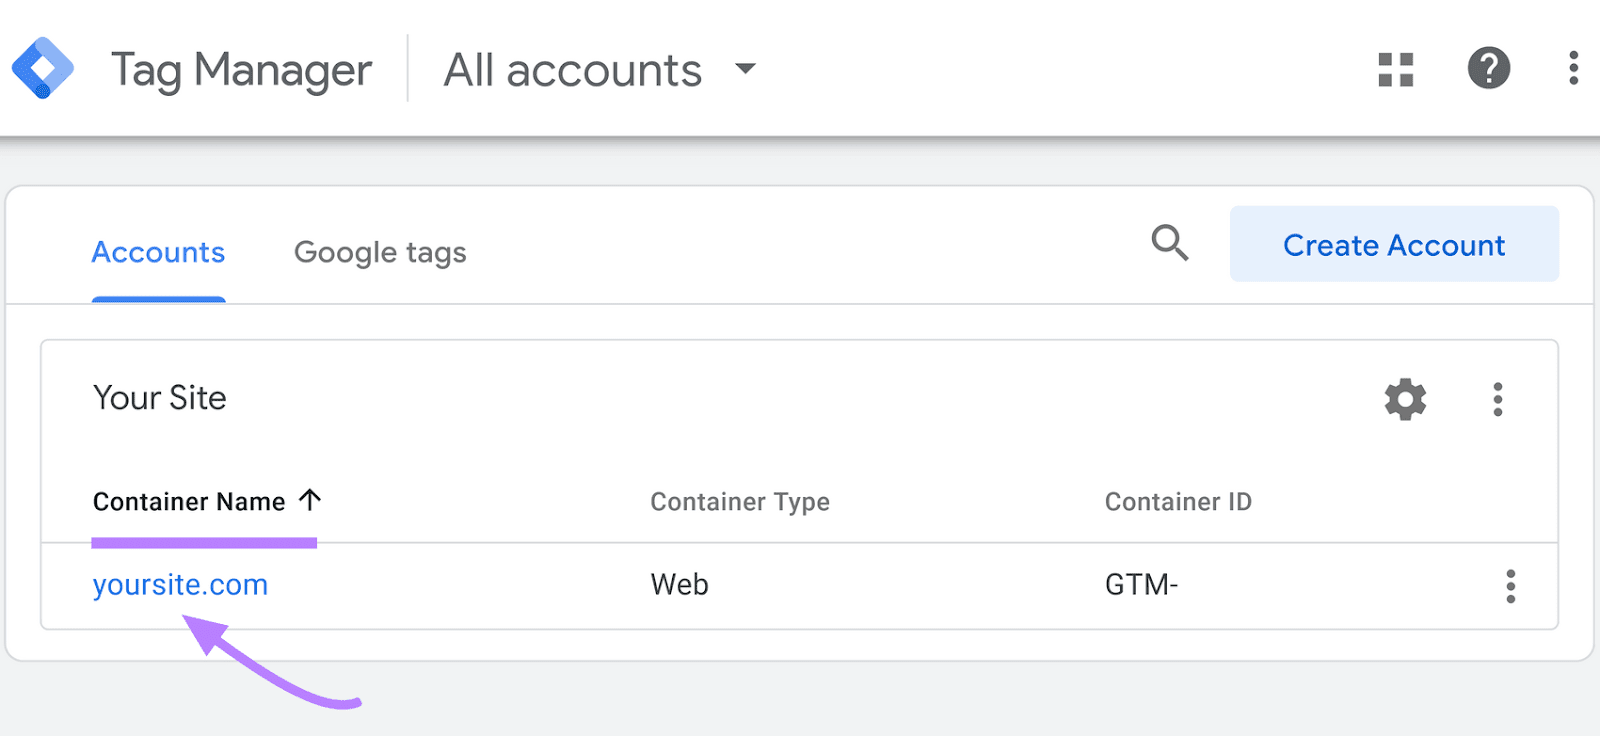
To get started, head over to tagmanager.google.com, where you’ll begin by configuring the variables you need. Then, click on the “Container Name” that is associated with your website.
You’ll see the “Overview” section of your Google Tag Manager container.
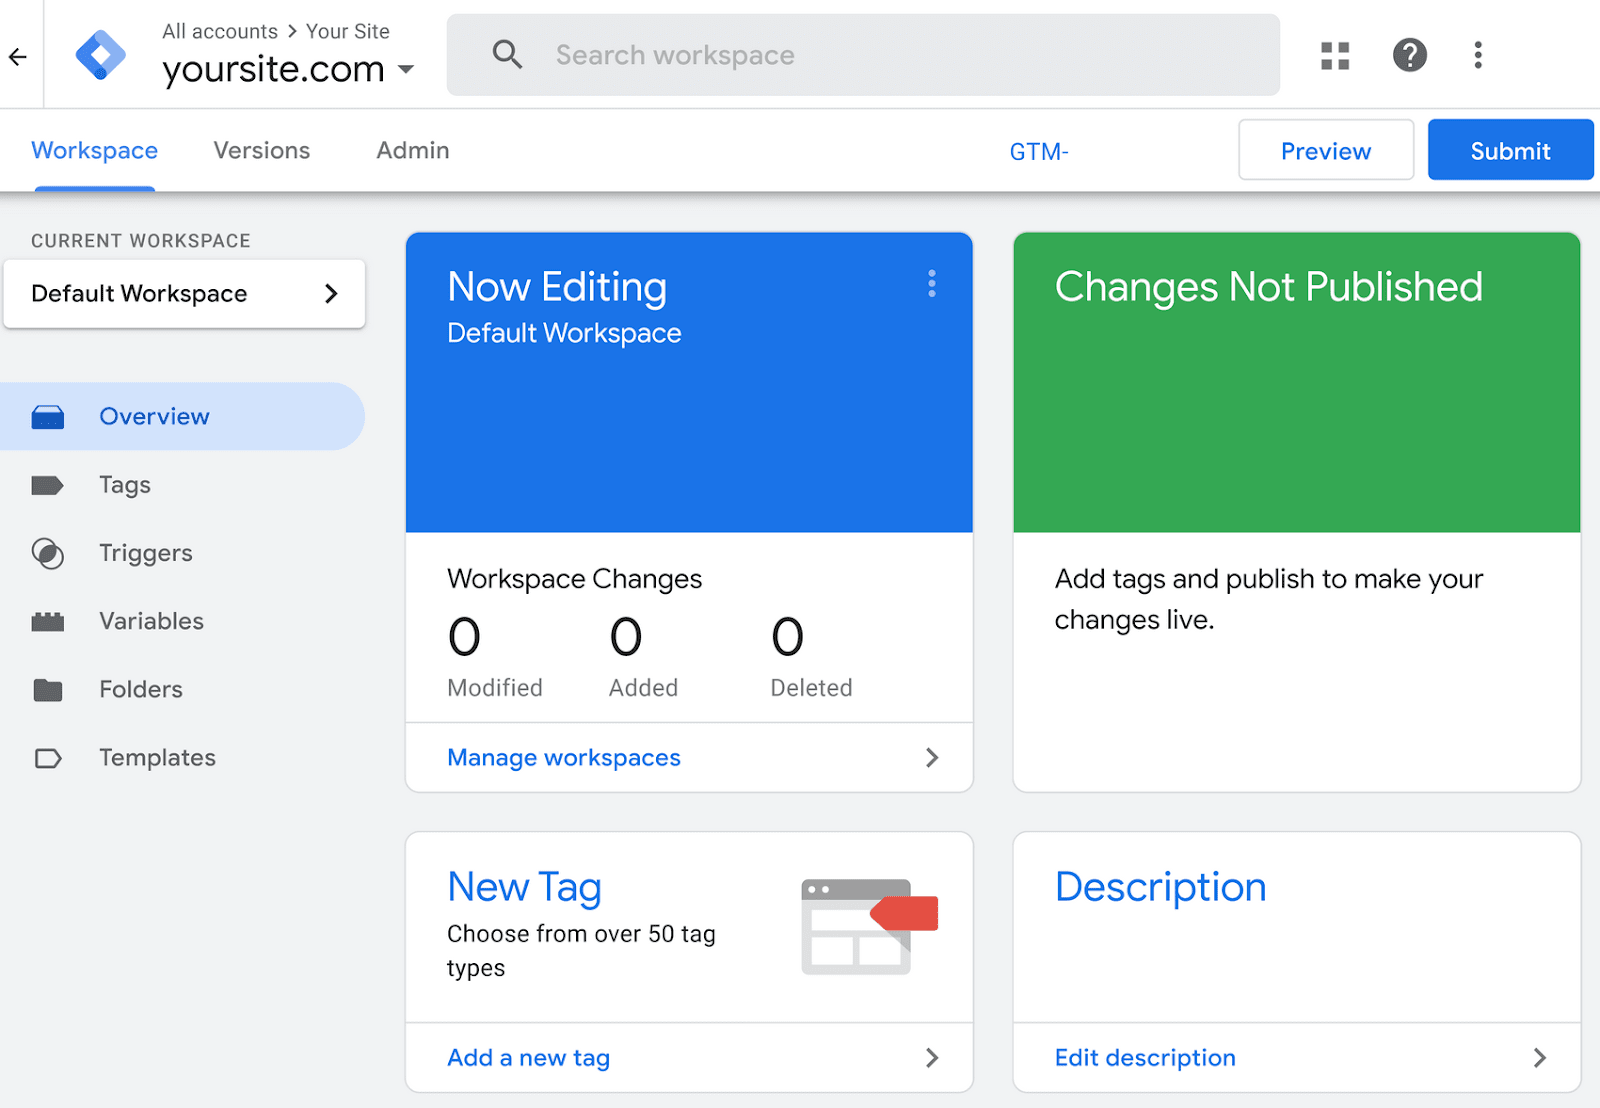
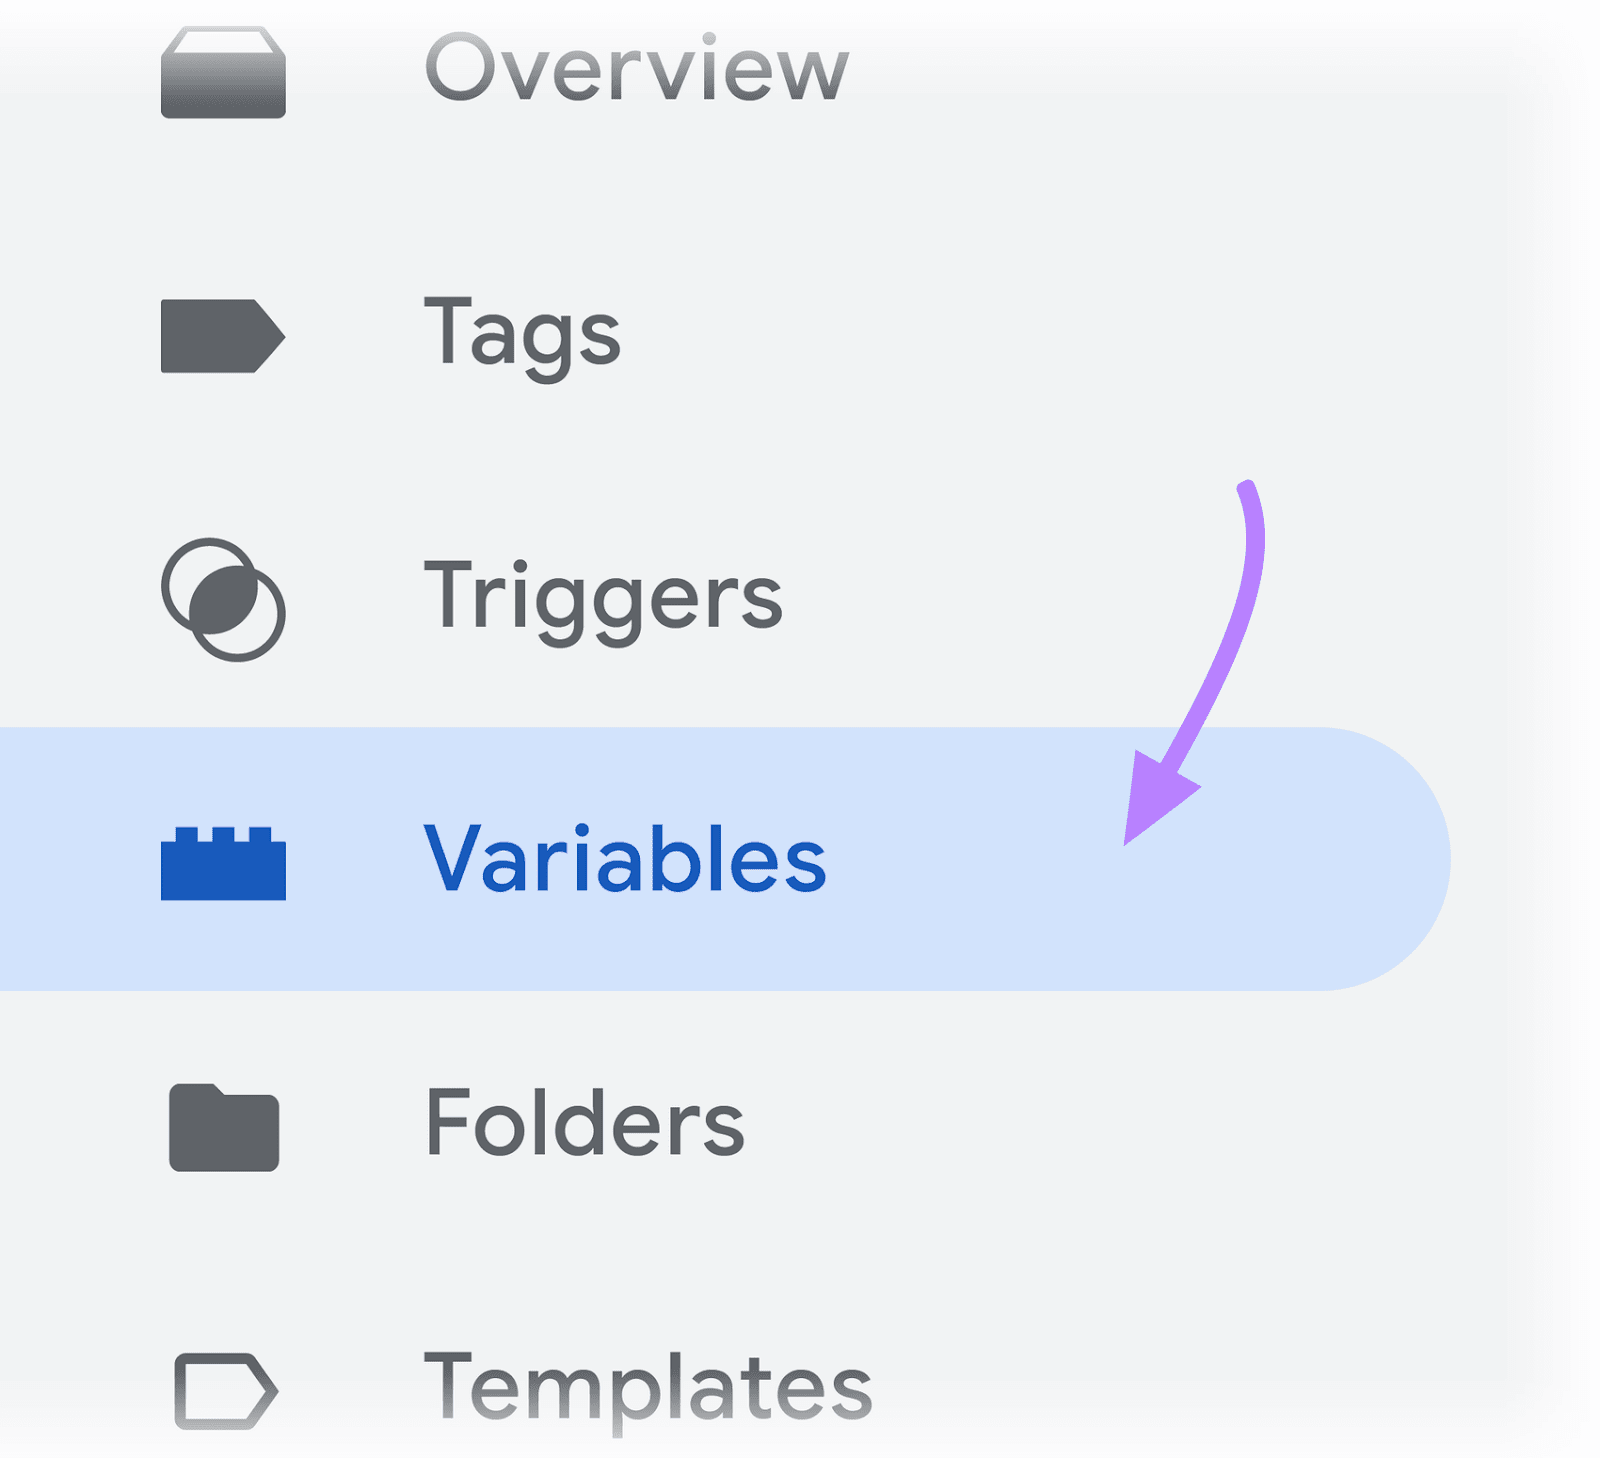
Click “Variables” from the left-hand navigation.
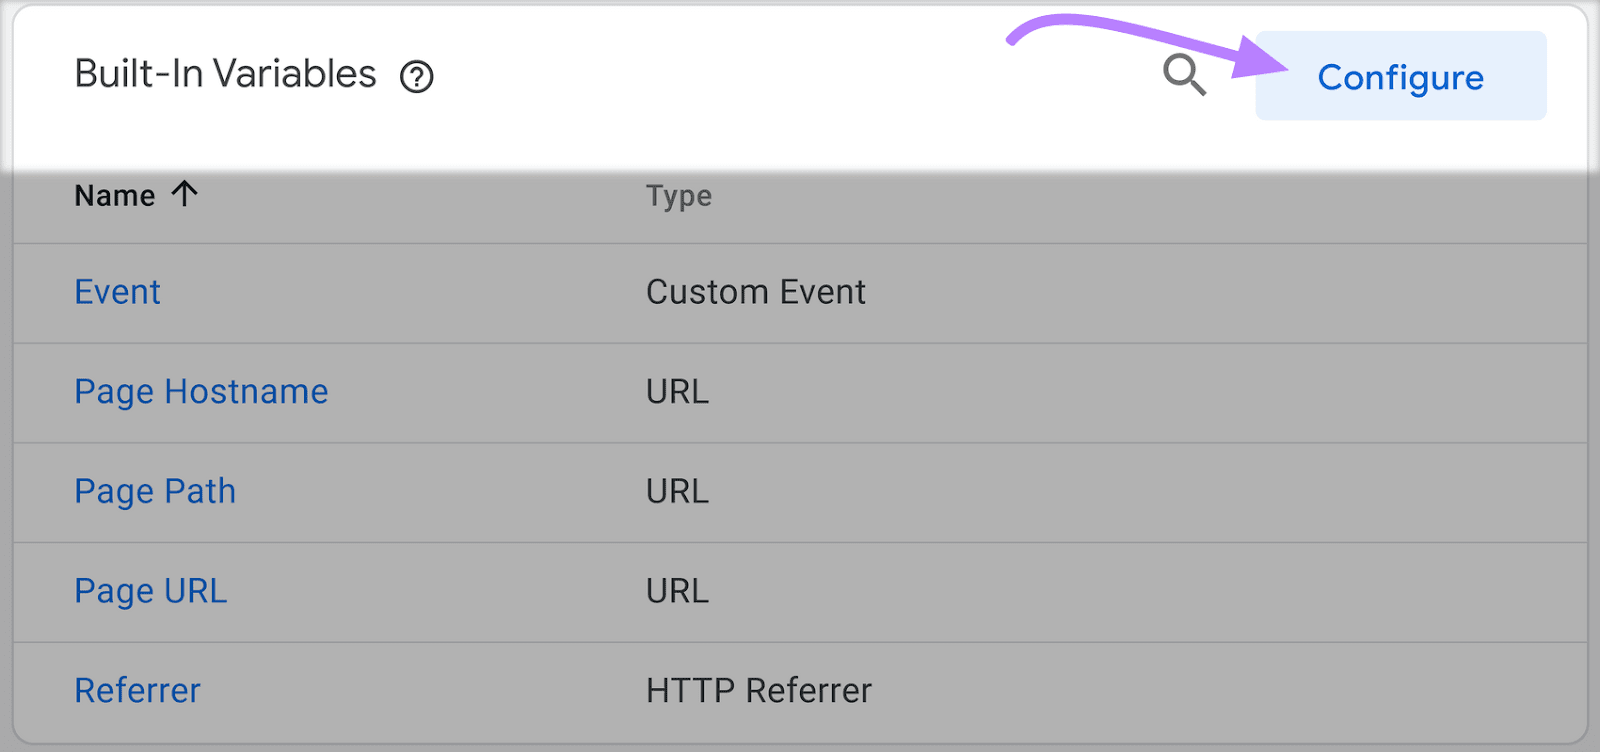
You’ll see the option to configure “Built-In Variables” that you can use in your tags and triggers. Click “Configure.” A list of variables will appear on the right-hand side of the screen.
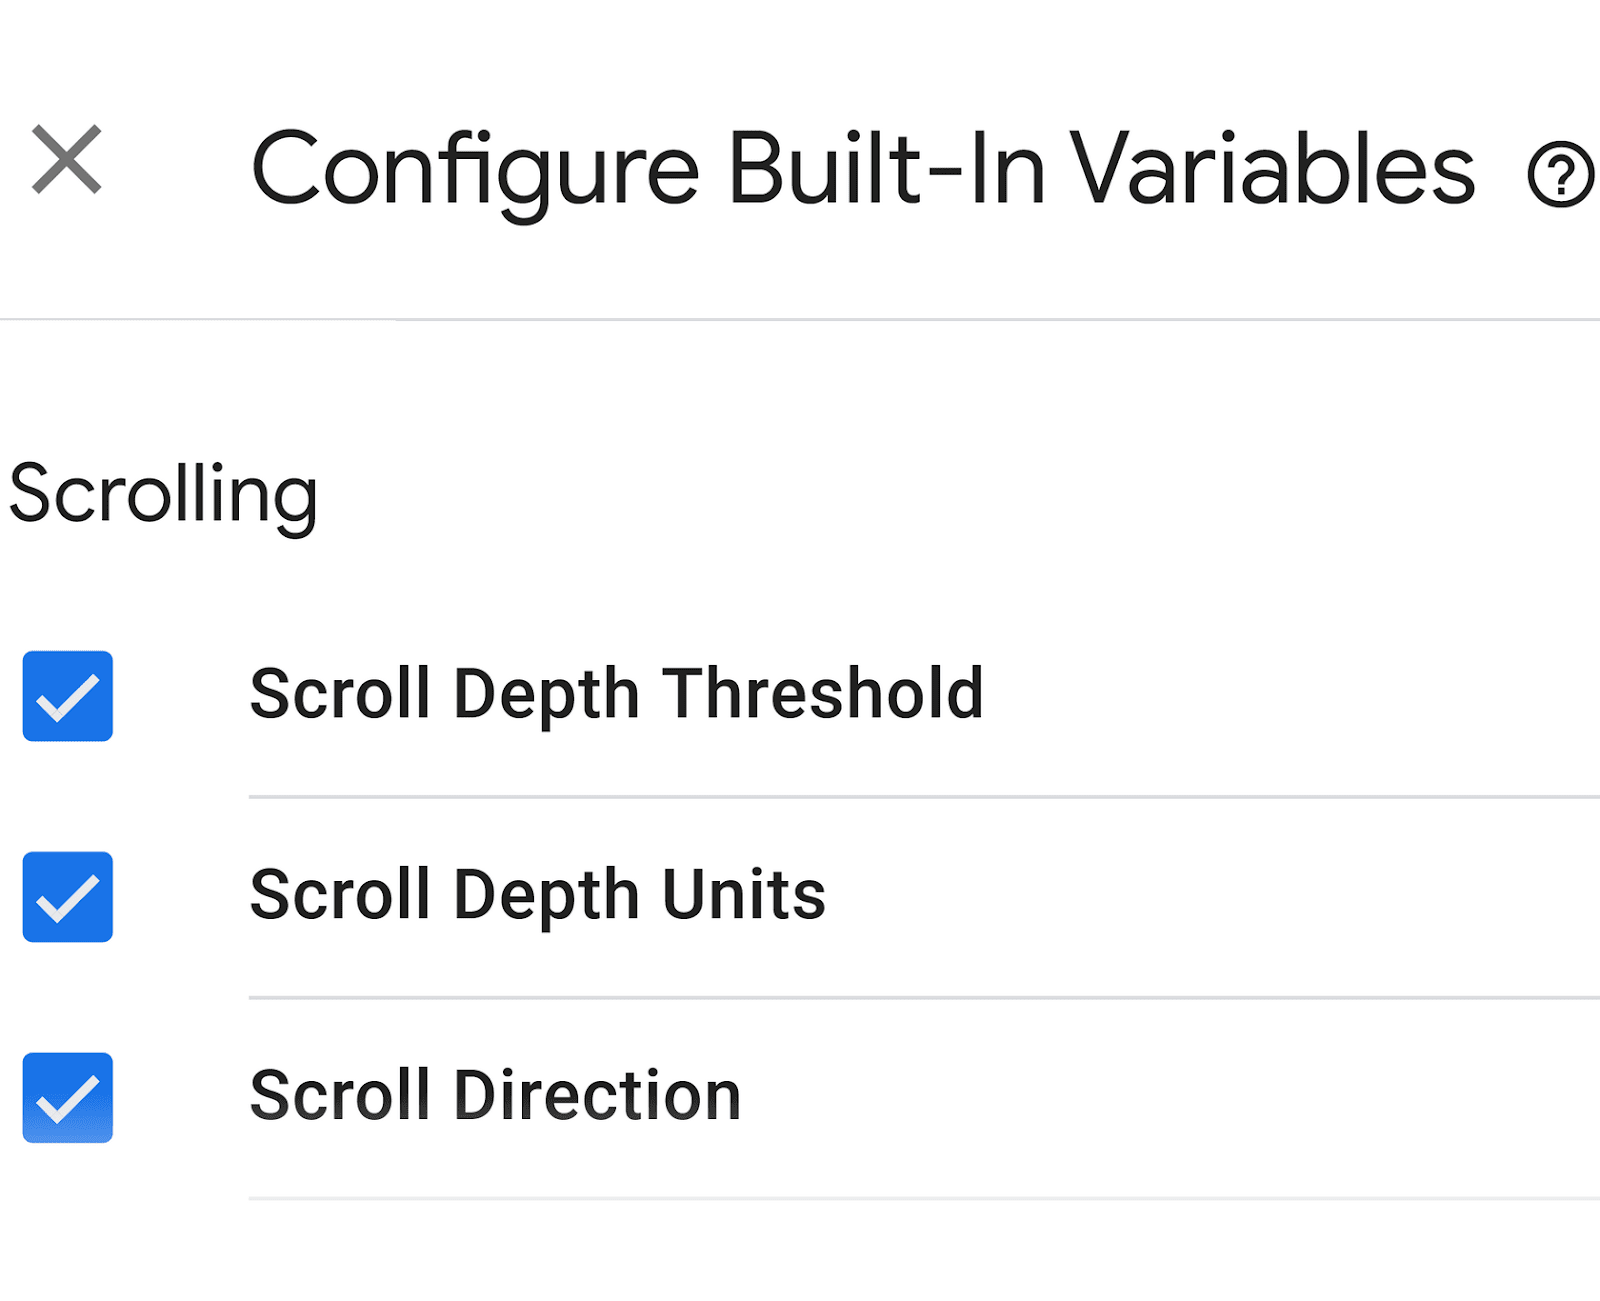
Scroll down toward the bottom of the list to see three variables specific to scroll depth tracking, under the “Scrolling” header. Use the checkboxes to turn them on.
Like this:
You’ve now configured your scroll depth variables. You can close this list.
Let’s now create a scroll depth trigger that will specify which scroll depth thresholds to track.
How to Create a Scroll Depth Trigger
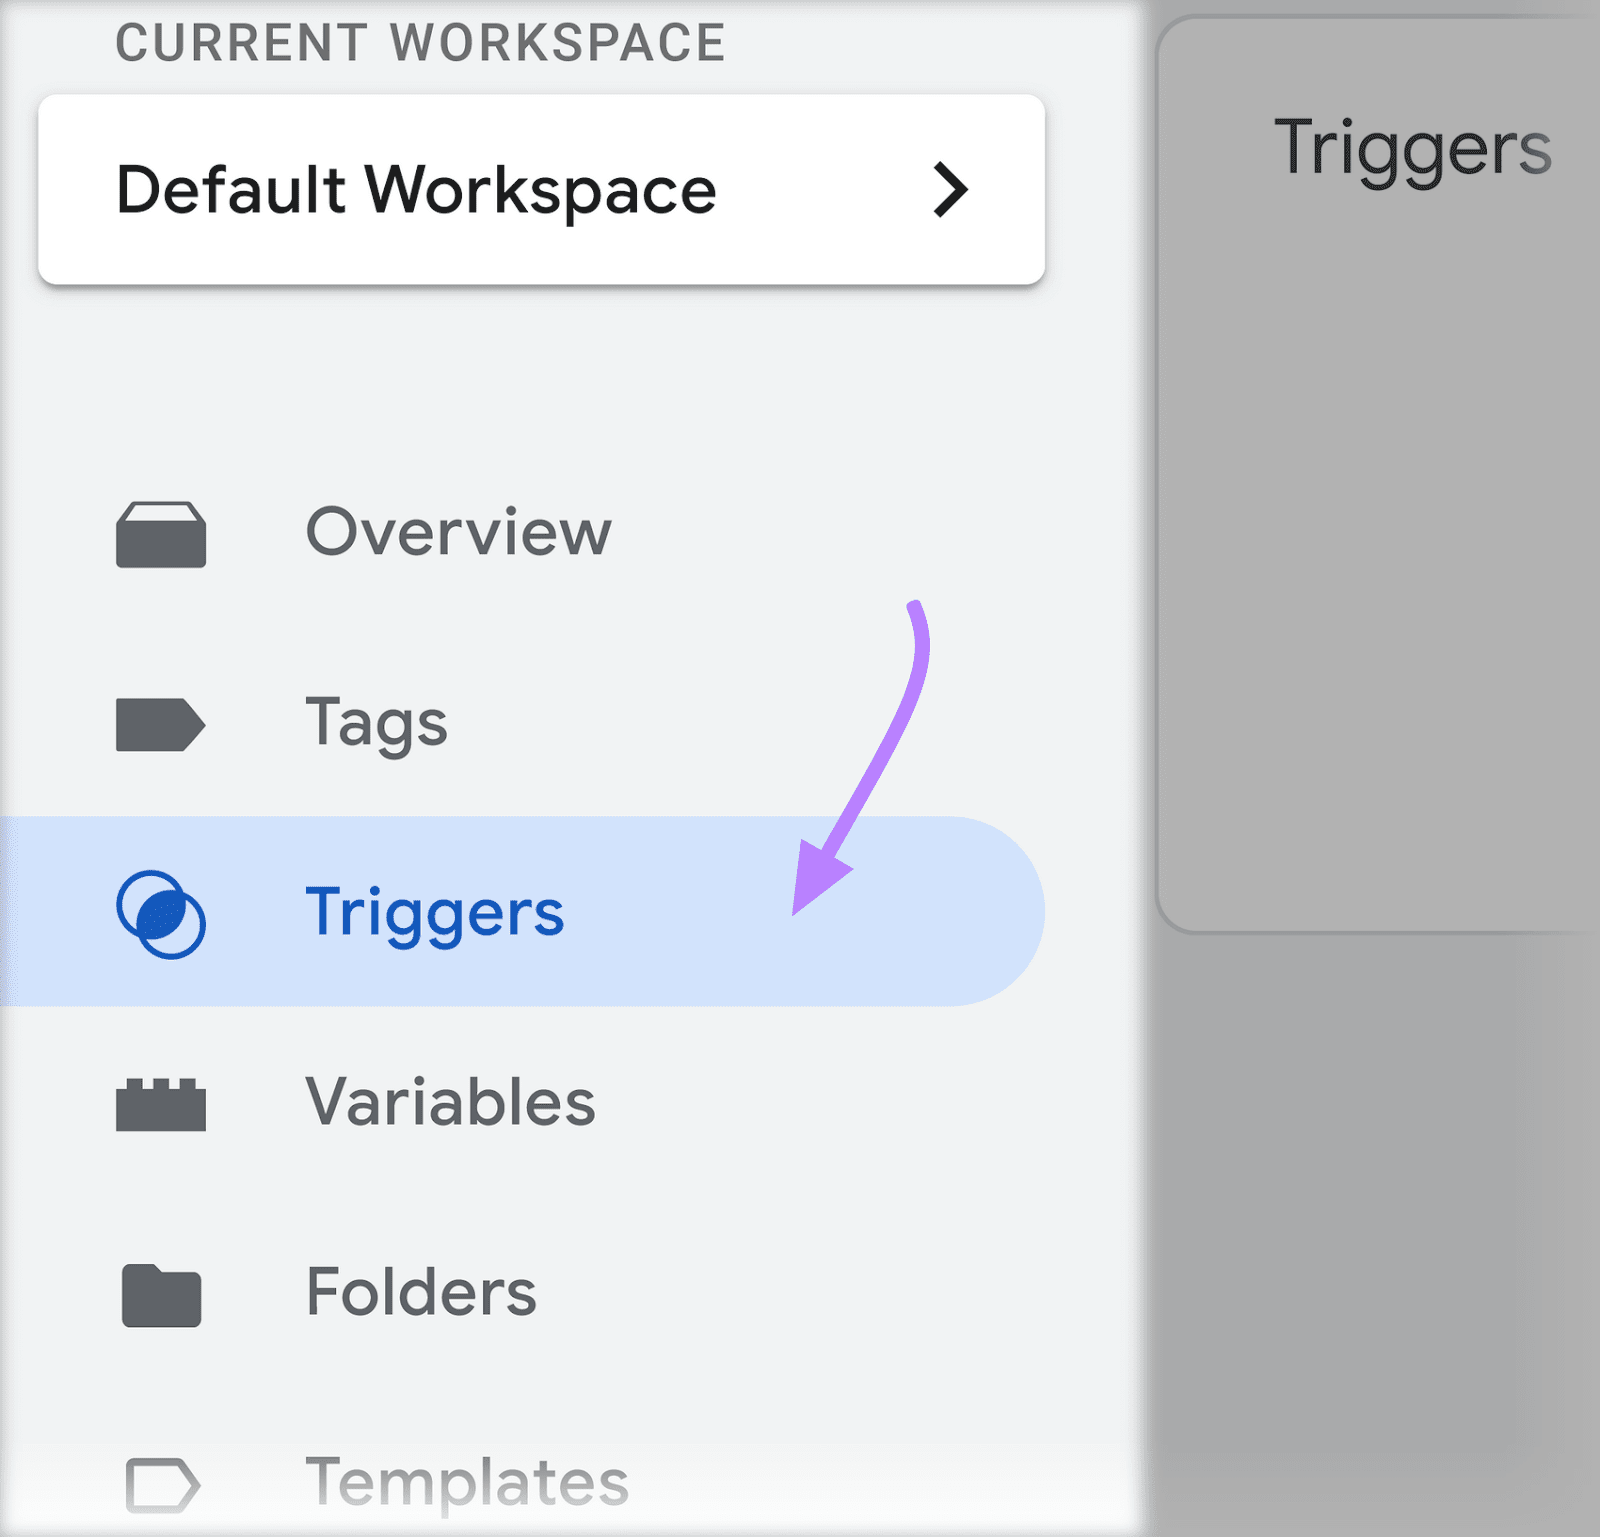
Click “Triggers” from the left-hand navigation.
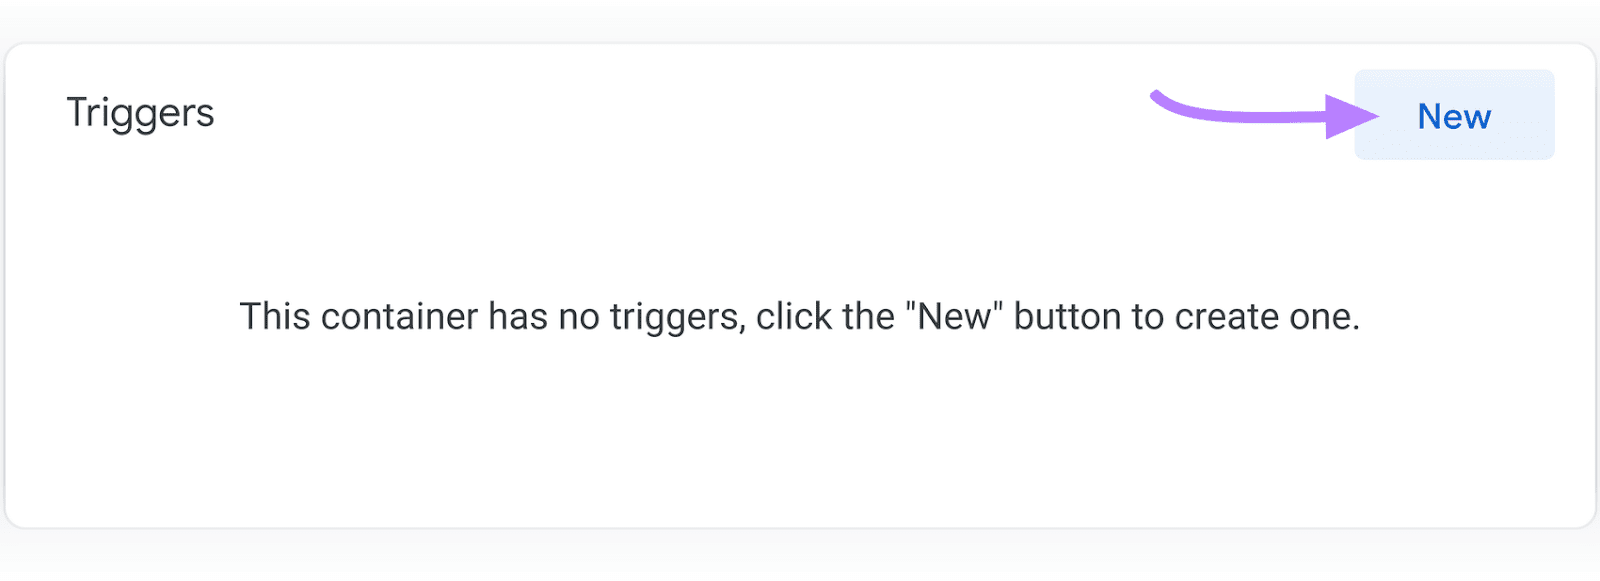
Now, click “New” to create a new trigger.
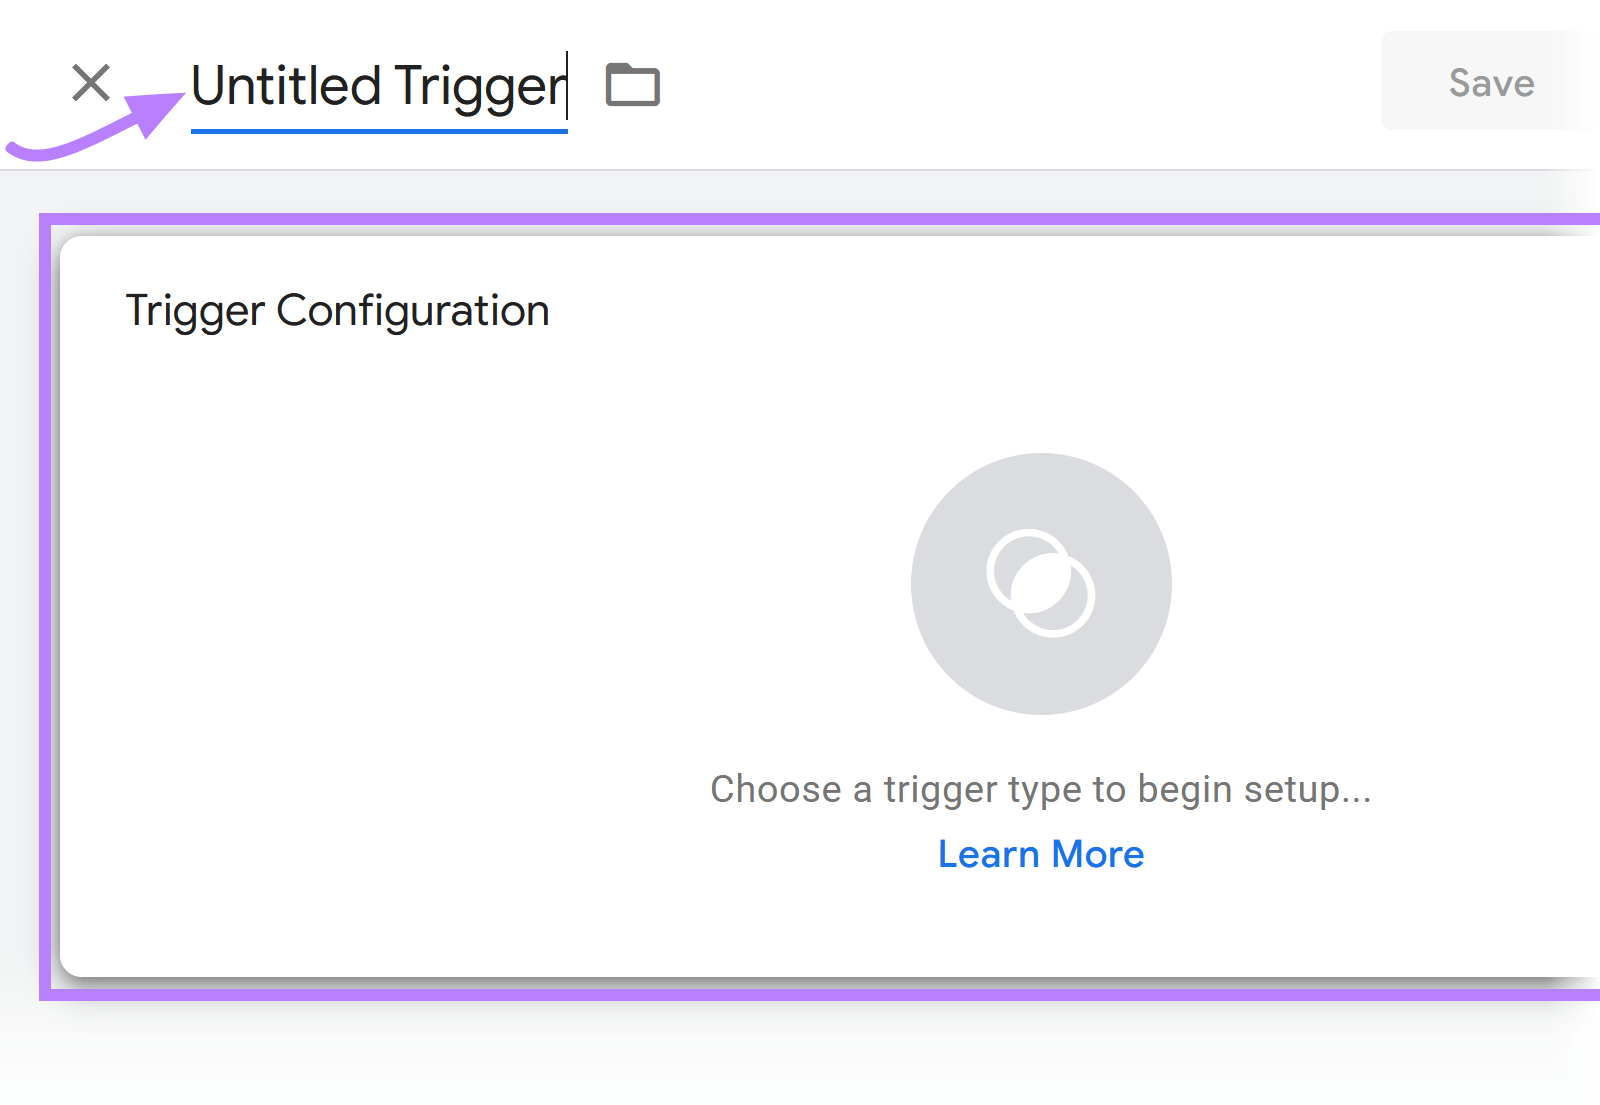
You’ll see an untitled trigger and a space where you can begin setting up your new trigger. Start by giving your trigger a recognizable name.
You can use something like “Scroll Depth Trigger.” Then, click the “Trigger Configuration” area to choose your trigger type.
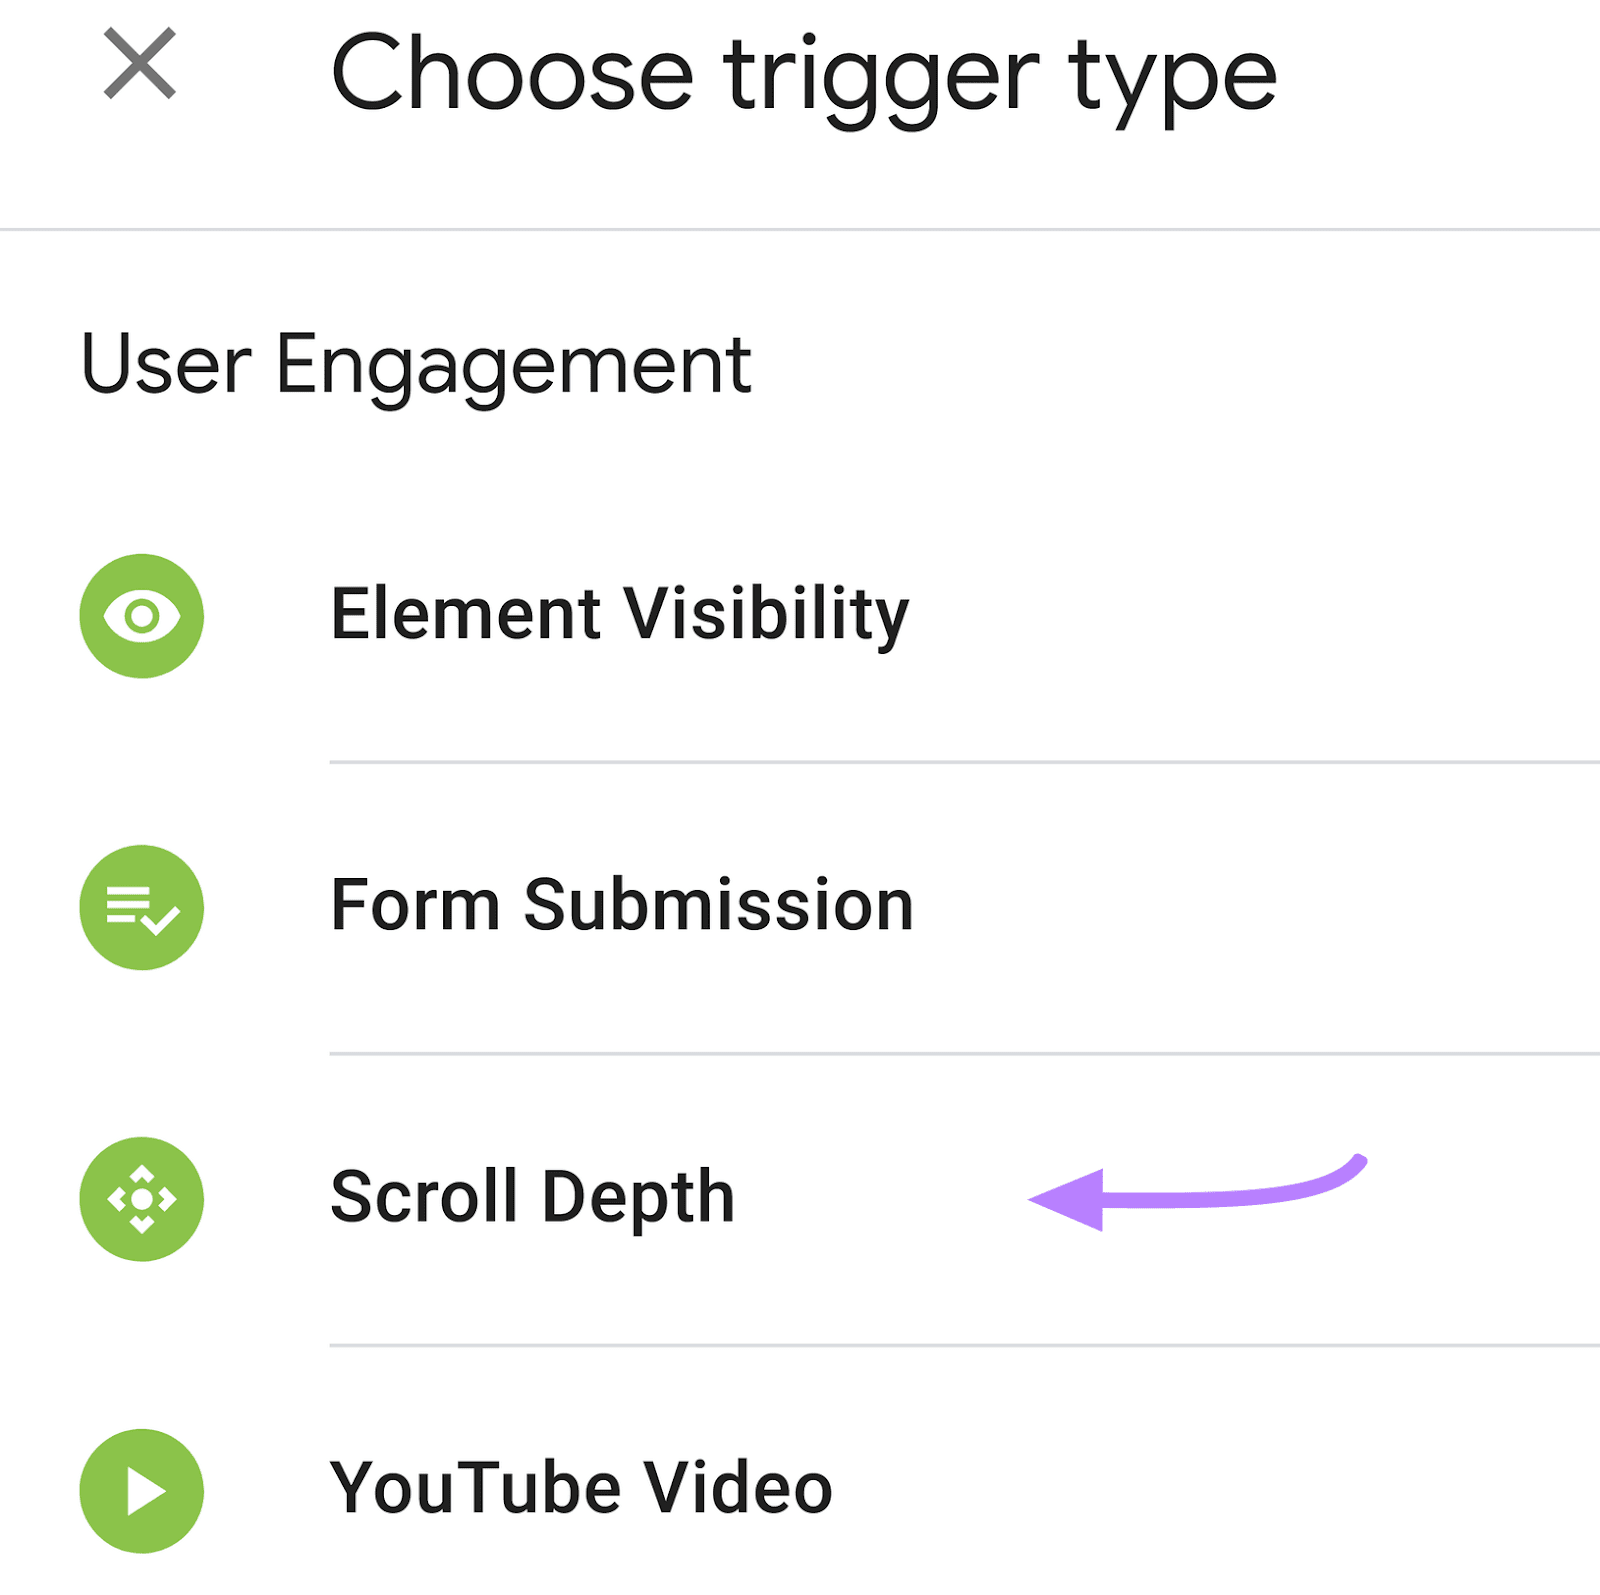
You’ll see a variety of trigger types to choose from. Select “Scroll Depth” from the list, under “User Engagement.”
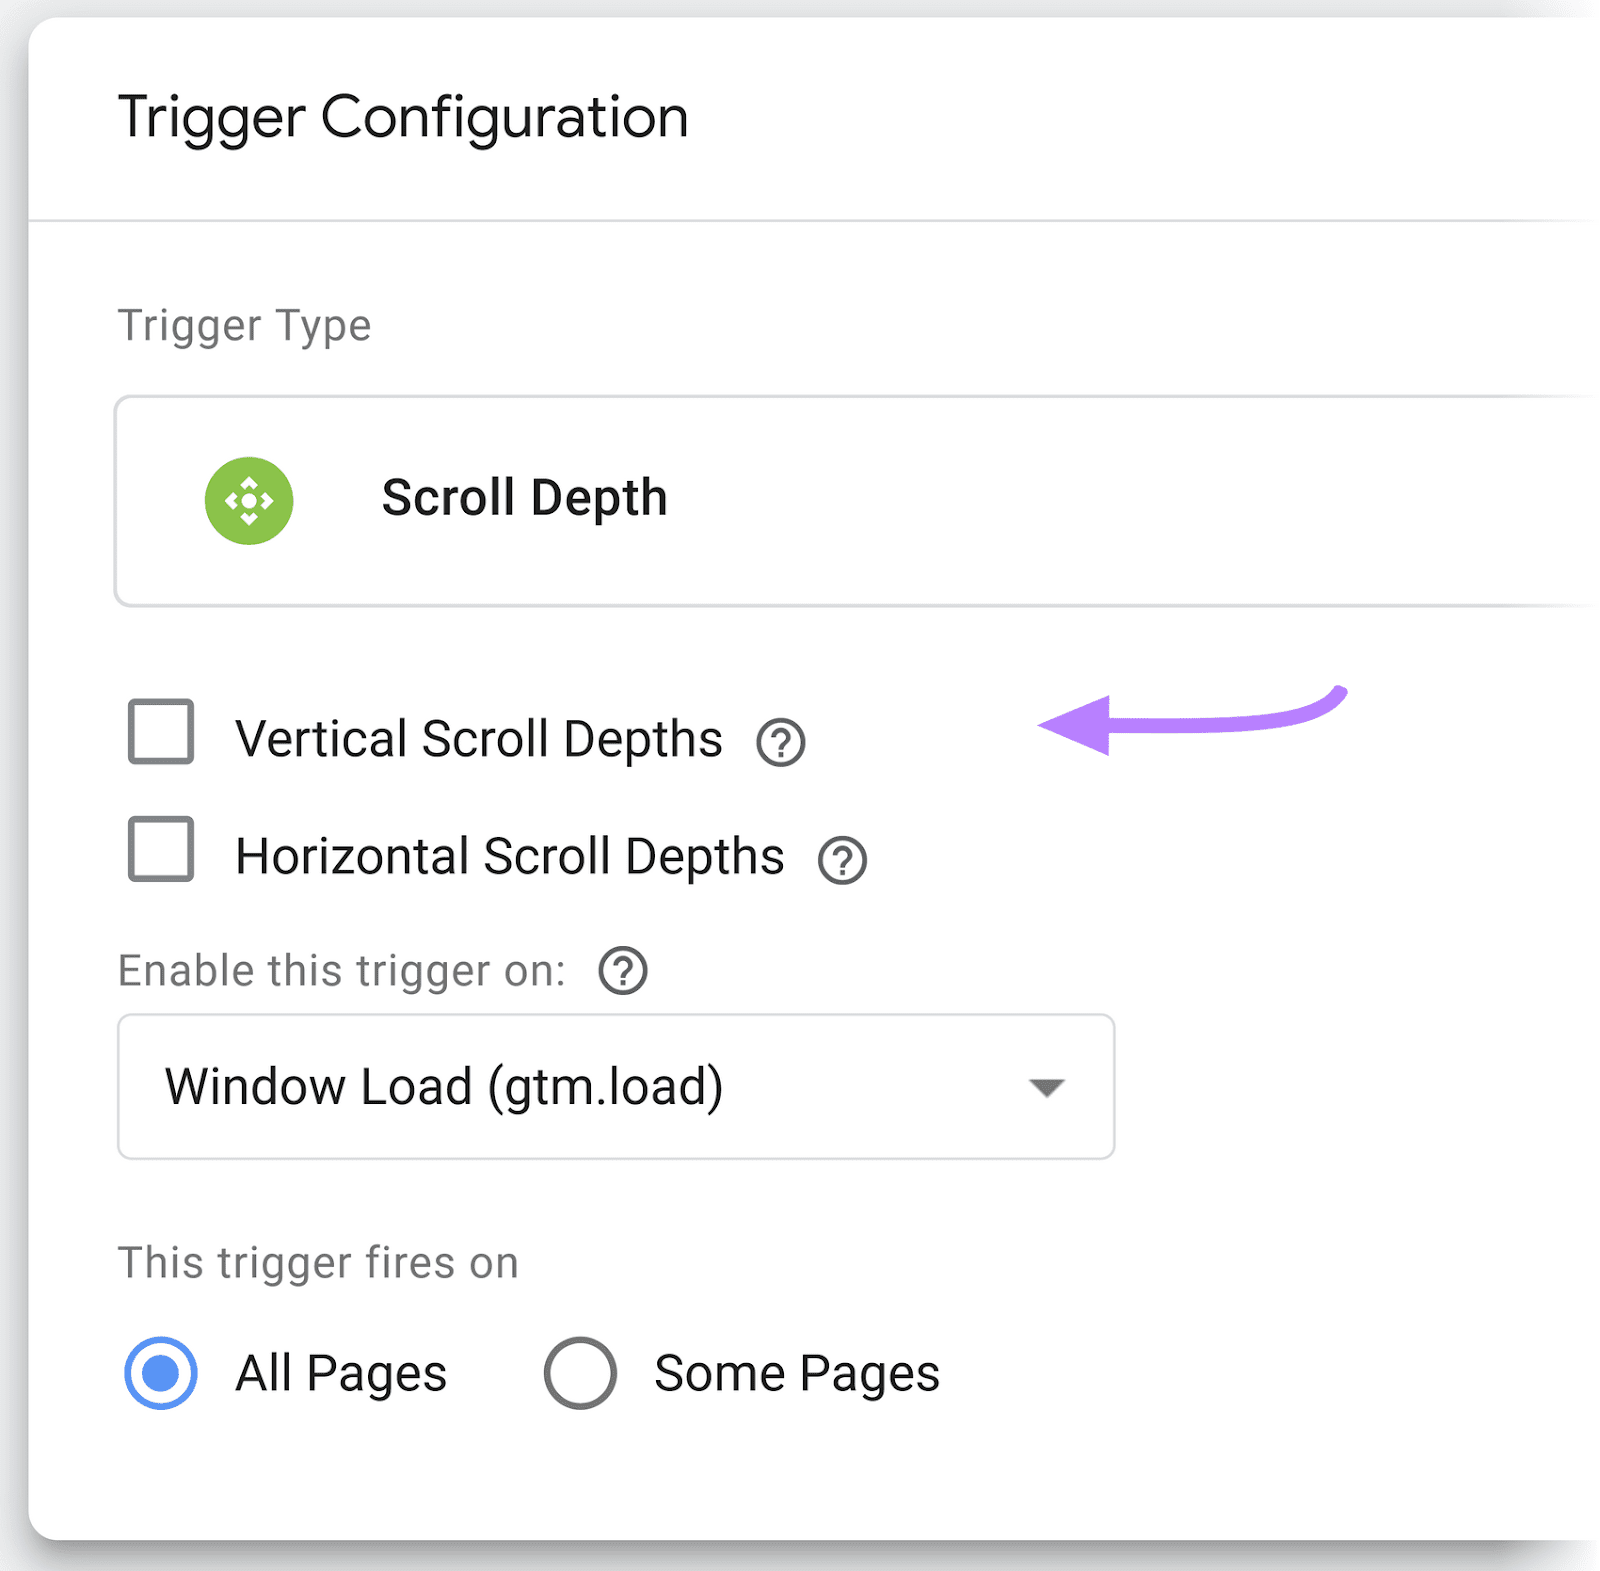
You can now configure your scroll depth trigger with the specific thresholds you want to track. You probably want to track vertical scroll activity, so check the box next to “Vertical Scroll Depths.”
You can now enter the specific percentage or percentages to track. To track scroll depth at 10%, 25%, 50%, 75%, and 90% type 10, 25, 50, 75, 90 like below. Then click “Save.”
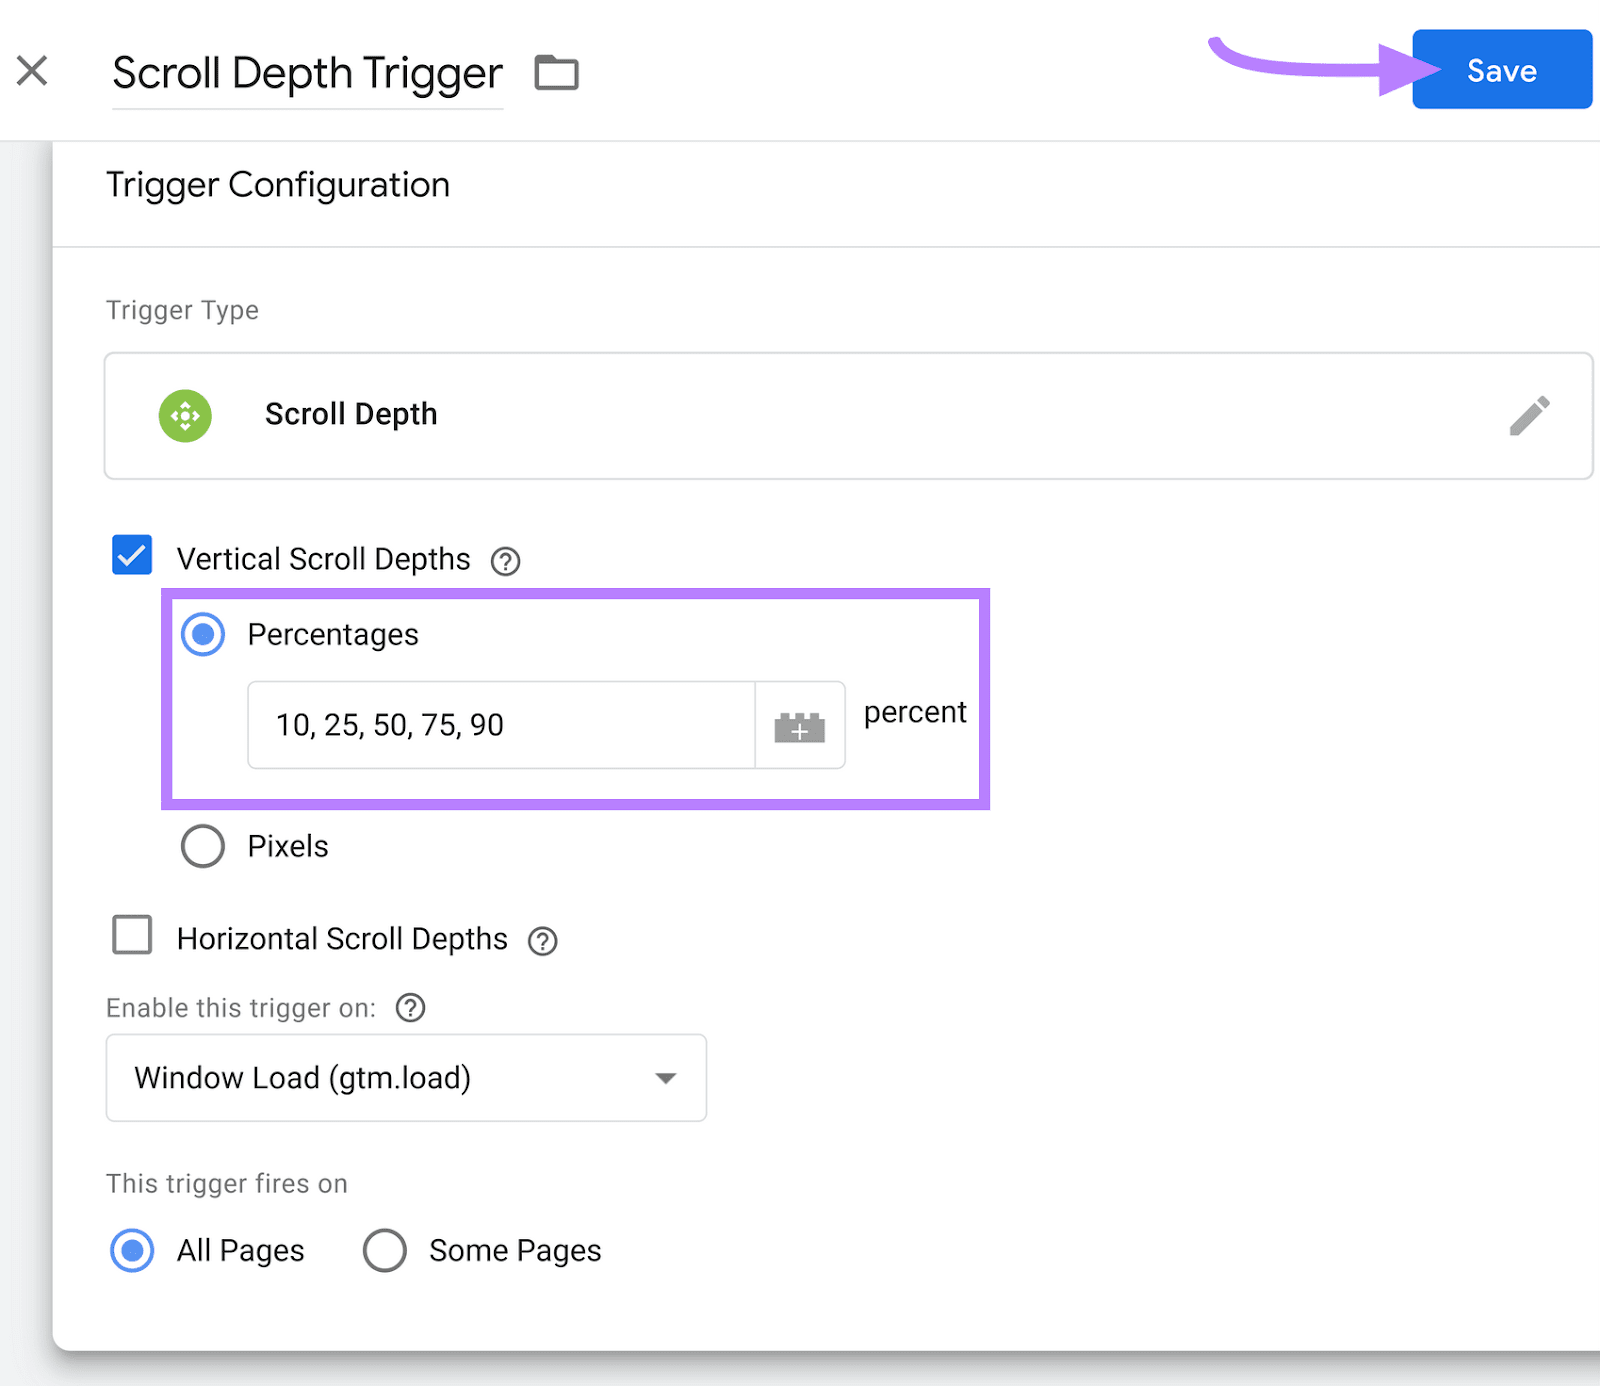
Your new trigger will help create scroll data once you pair it with a corresponding tag and you publish all your changes.
Let’s now create the tag that you’ll pair with your trigger.
How to Create Your Scroll Depth Tag
Click on “Tags” from the left-hand navigation.
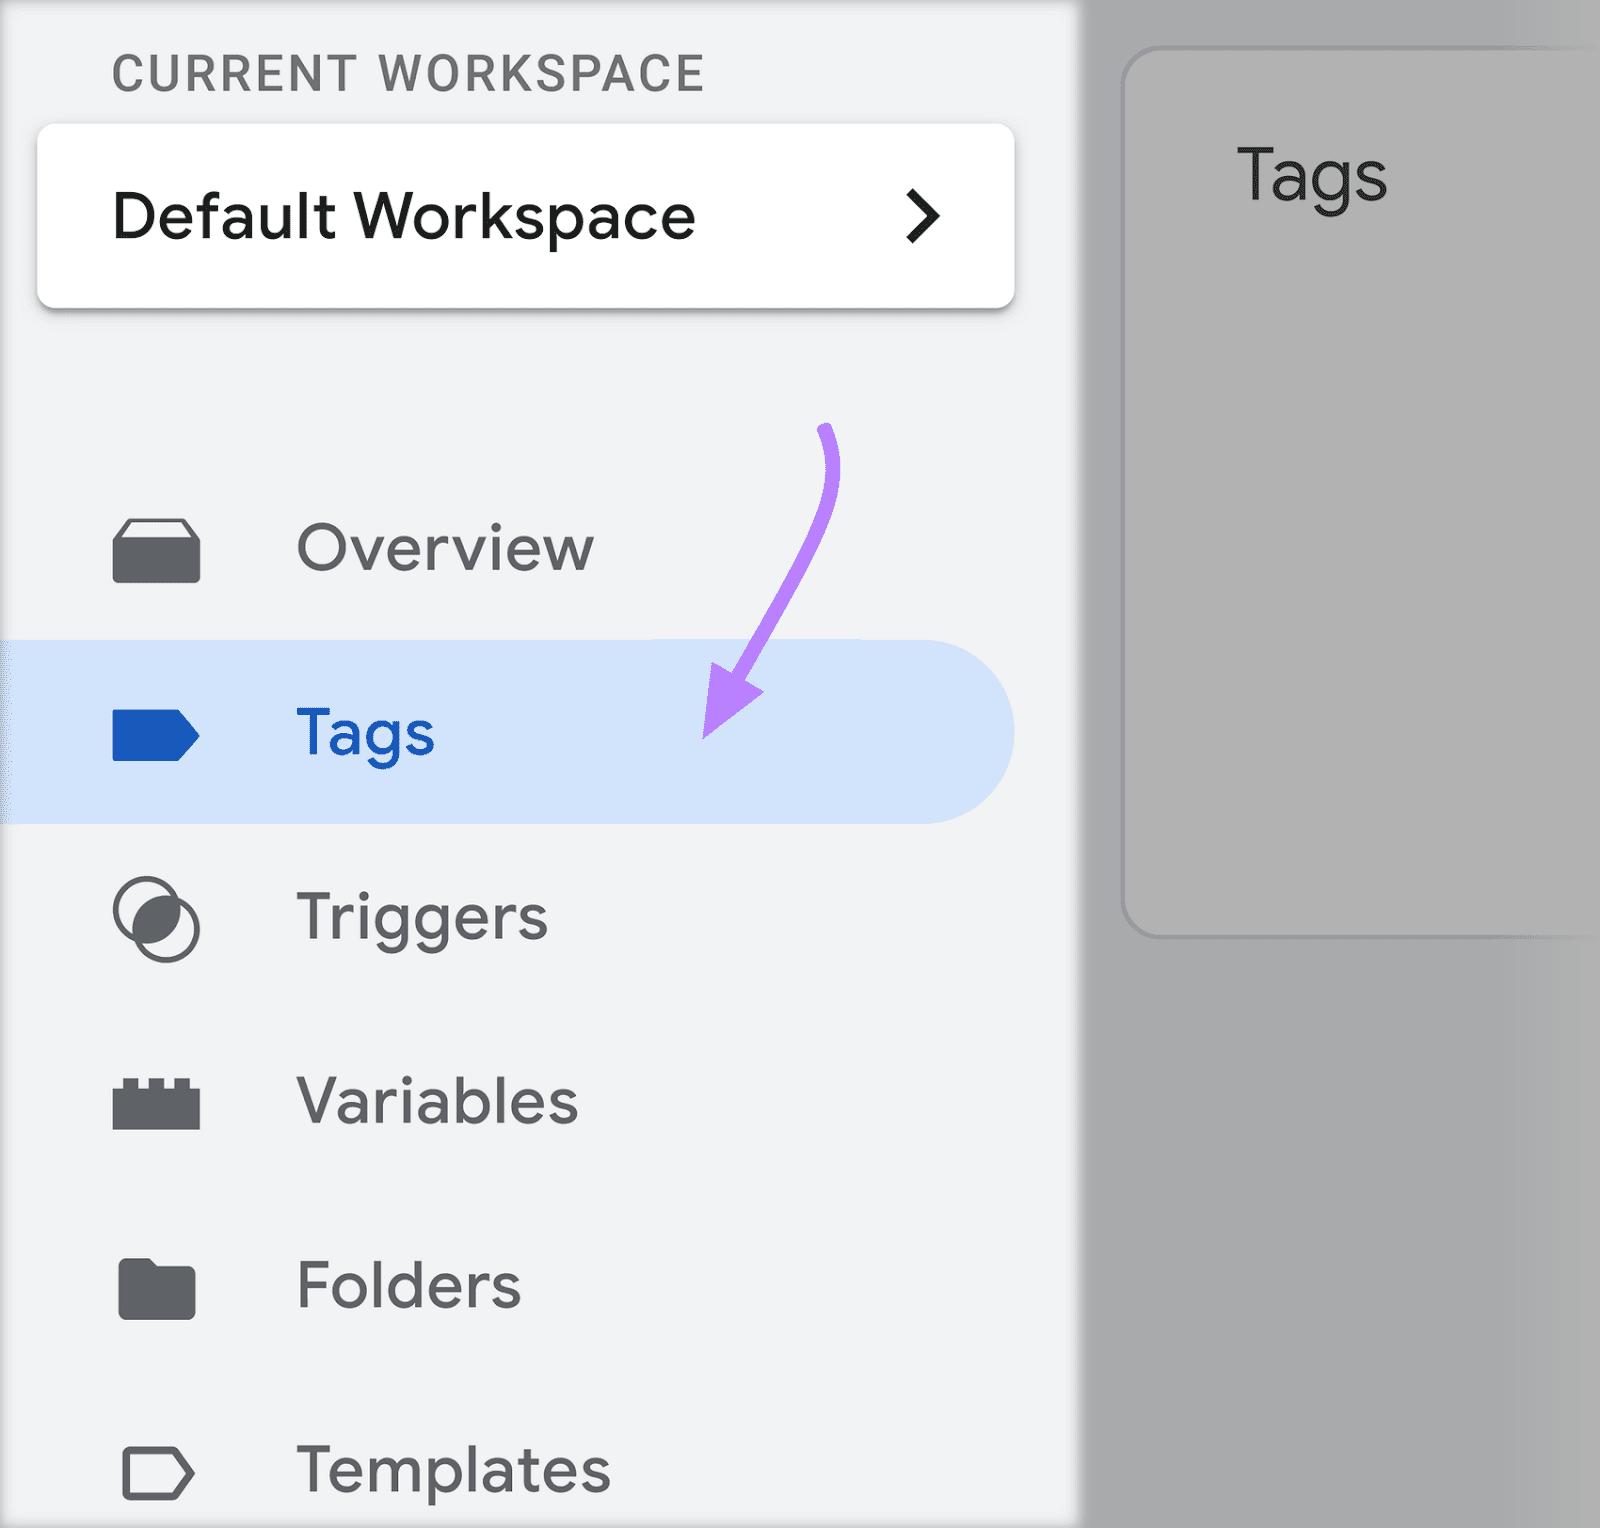
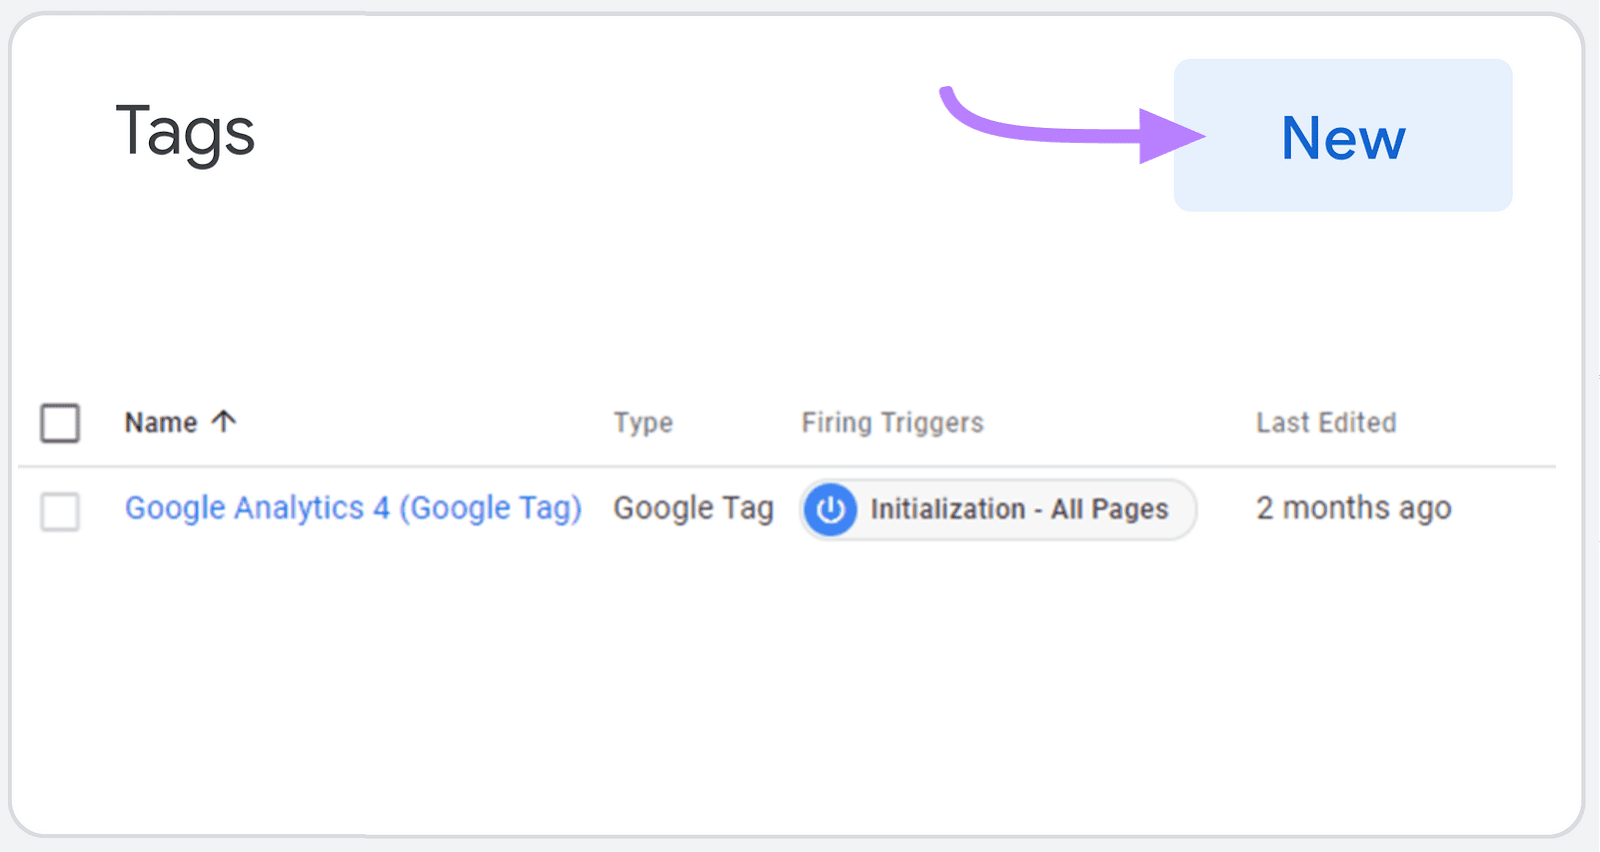
You’ll see a list of any tags that already exist in your container. The image below shows a container that has a single tag that was used to set up Google Analytics 4.
Click “New” to create another tag.
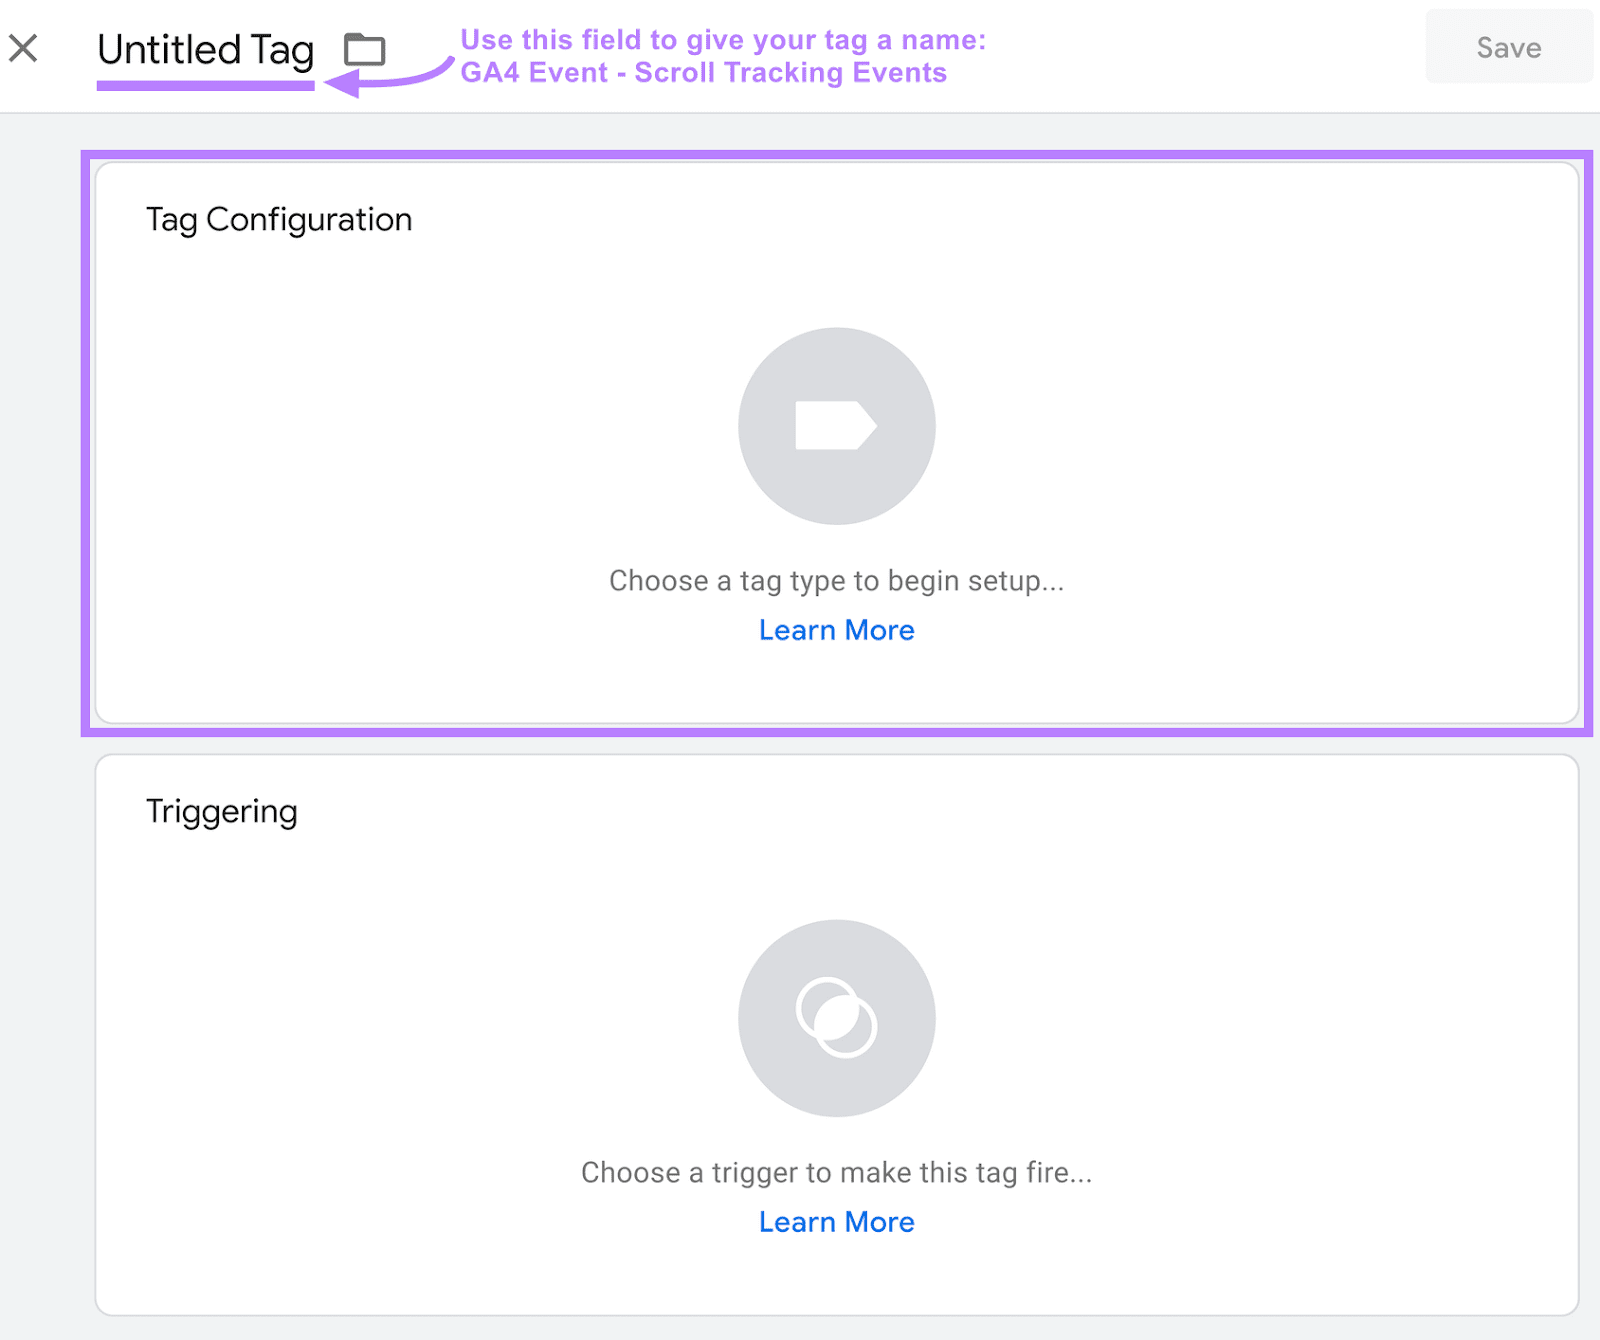
Give your tag a name as shown below. Then, click anywhere in the “Tag Configuration” area.
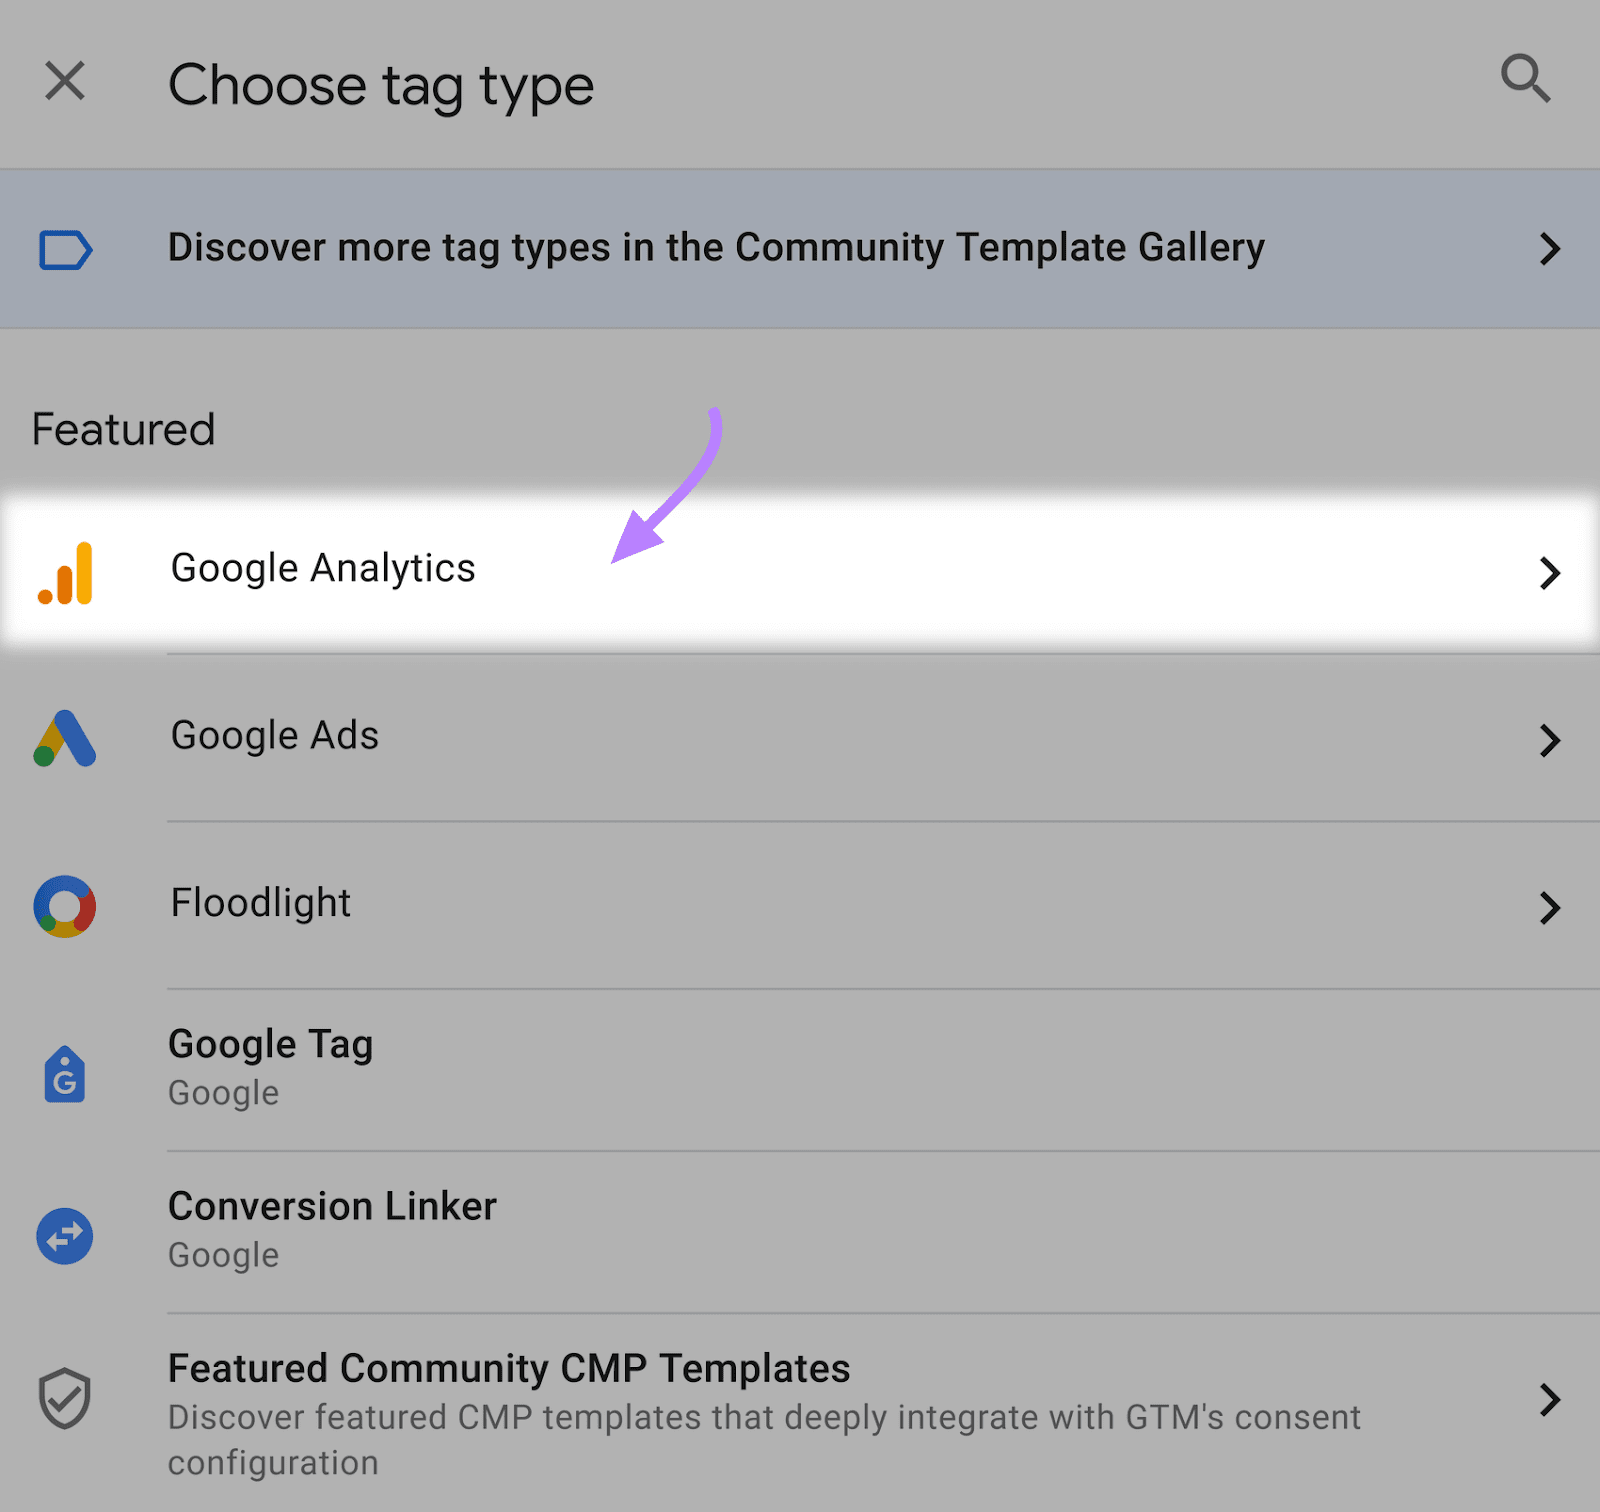
You’ll see a list with multiple tag types to choose from. Select “Google Analytics” from the top of the list to see a list of Google Analytics options.
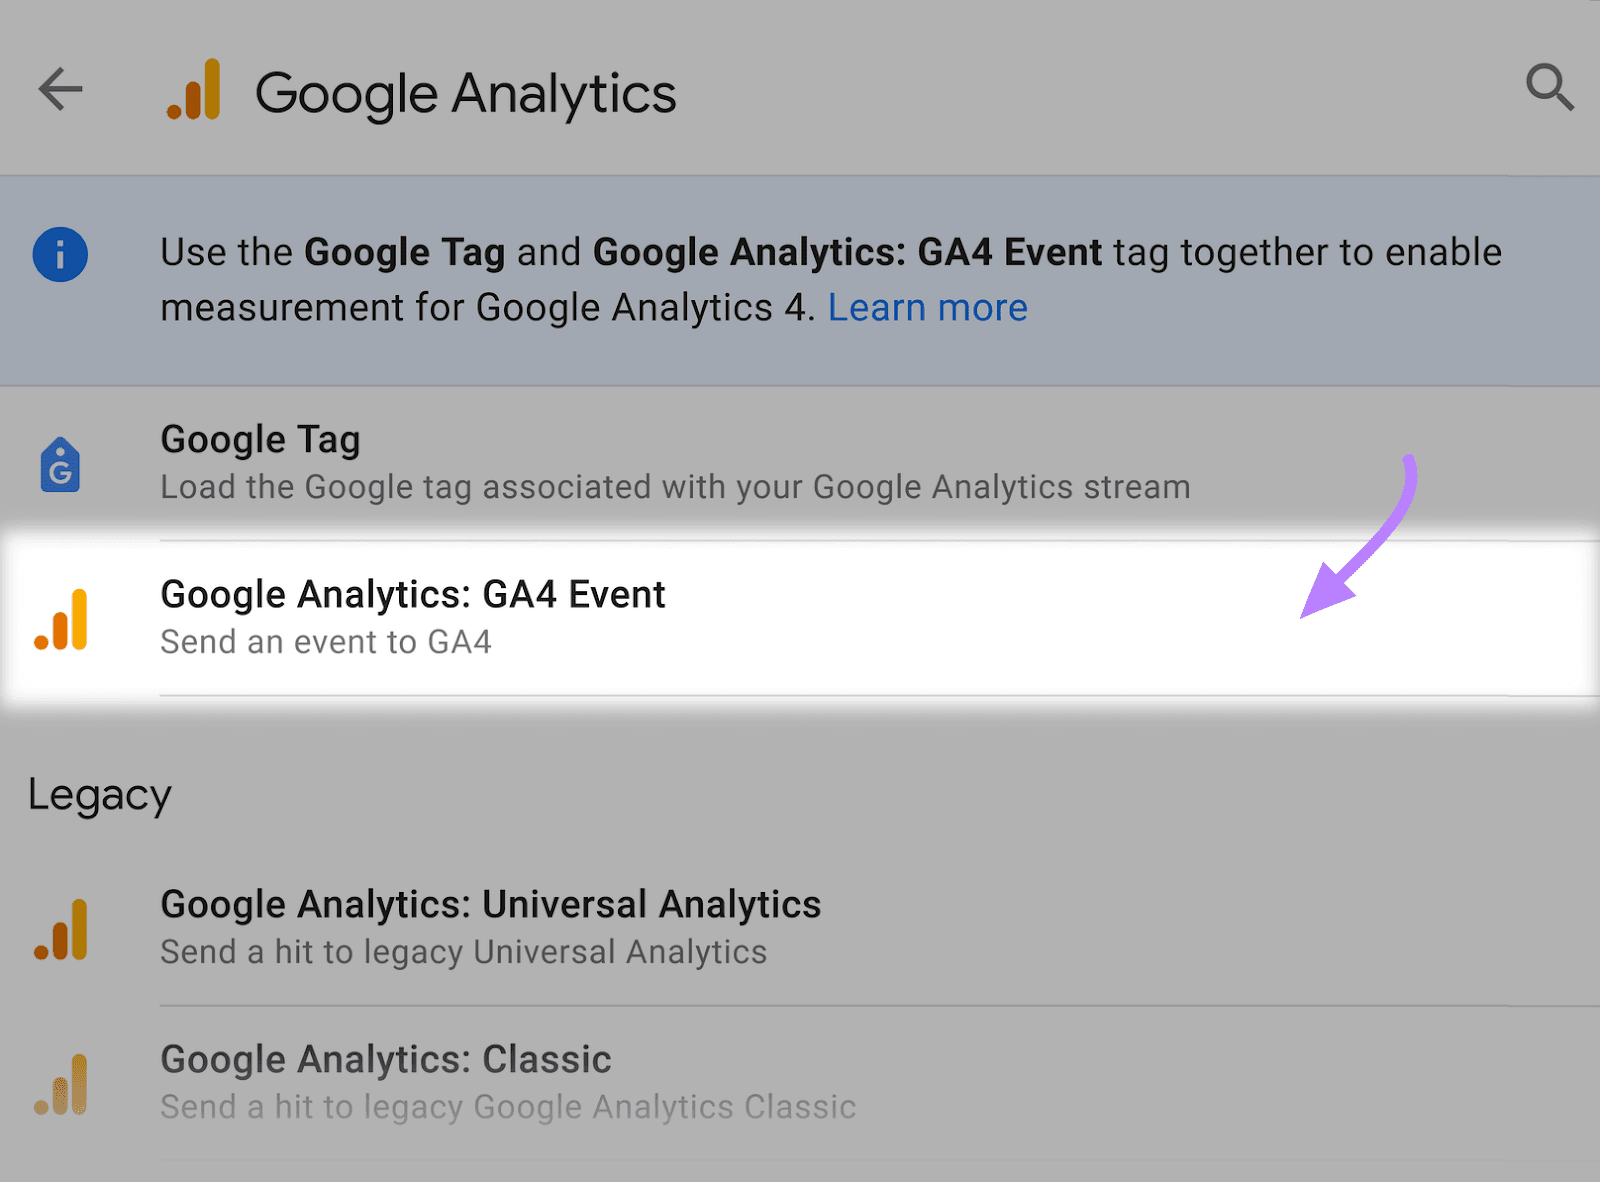
Choose “Google Analytics: GA4 Event” from the list.
You’ll now set up your tag configuration. Your tag already has a name but it needs a Measurement ID and an Event Name.
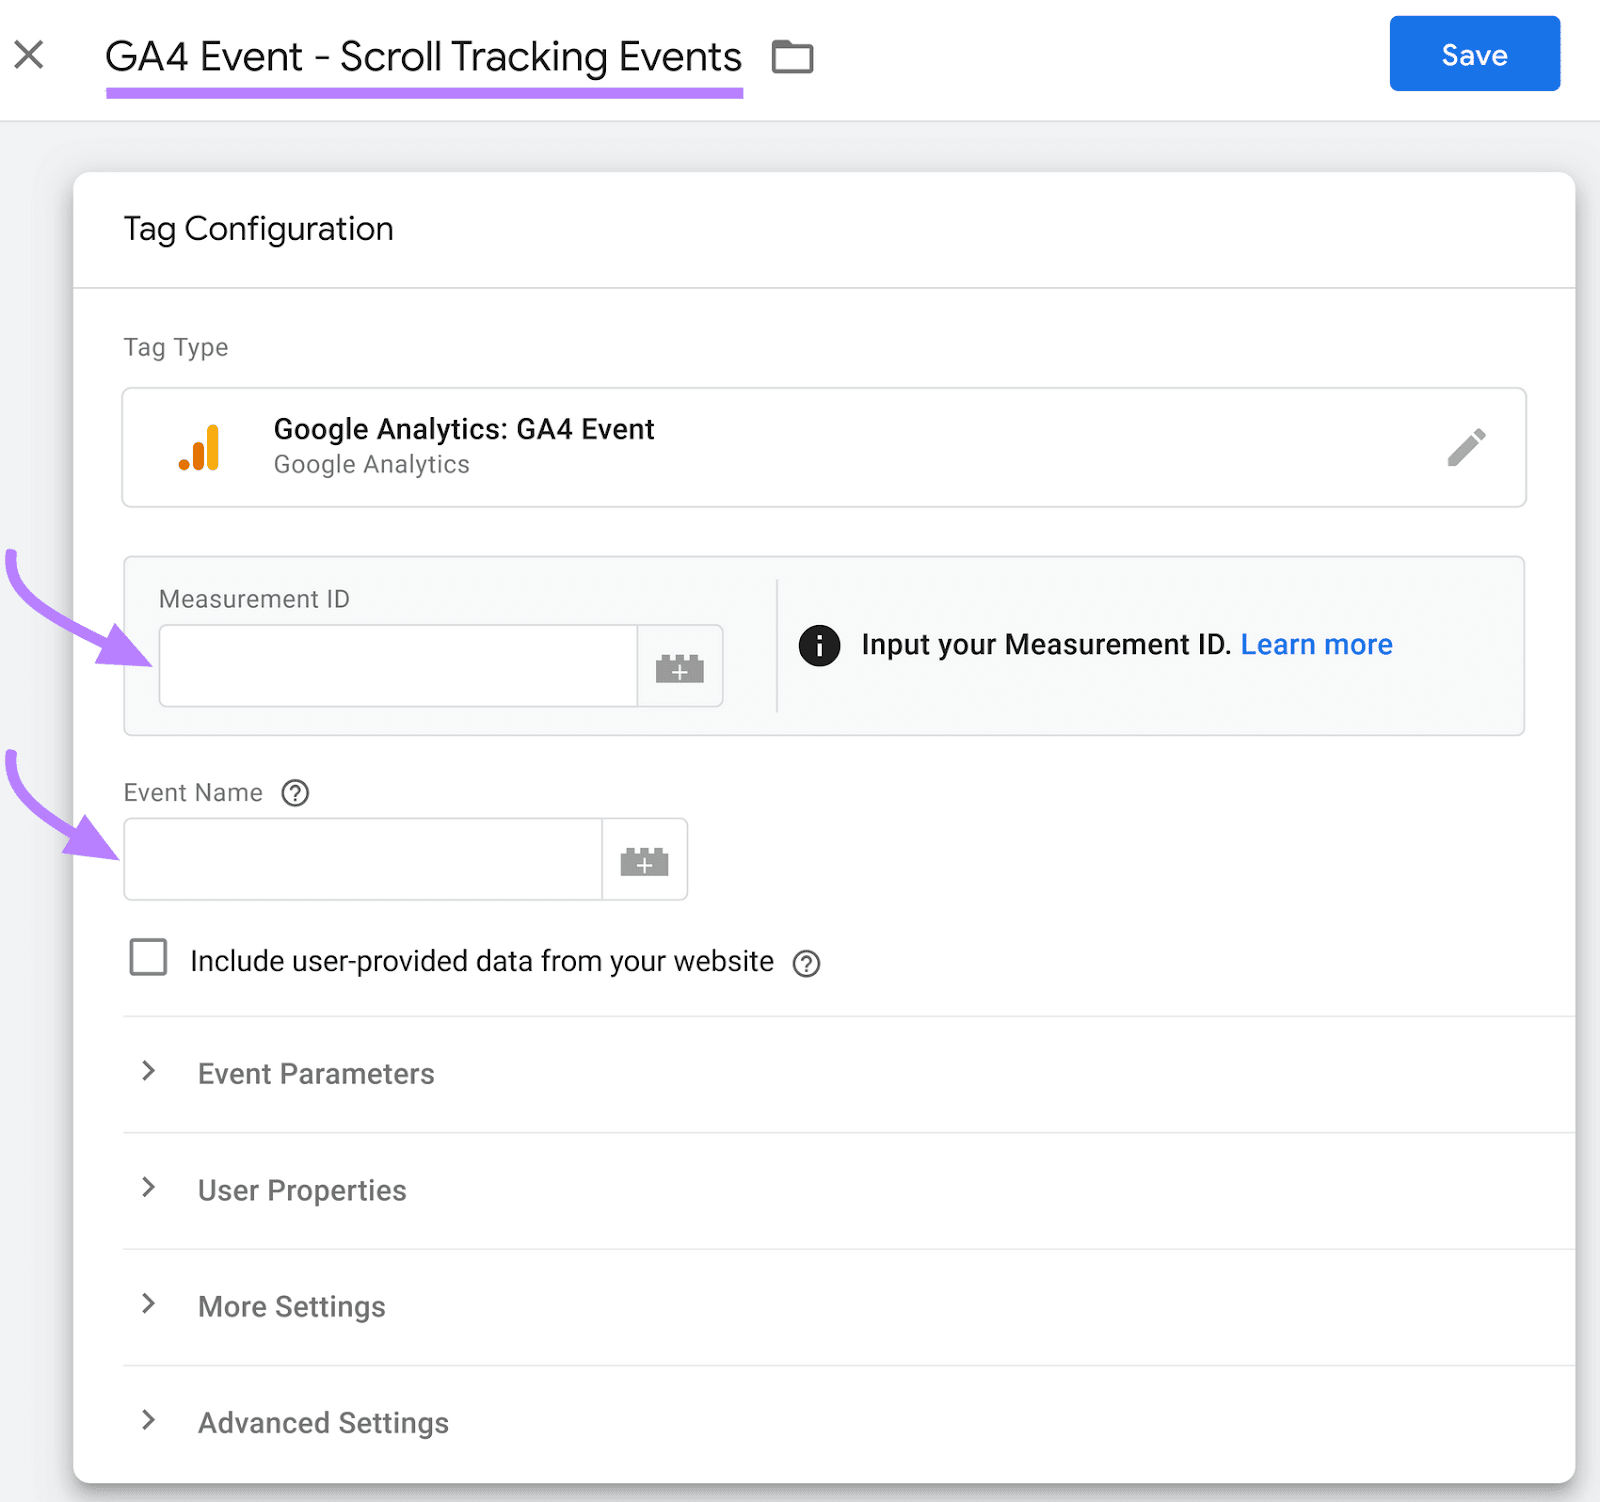
The Measurement ID is also known as your Google Analytics tracking ID. You can find it in the Admin section of your Google Analytics property for that website.
So let’s temporarily head to Google Analytics and click the gear icon in the bottom left to access the Admin section.
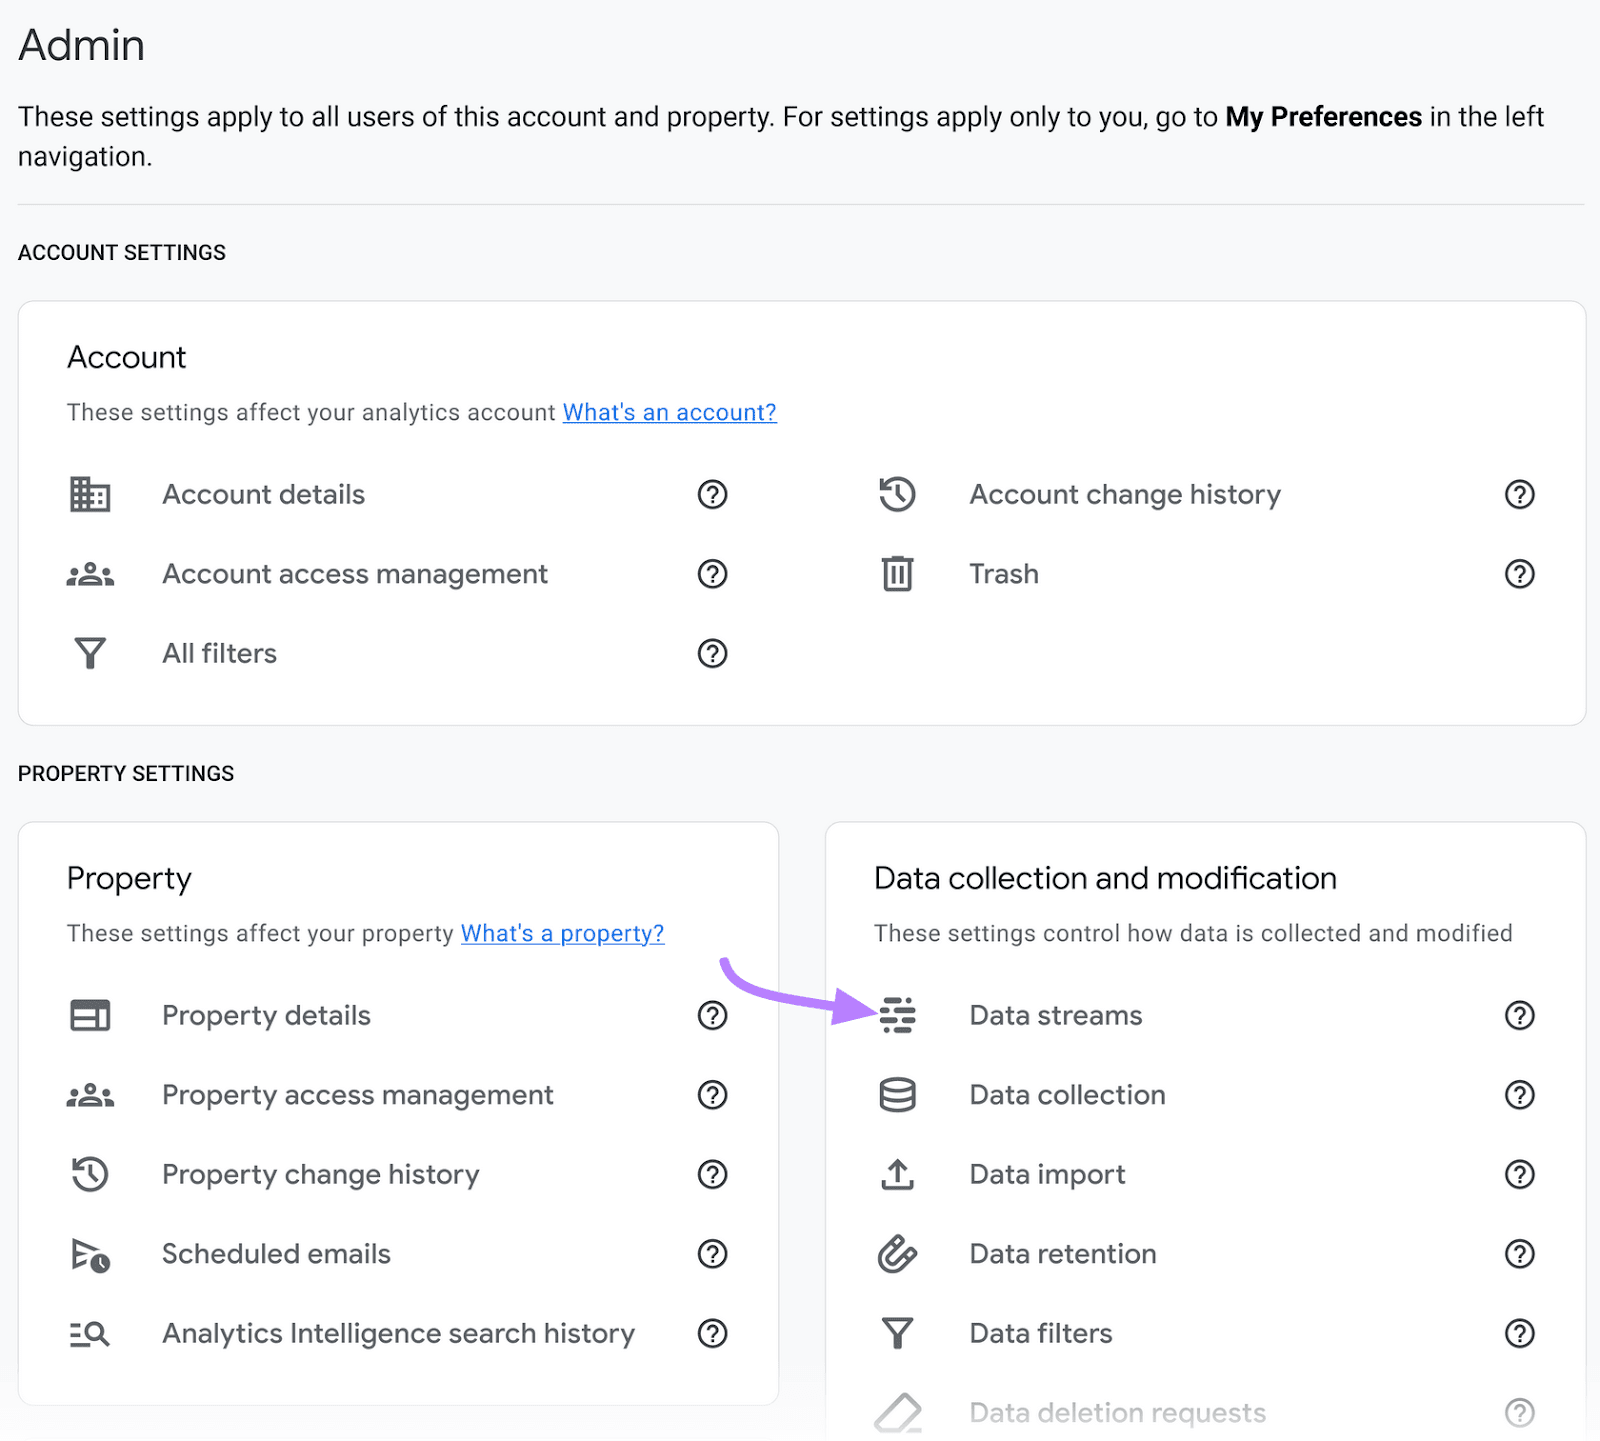
Then, click “Data streams.”
Choose the relevant data stream from the list.
If you have multiple streams because you’re tracking both website and app traffic, make sure you click on the web data stream.
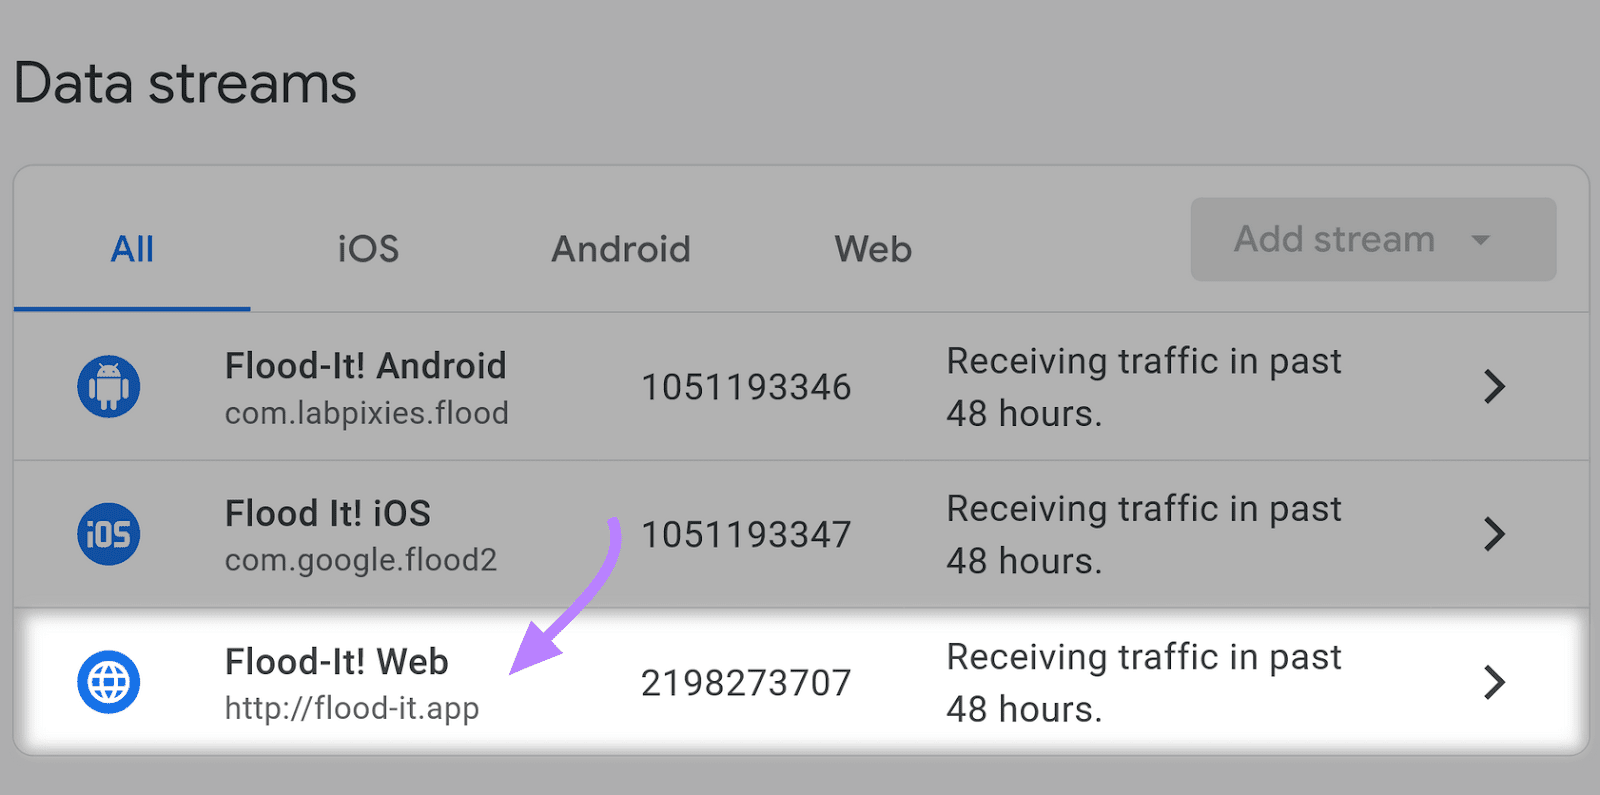
Now, copy the Measurement ID.
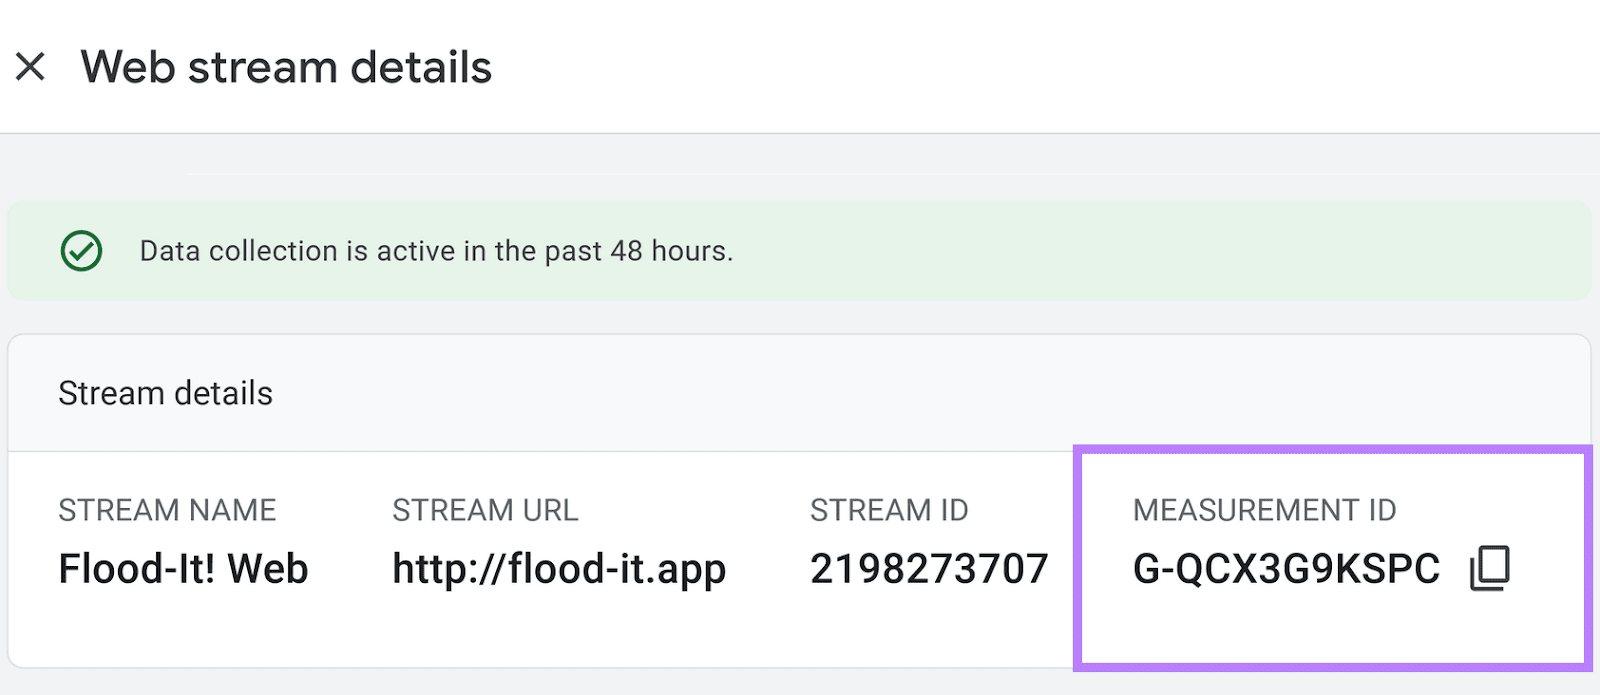
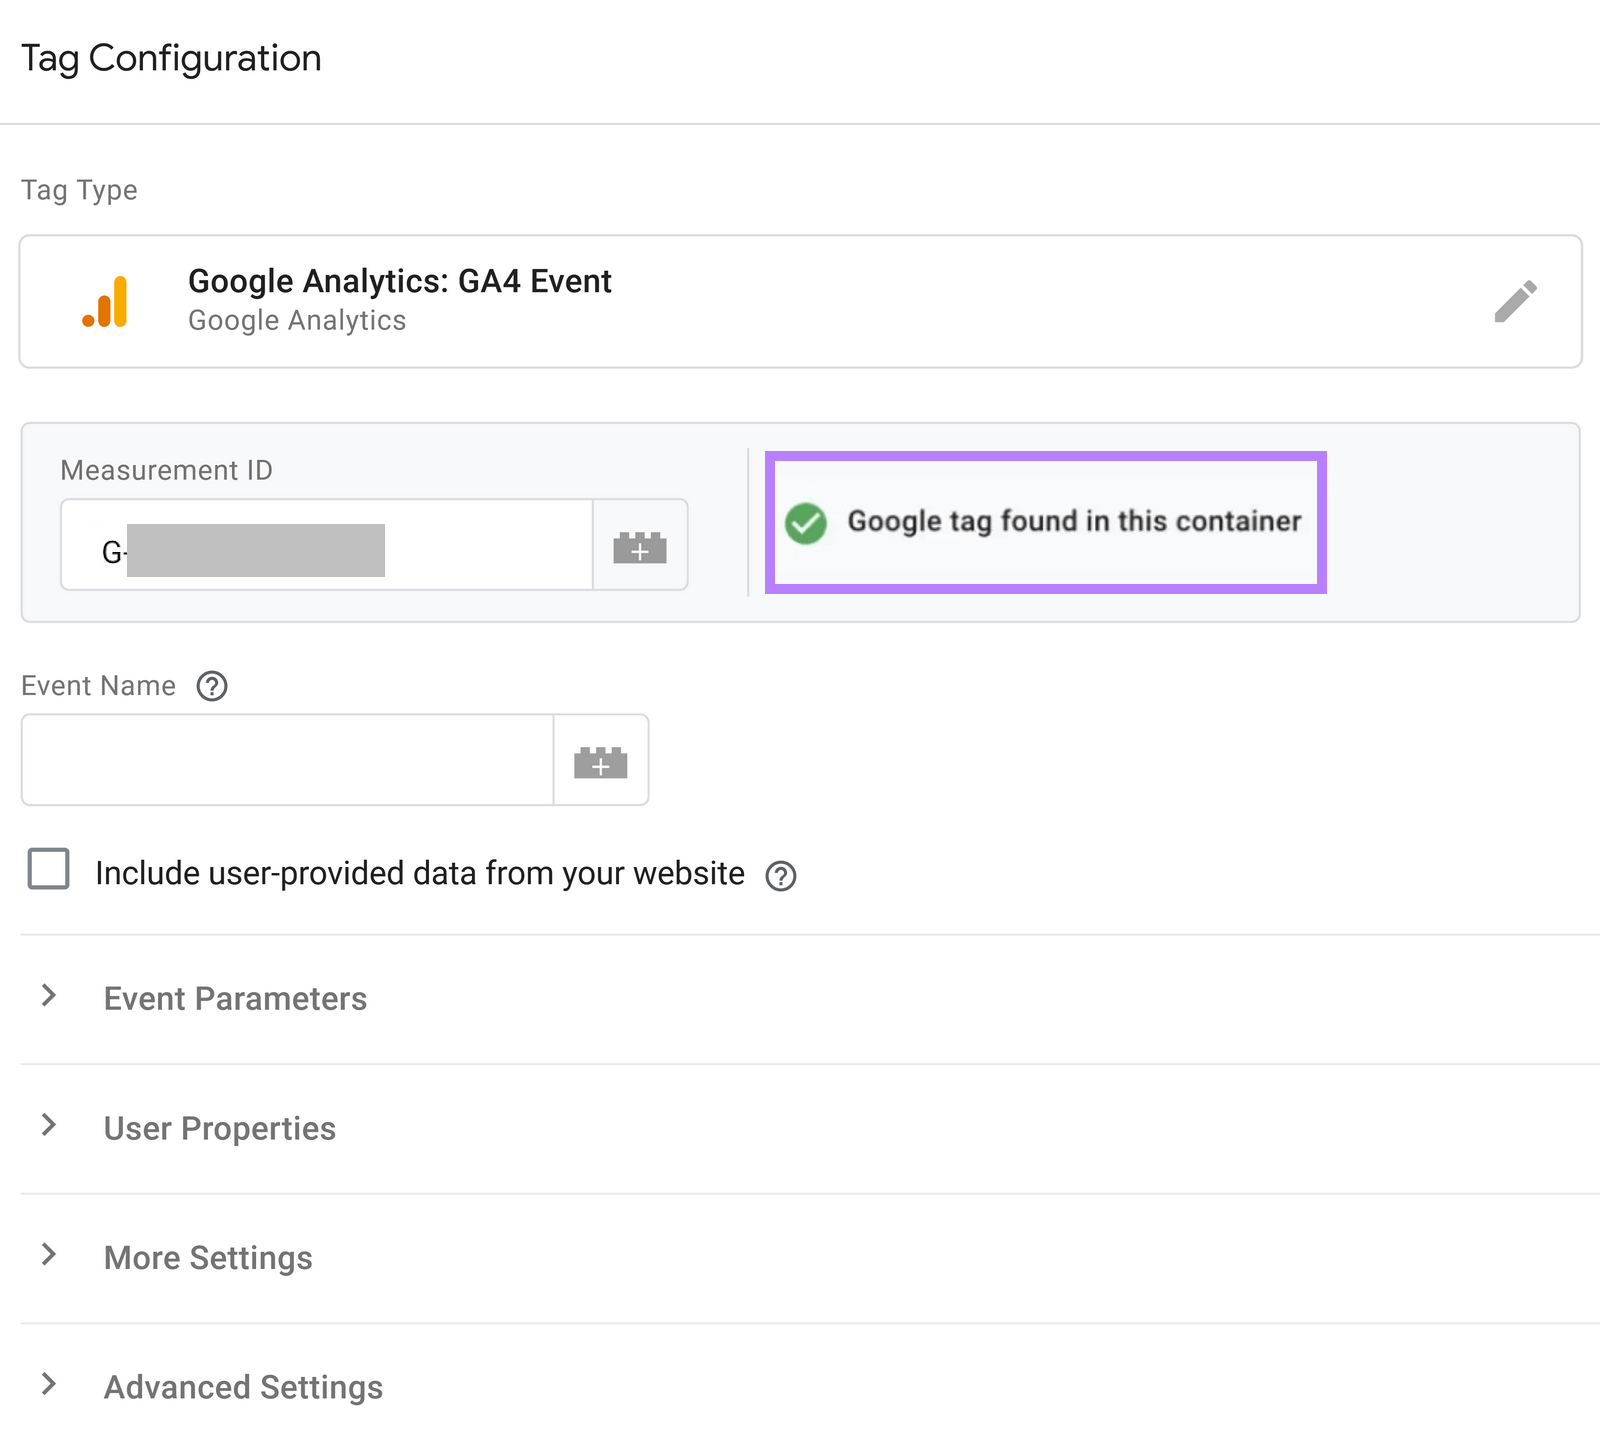
Now, head back to GTM. Paste in your Measurement ID as shown below. If you have used your Google Tag Manager container code to install GA4 on your site, you’ll see a green check mark and a message saying “Google tag found in this container.”
Let’s now create the “Event Name.” The “Event Name” is what will show up in your Google Analytics reports when the tag fires. We will create multiple events that will fire at each of the vertical thresholds you set in your trigger. And we’ll use a variable to help.
Begin by typing “scroll_to_{{” in the Event Name field. The curly brackets tell GTM you’re going to insert a variable.
Select “{{Scroll Depth Threshold}}” when it’s visible on screen. (If it disappears or you don’t see it, just start typing “Scroll” after the curly brackets.)
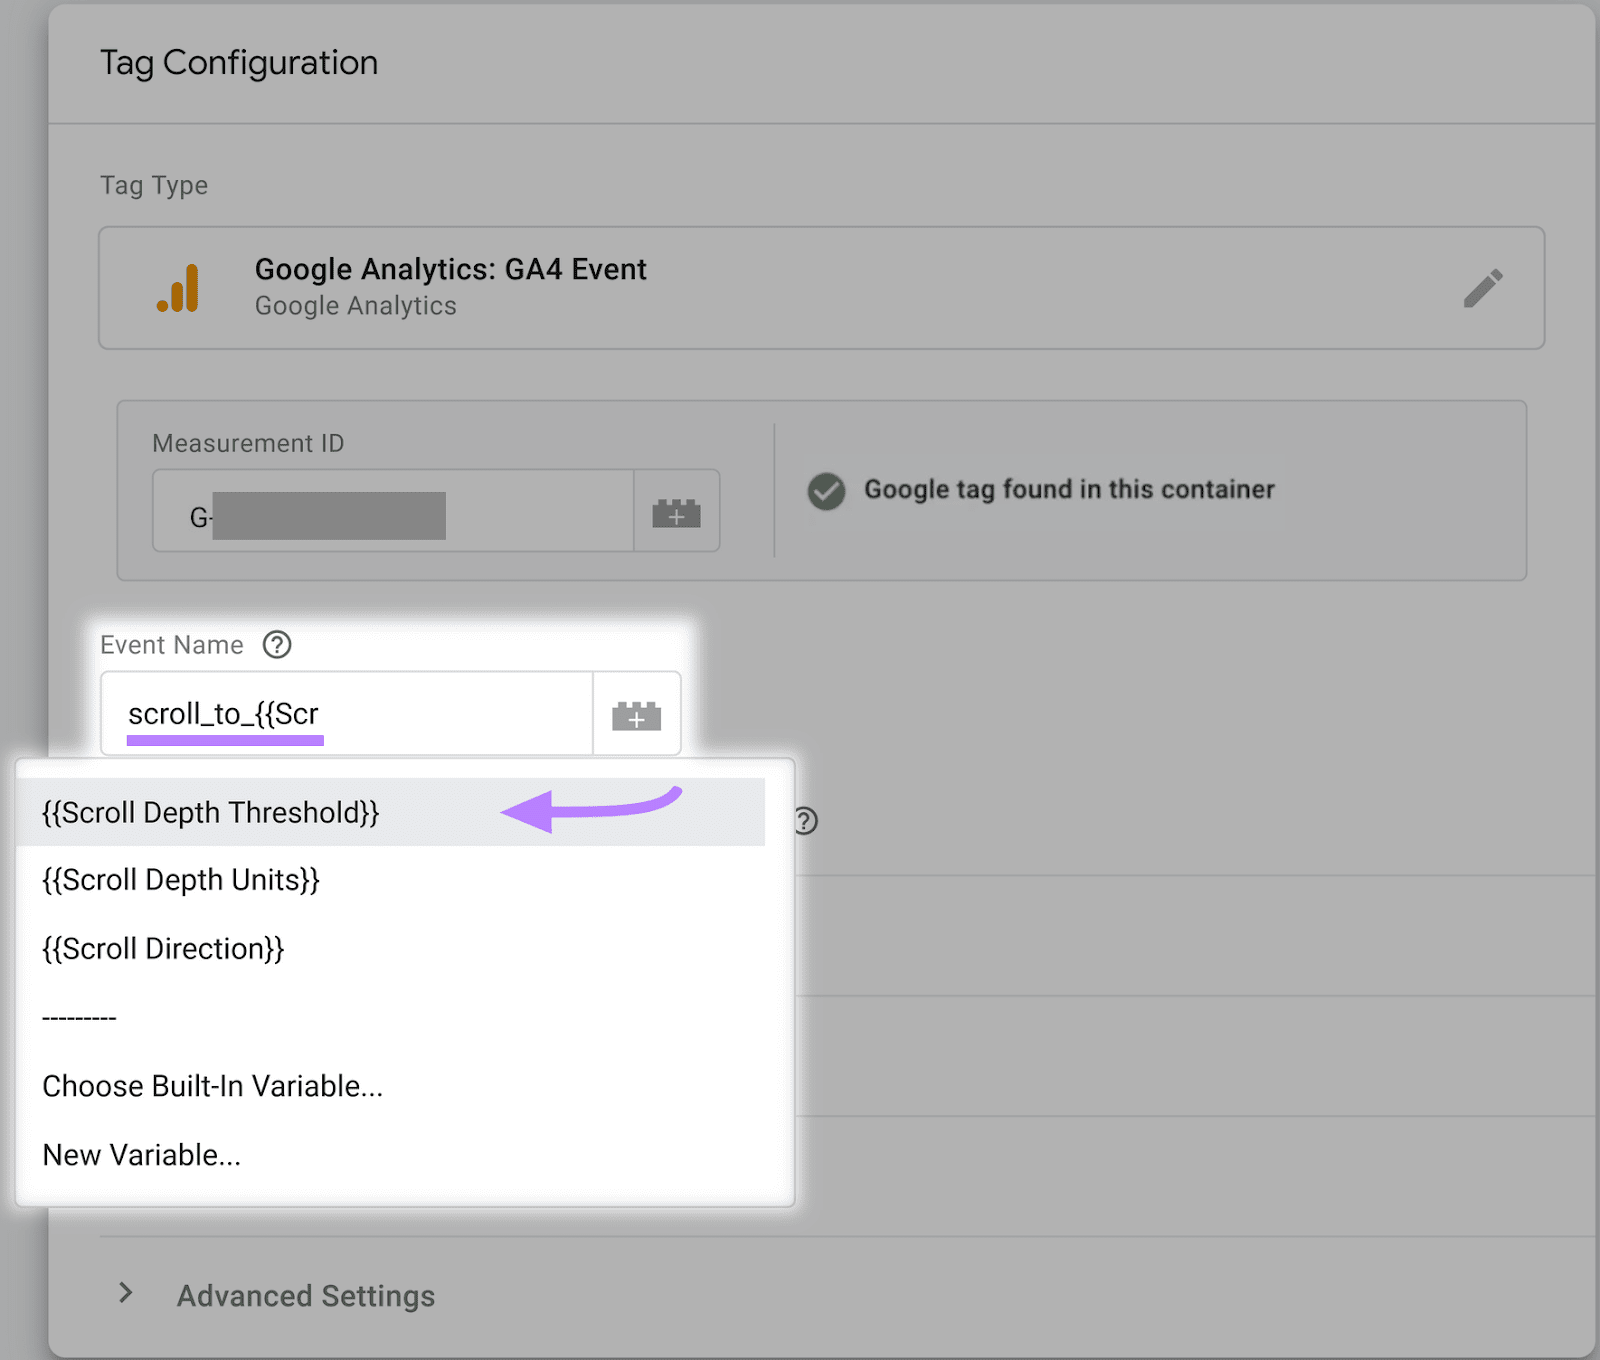
If you’ve configured your trigger as outlined here, you’ll be creating the following new events using this single tag:
- scroll_to_10
- scroll_to_25
- scroll_to_50
- scroll_to_75
- scroll_to_90
Now, click in the “Triggering” area below your tag.
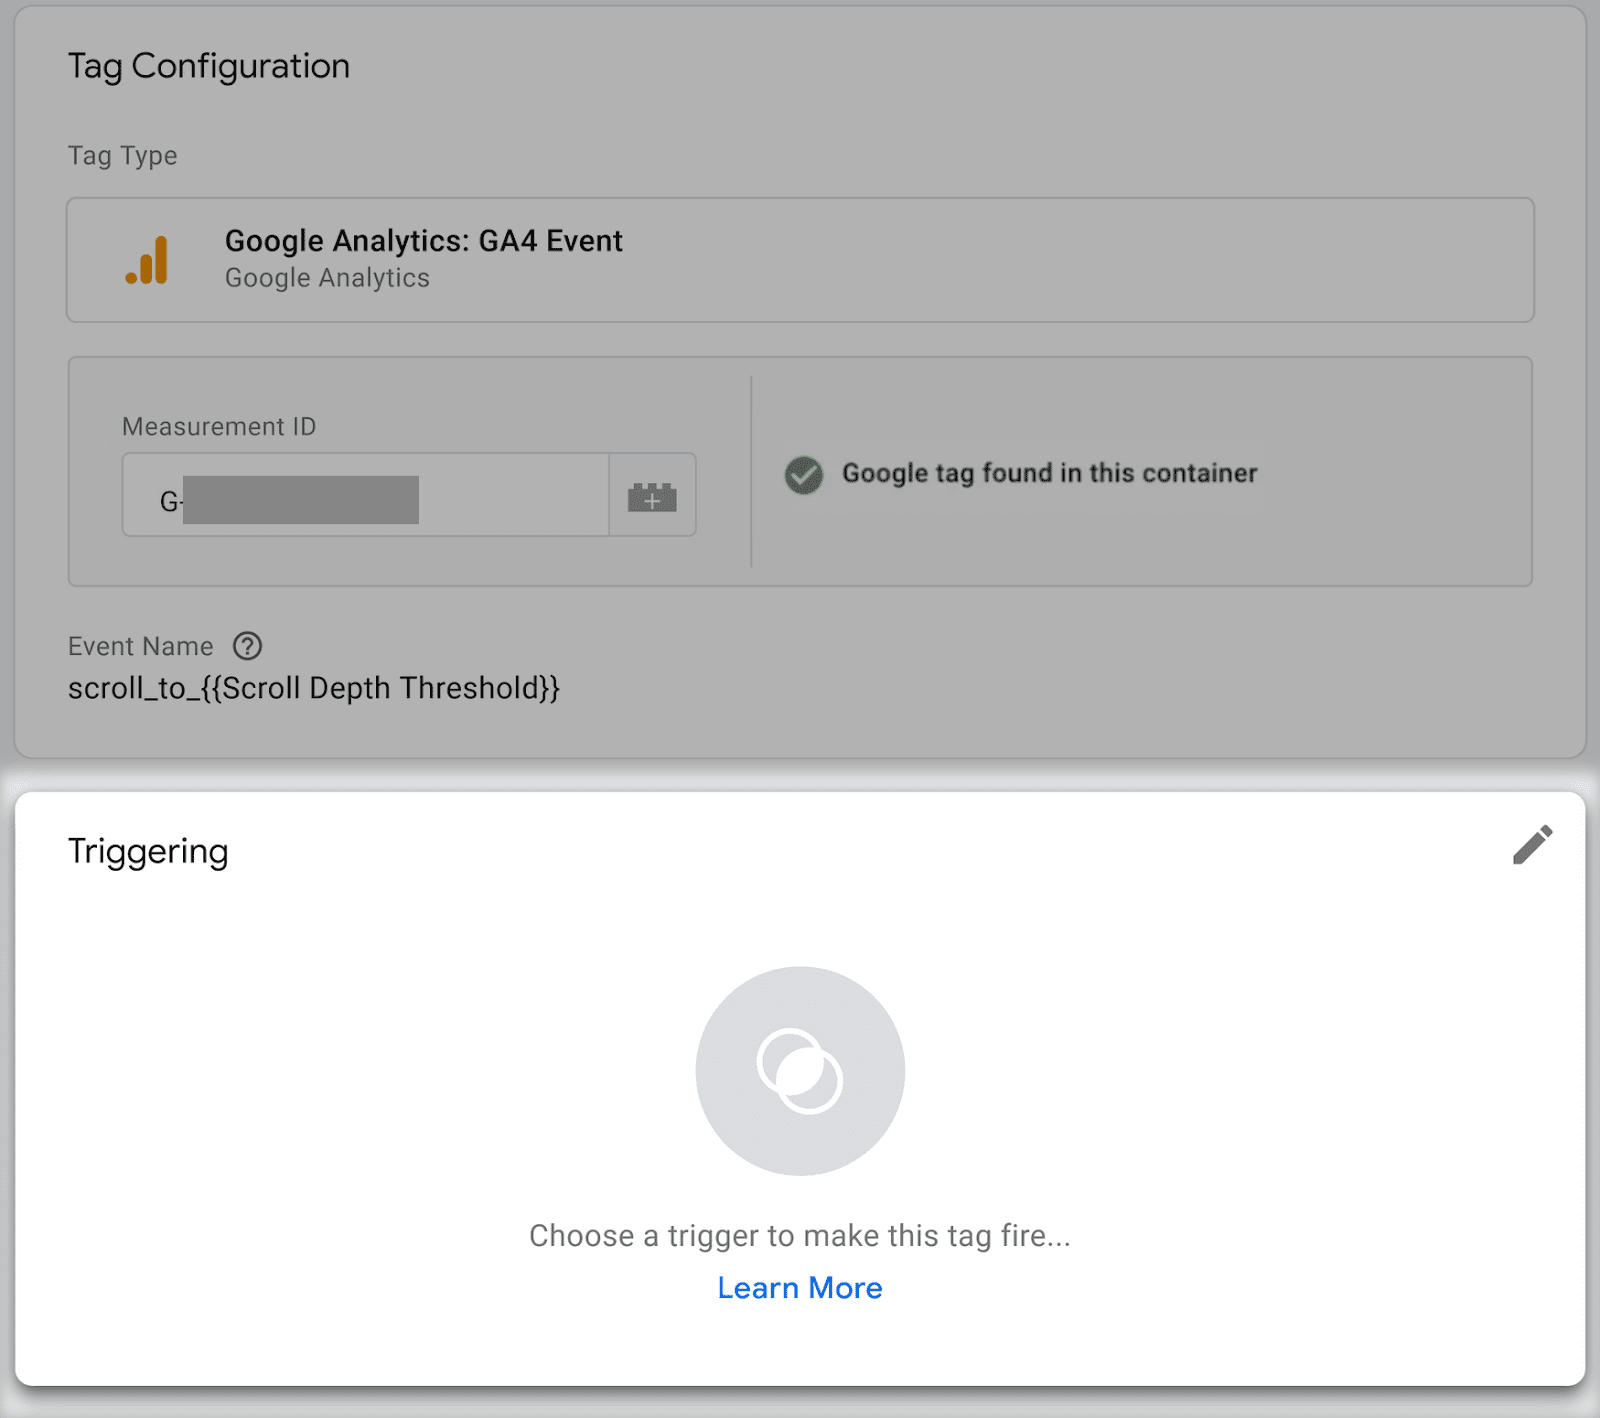
You’ll see a list of all available triggers, including the scroll depth trigger you’ve already created. Choose it from the list.
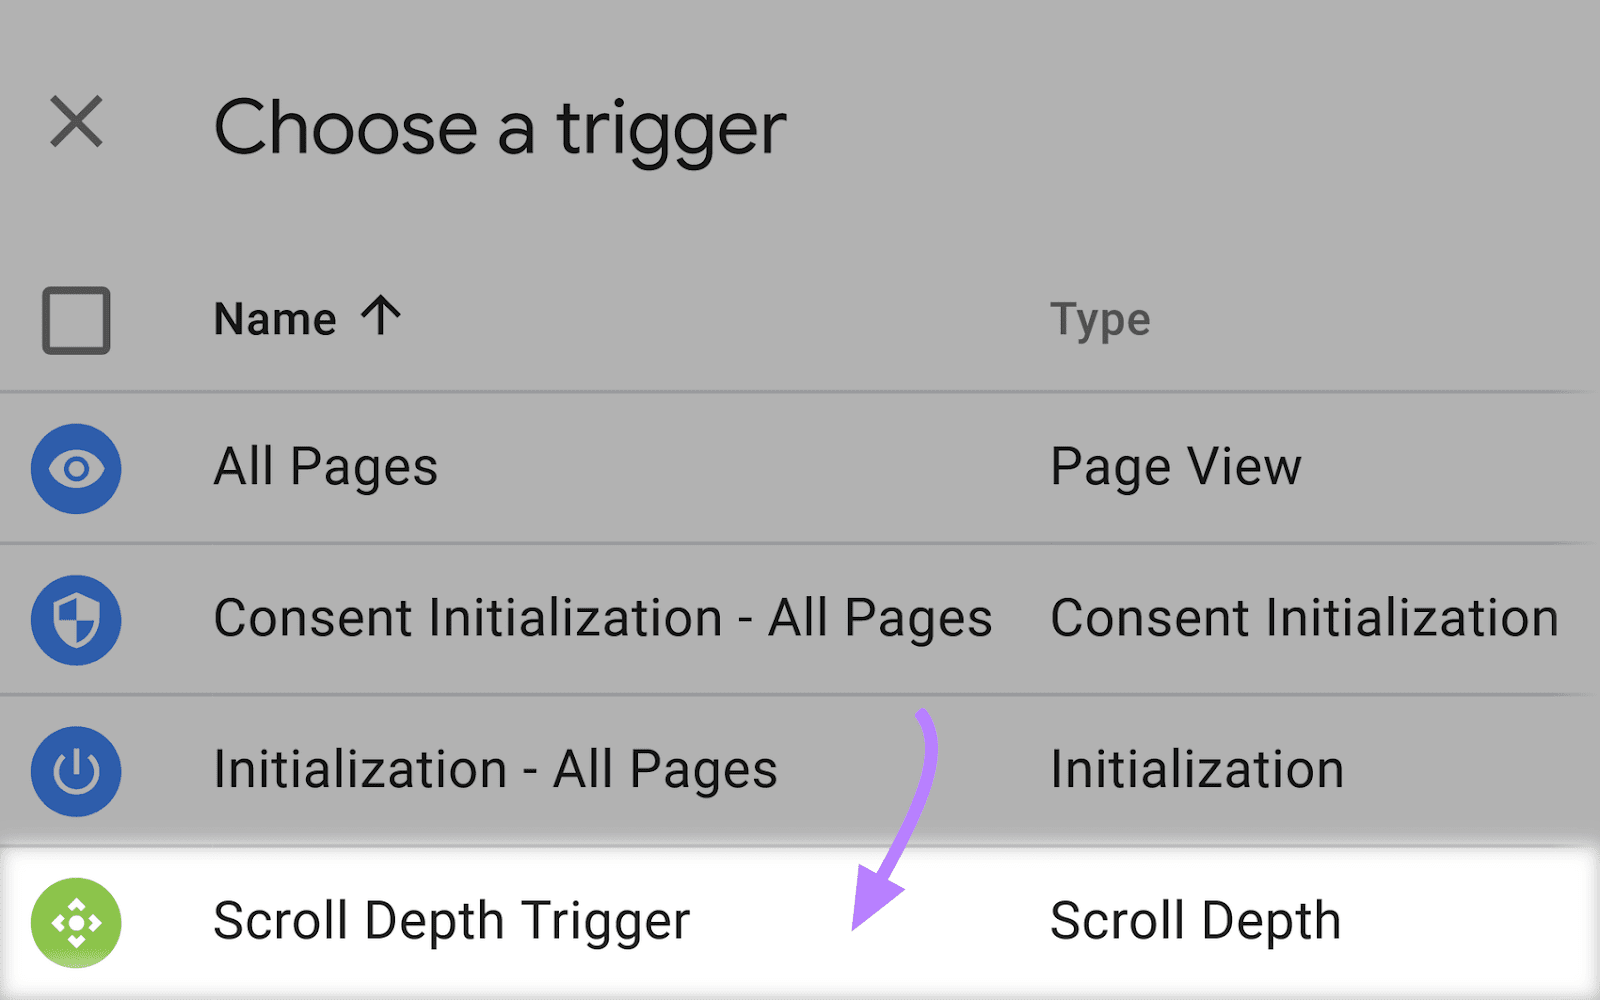
You’ve now paired your GA4 event tag with your scroll depth trigger. Click “Save.”
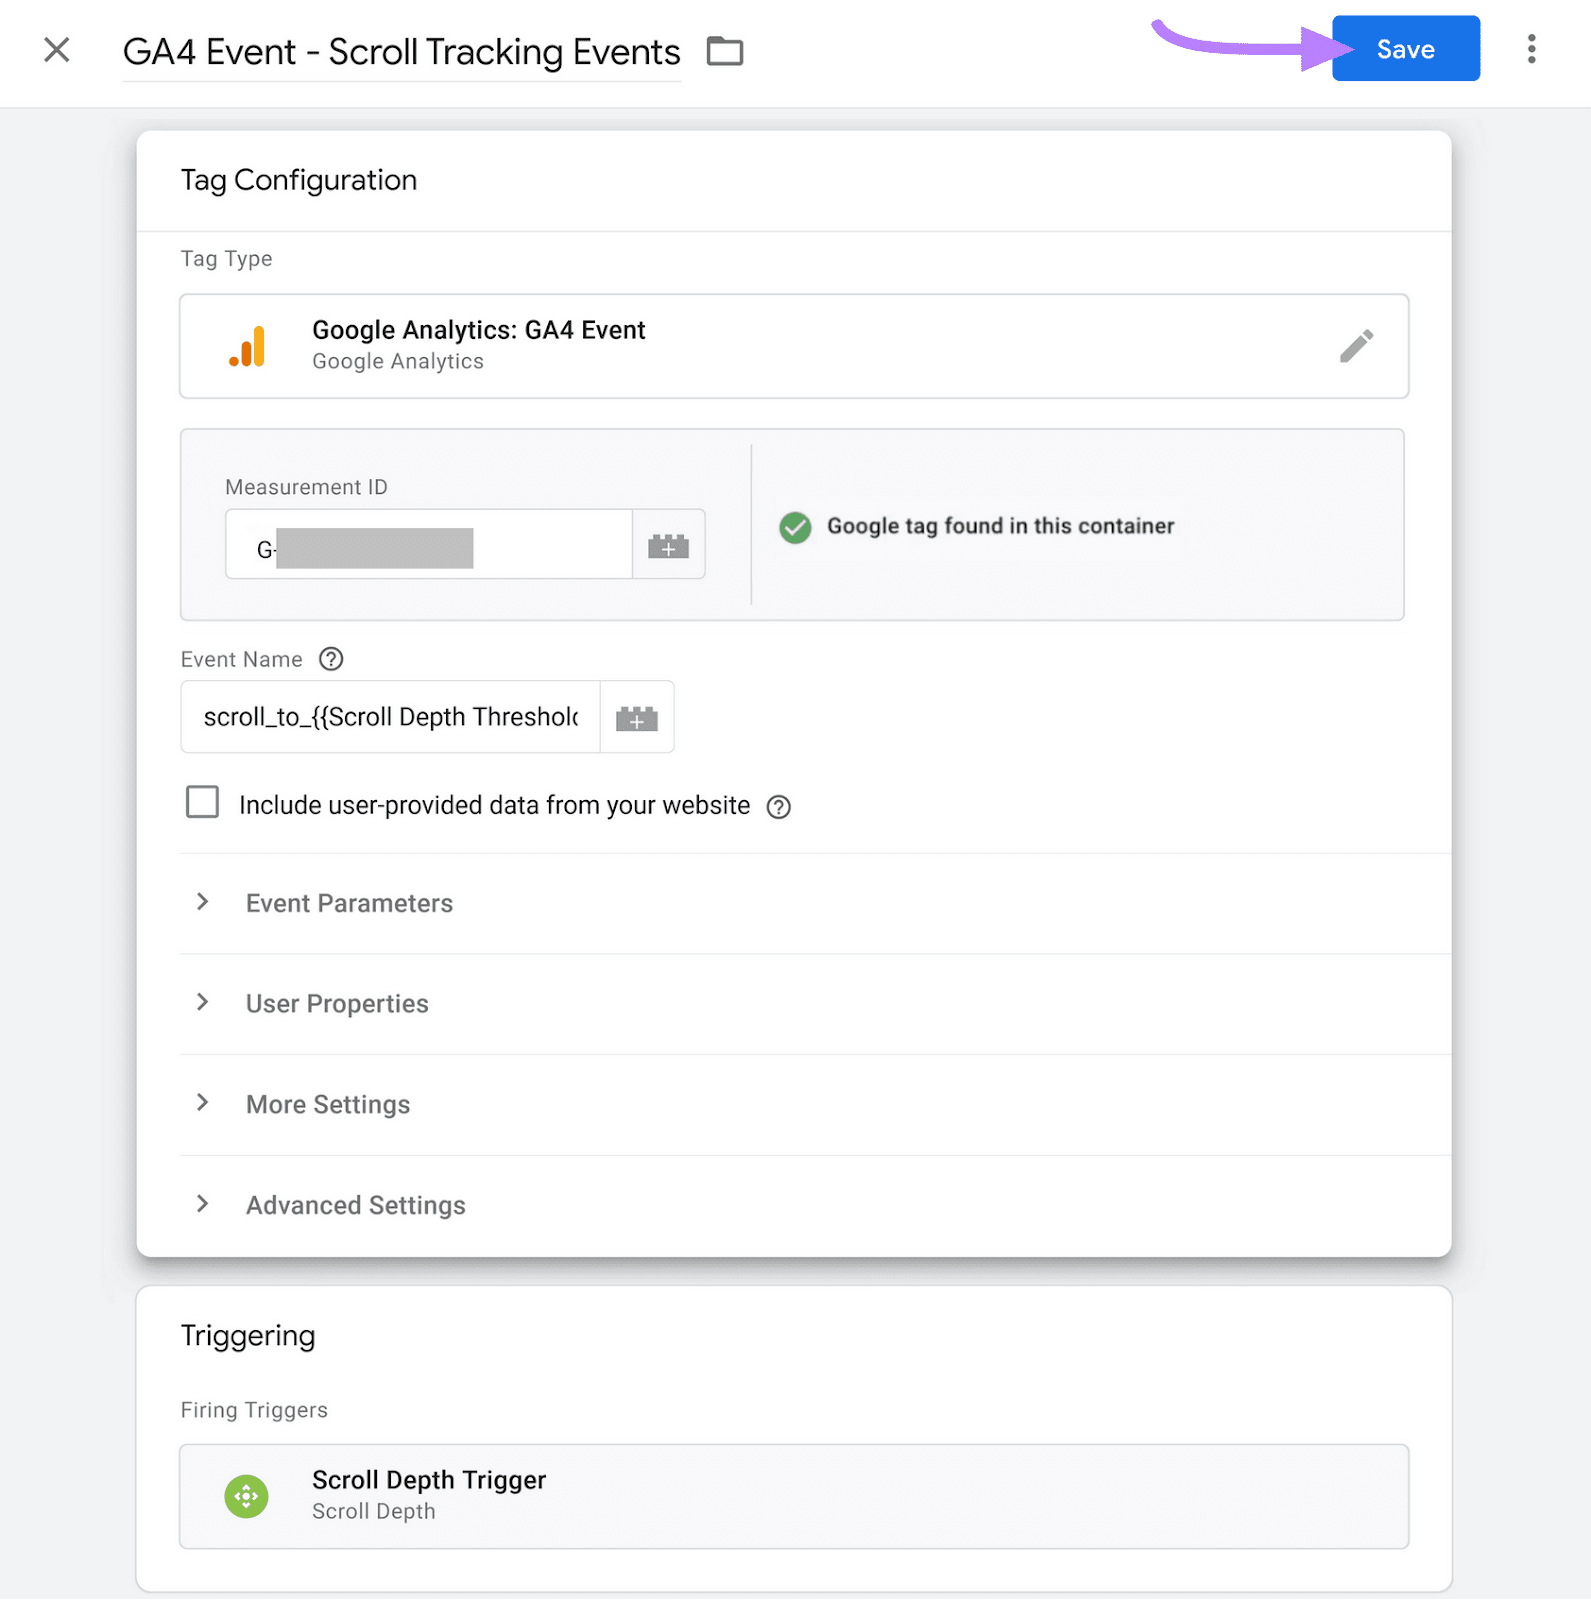
All that remains is to publish the changes to your Google Tag Manager container.
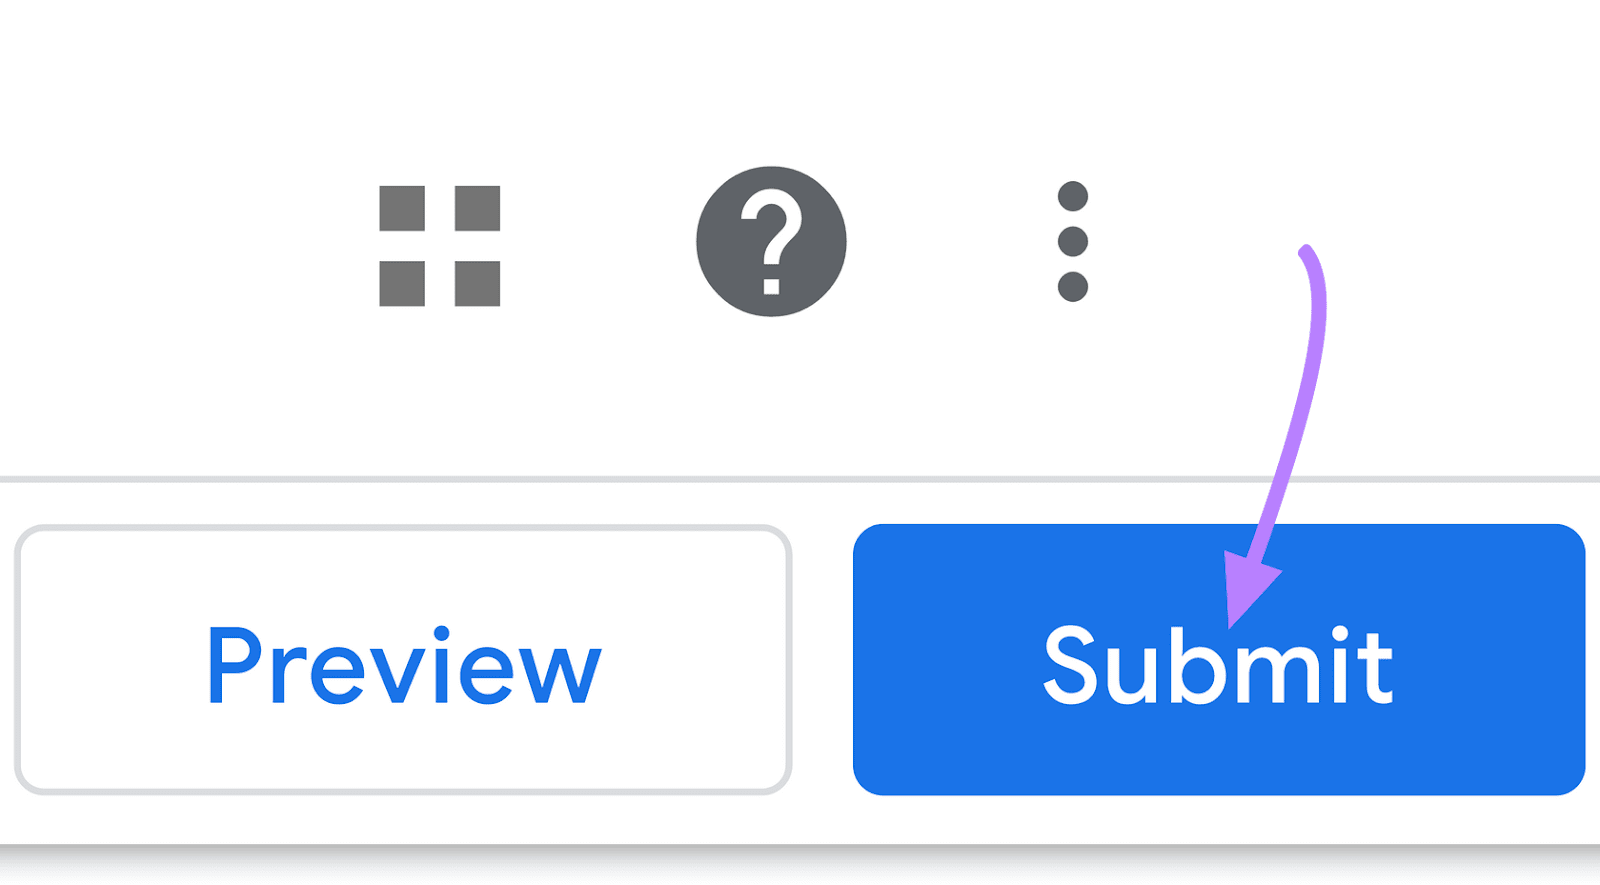
To do that, click “Submit” in the top right of your screen.
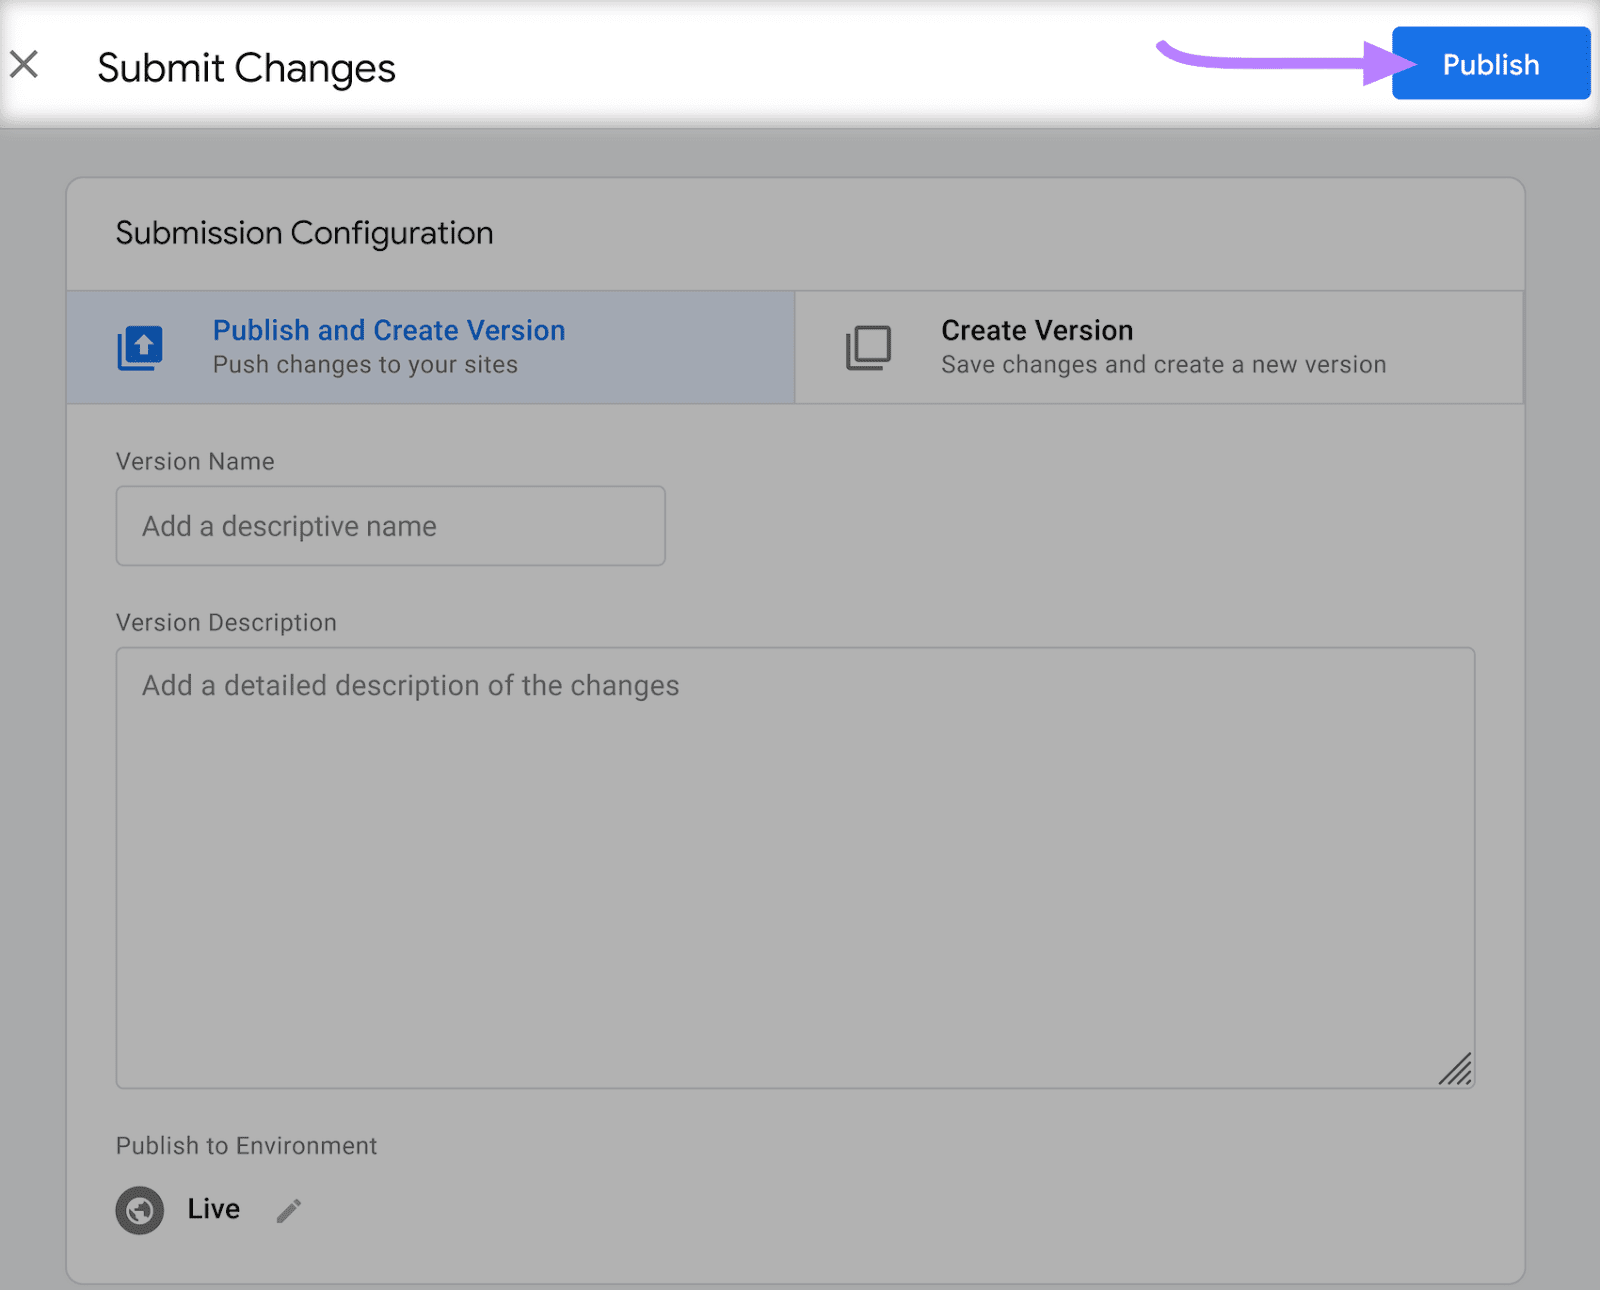
Then, click “Publish” to make everything live.
Once you’ve published your container, your new tags and triggers will create advanced scroll depth data in your GA4 property. Google says it can take 24-48 hours for data to start showing in your reports.
The next section will show you how to find scroll depth in Google Analytics. So that you can start using the data to improve your content.
You can find Google Analytics scroll depth data in two places:
- Standard reports
- Custom explorations
You can use standard reports to get a high-level snapshot of your scroll performance.
Explorations, on the other hand, are best suited for more in-depth scroll reporting (using the tags and triggers we set up in the previous section). You can create one of these advanced reports by using the “Explore” tab in the left-hand navigation.
Let’s start with the standard reports. These rely on the default scroll depth setup within GA4.
How to Find Scroll Depth Data in Standard Reports
You can see a snapshot of your scroll data in your “Events” report.
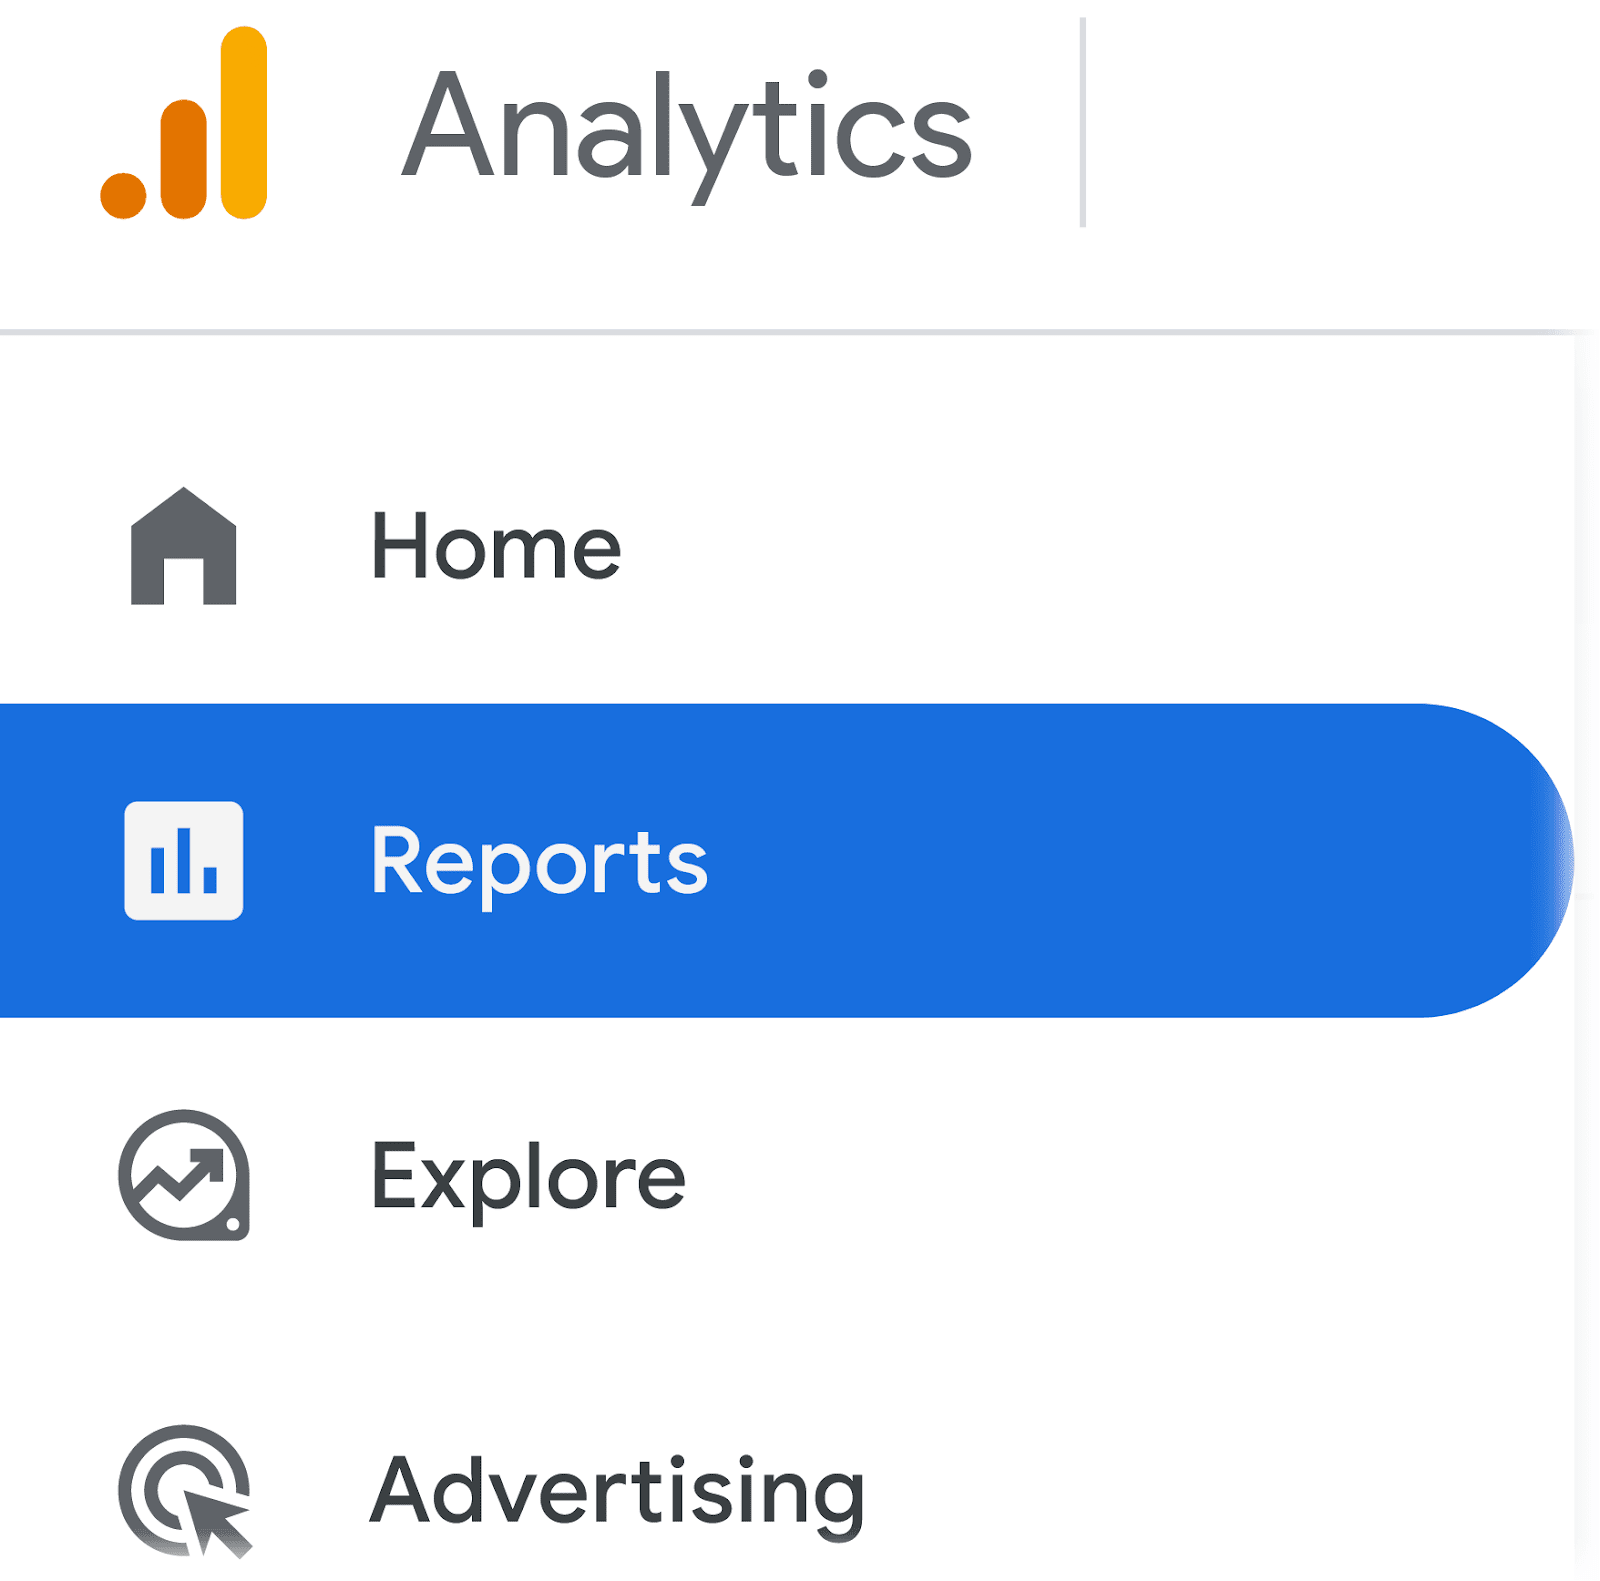
First, click “Reports” from your Google Analytics property.
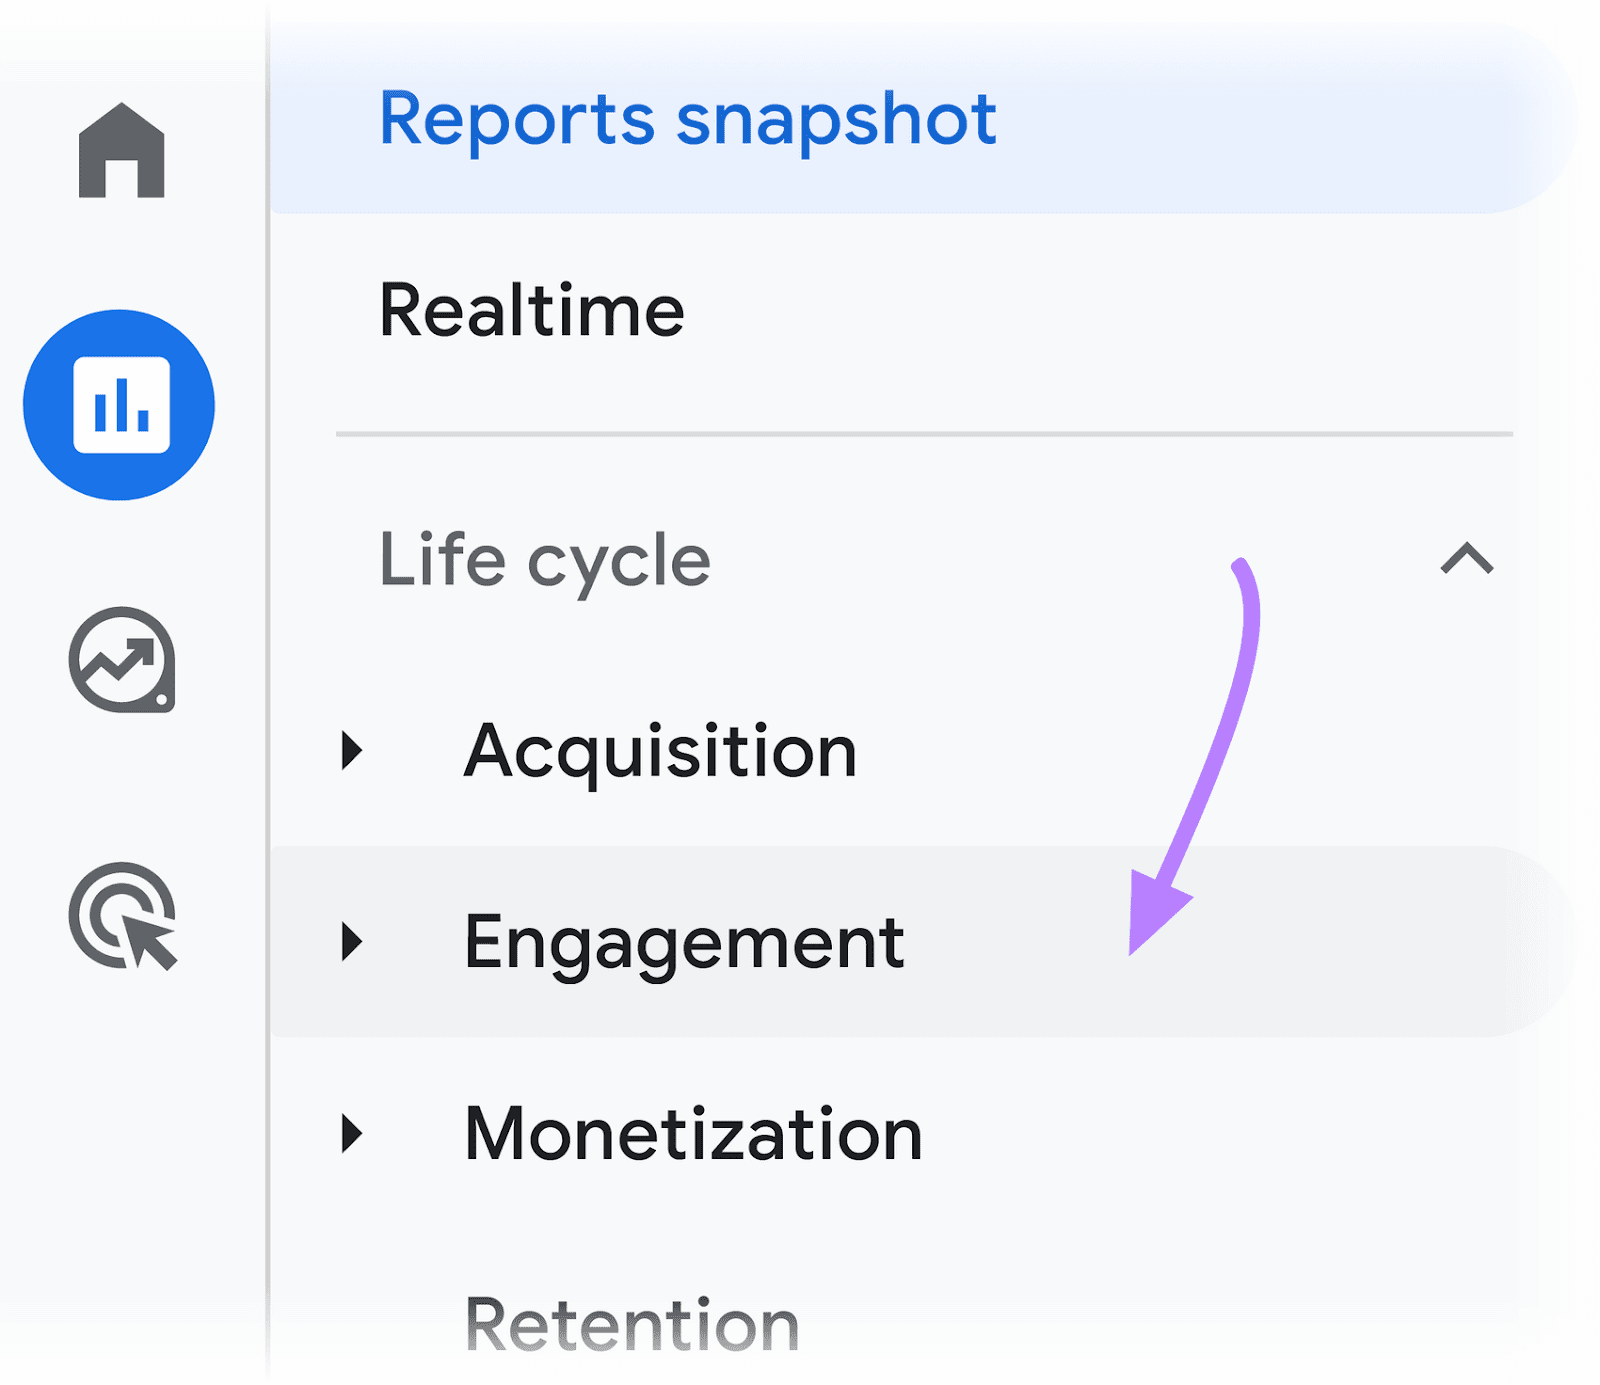
In the “Life cycle” menu, click “Engagement.”
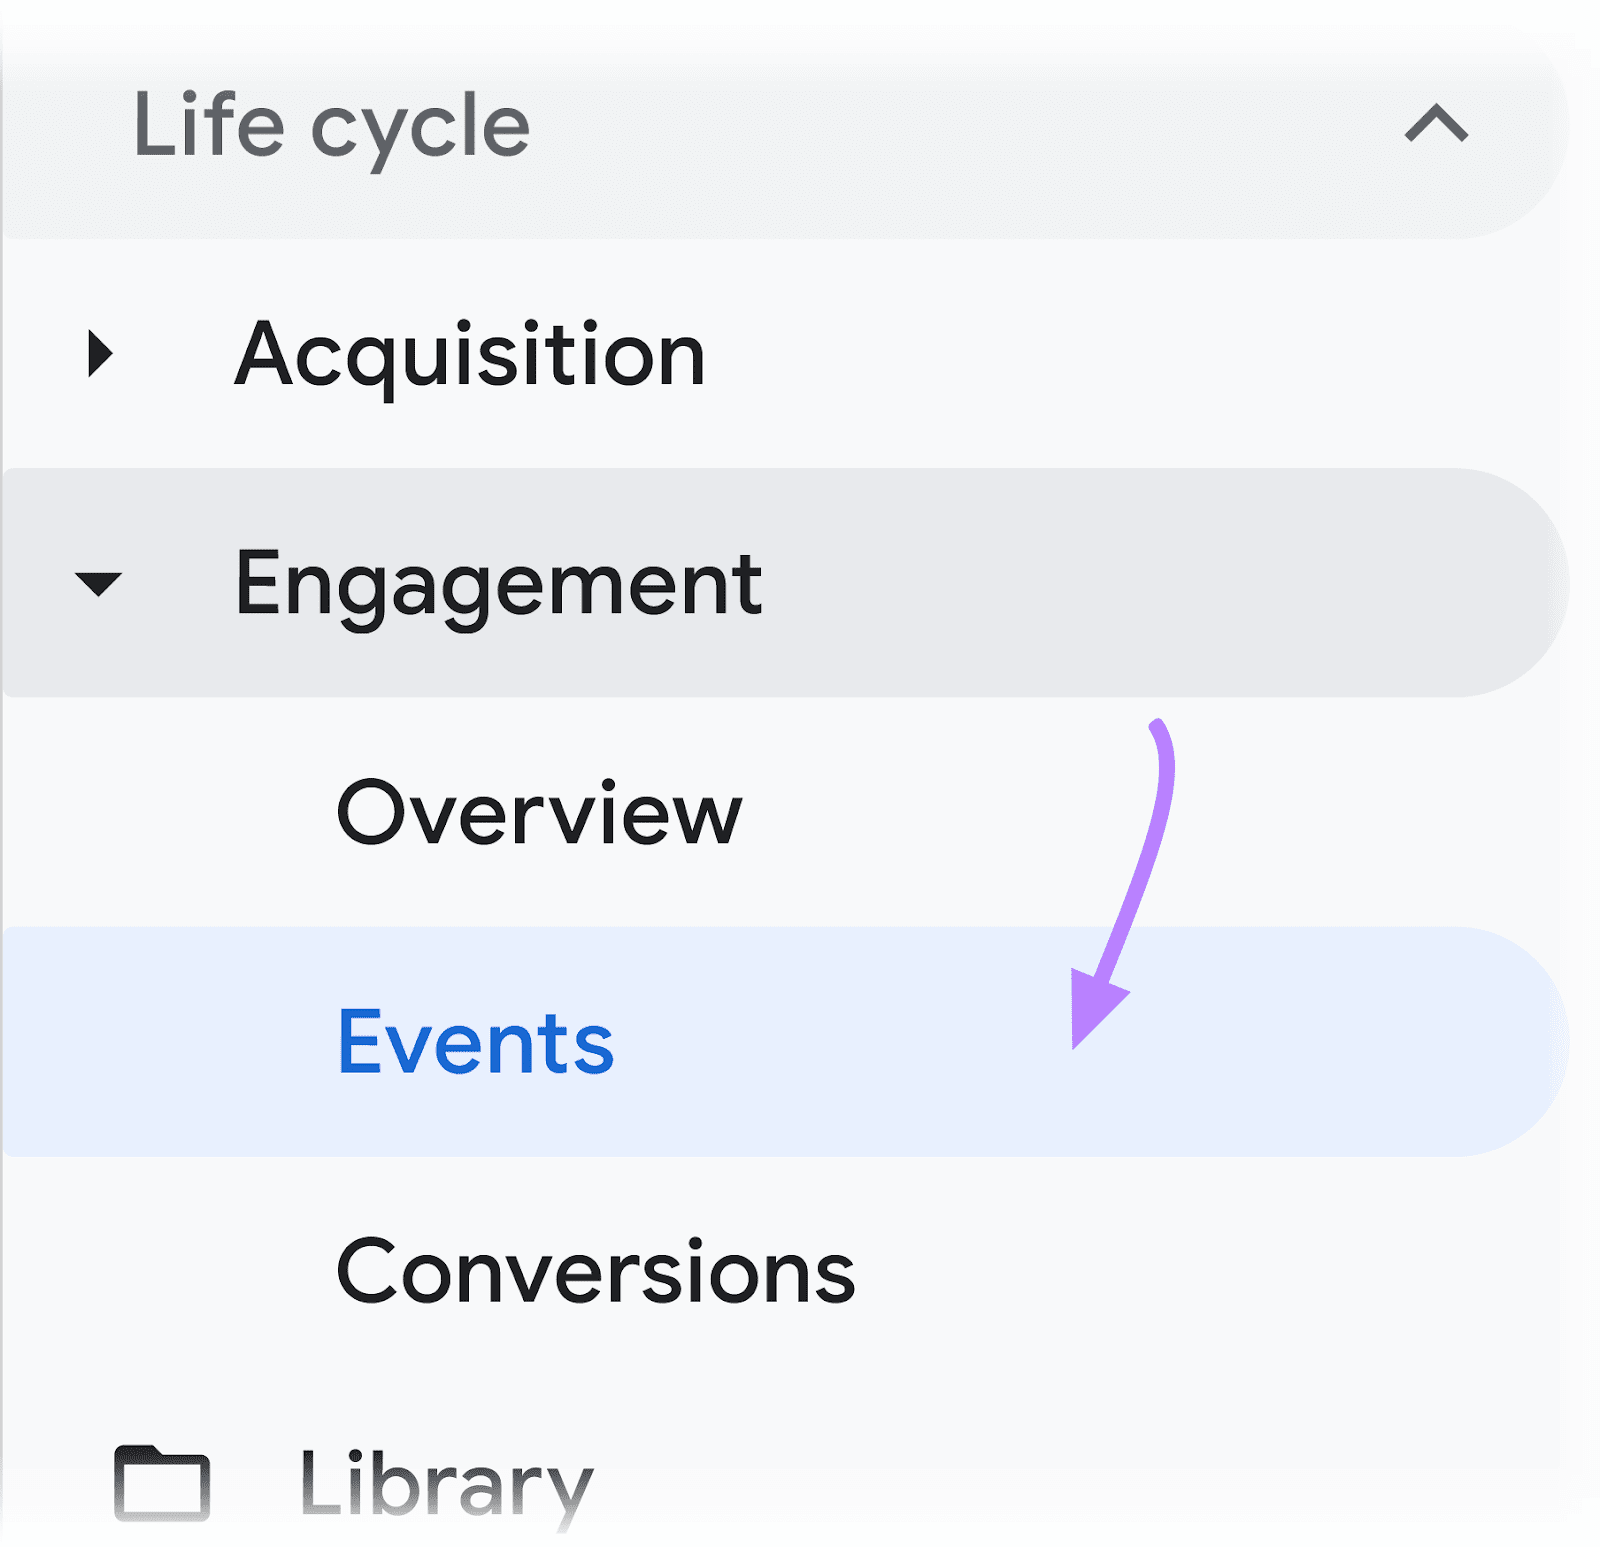
To see a full list of your GA4 events, click the “Events” report within the “Engagement” reporting area.
You’ll see a list of all events sorted in descending order based on event count. You can click into each event in the list to see additional details.
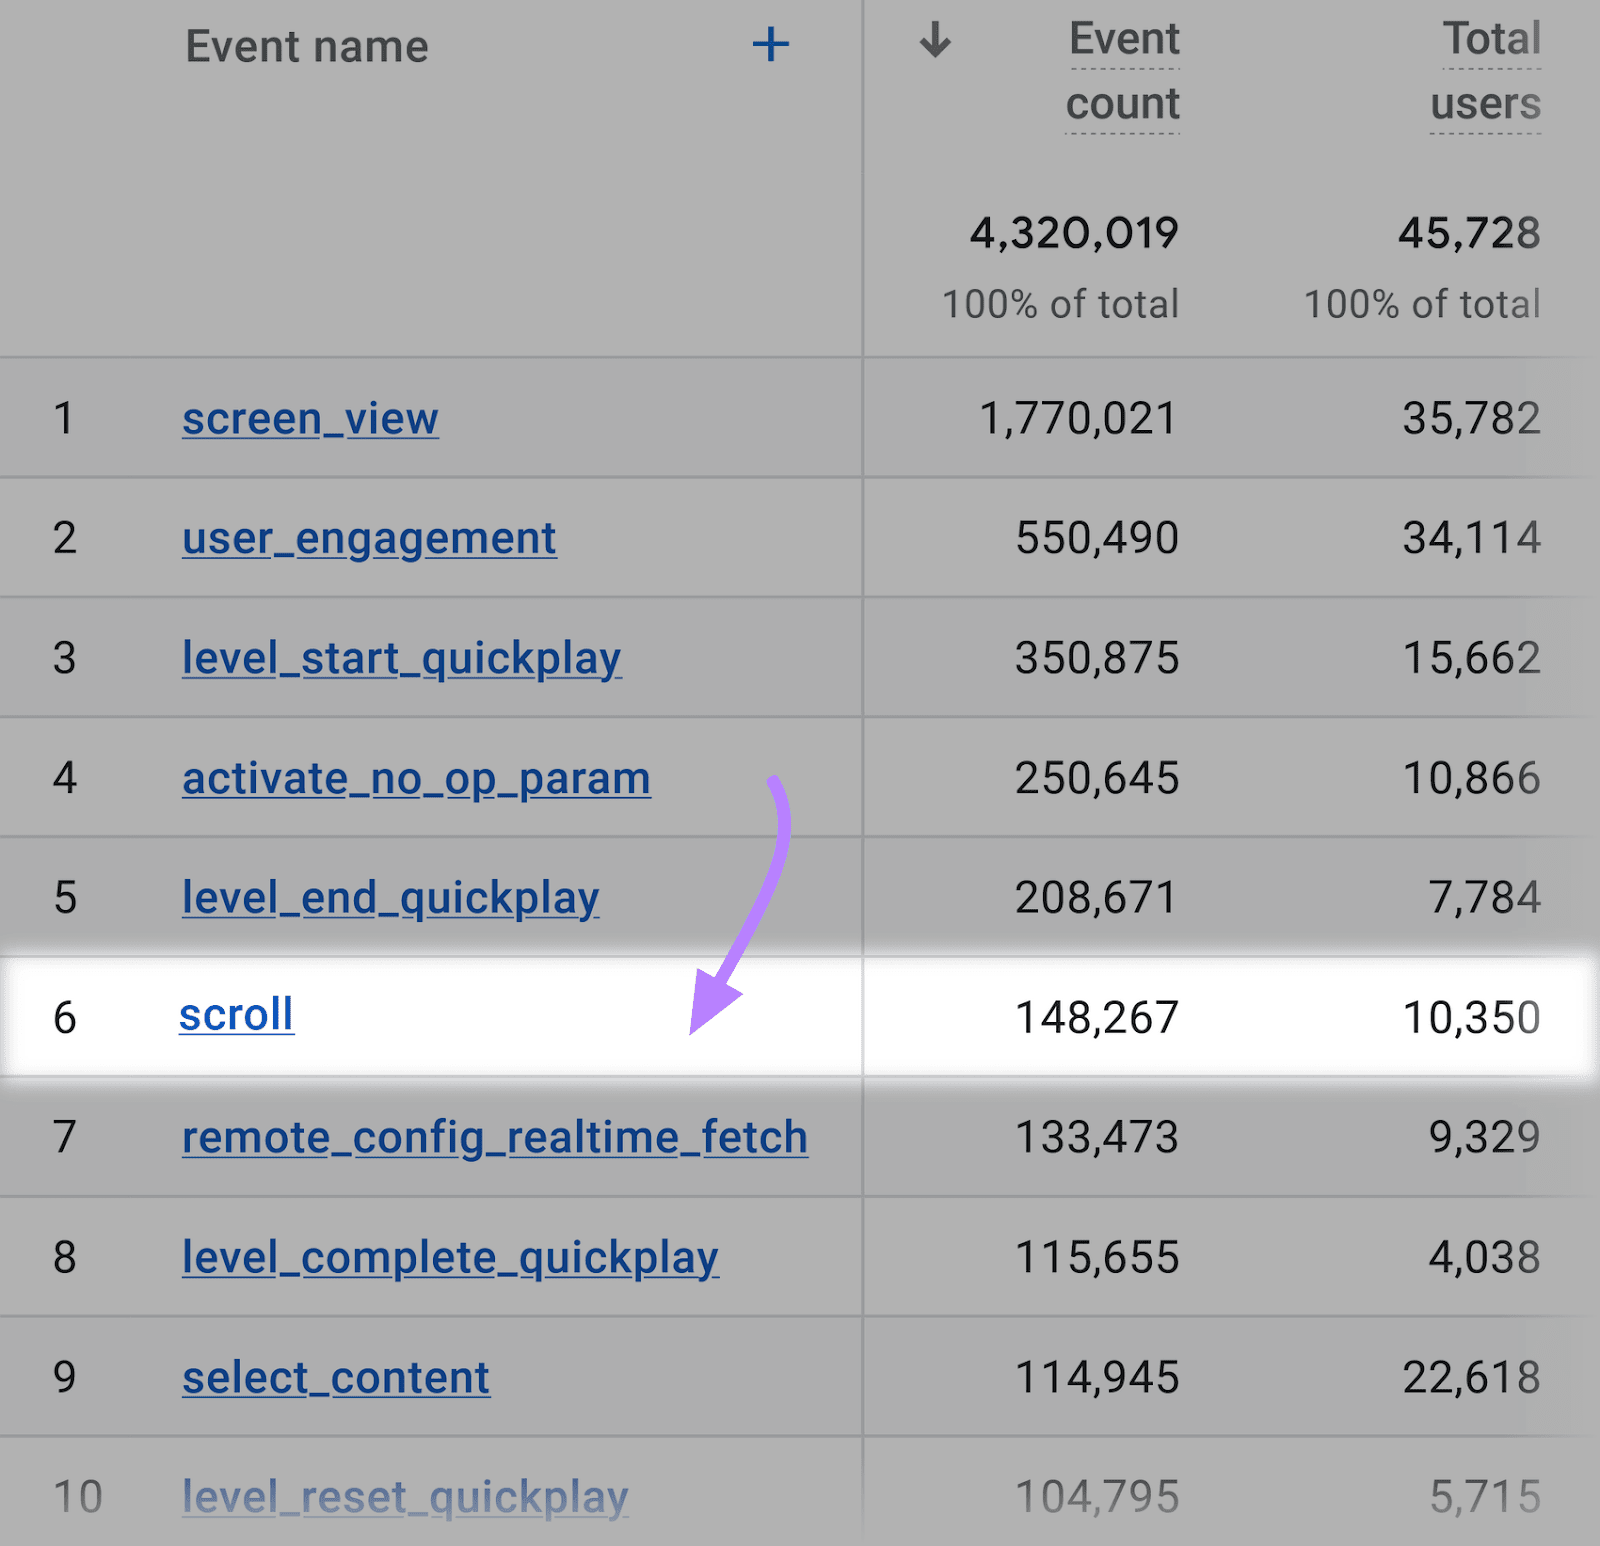
The example above shows the default scroll event that will fire at 90% scroll depth. You can compare the number of scroll events to the number of page_view events to get a sense of how many readers are fully consuming your content.
But you can get more actionable data with custom scroll event data in Explorations.
How to Find Scroll Depth Data in Explorations
To analyze detailed scroll depth thresholds at the page level, you can use GA4 Explorations.
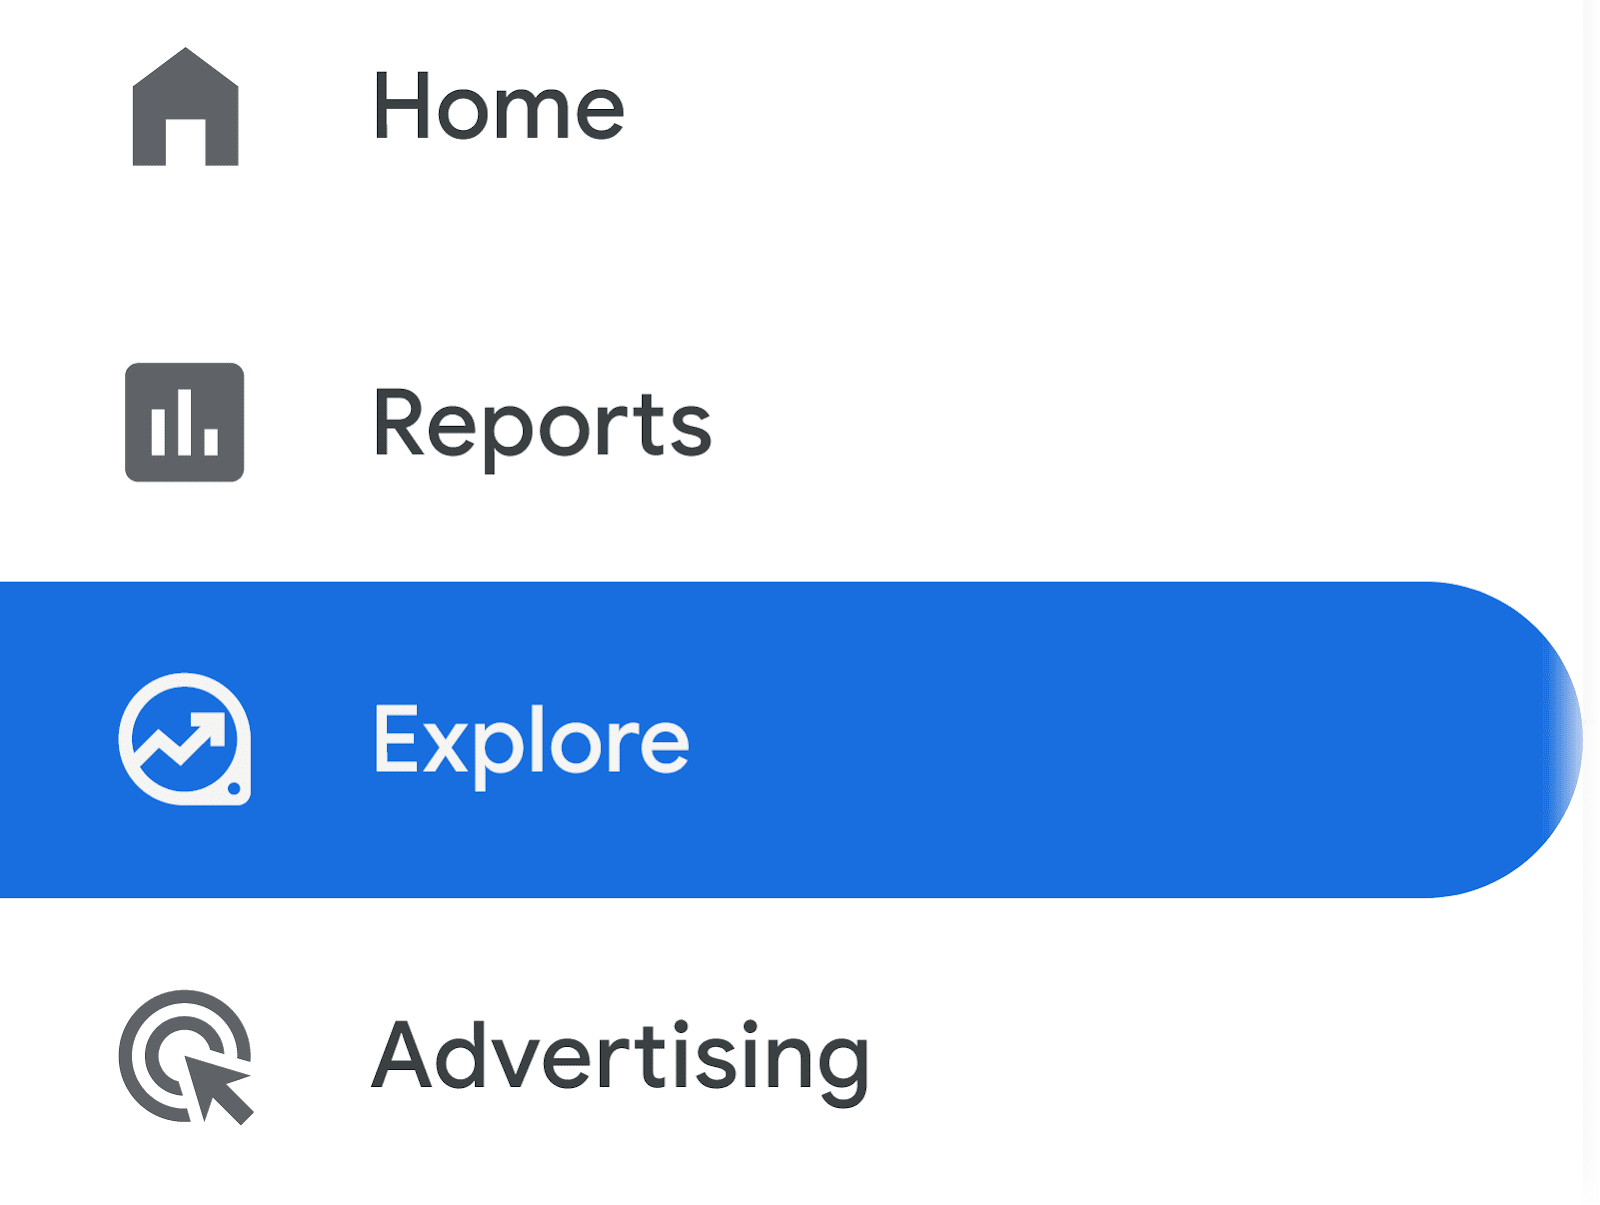
First, click “Explore” from the left-hand navigation.
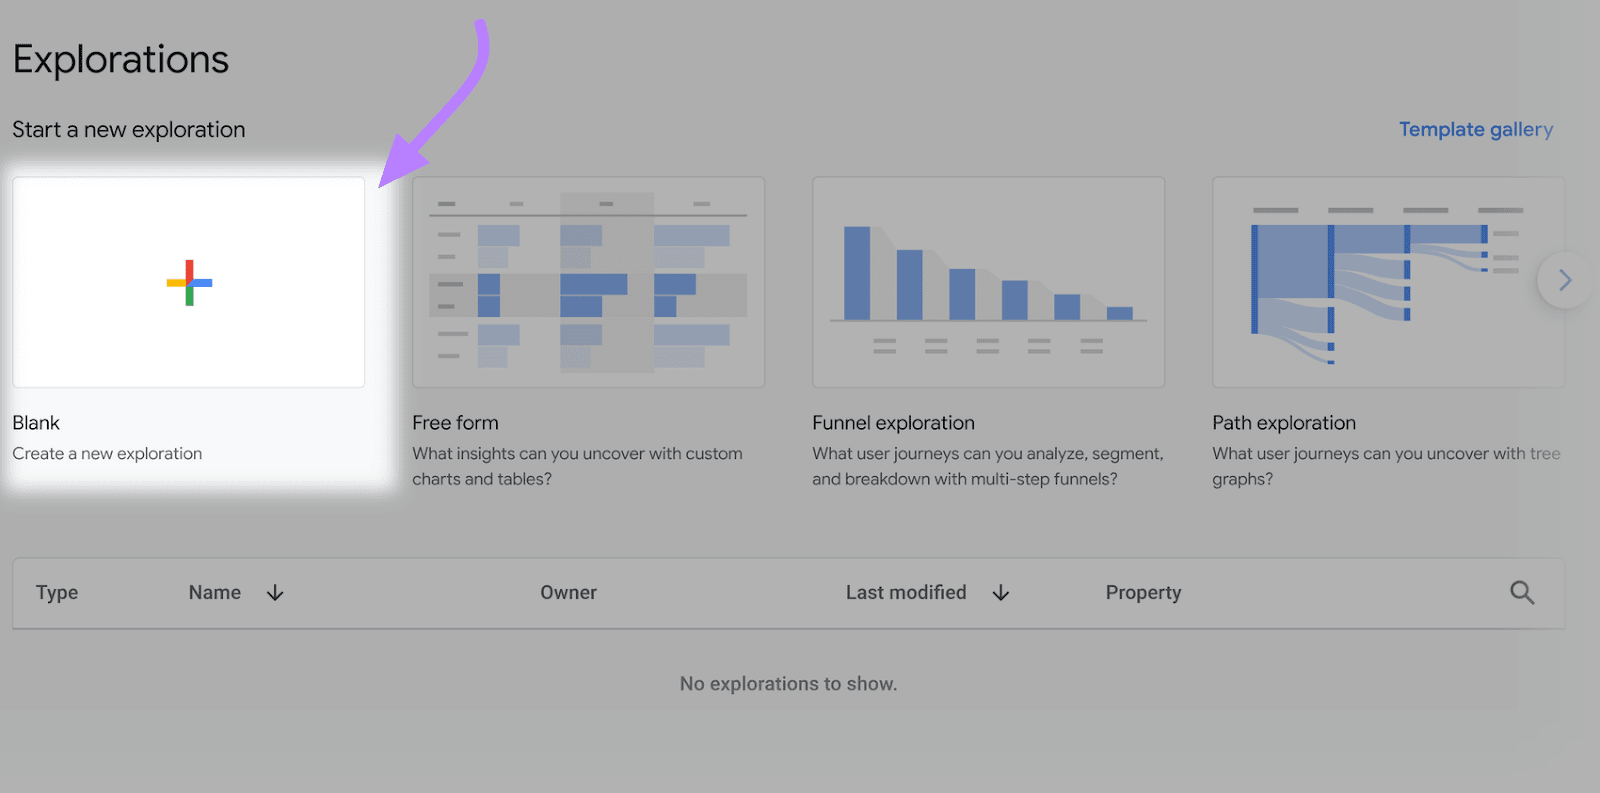
Then, click in the “Blank” report template to create a custom Exploration from scratch.
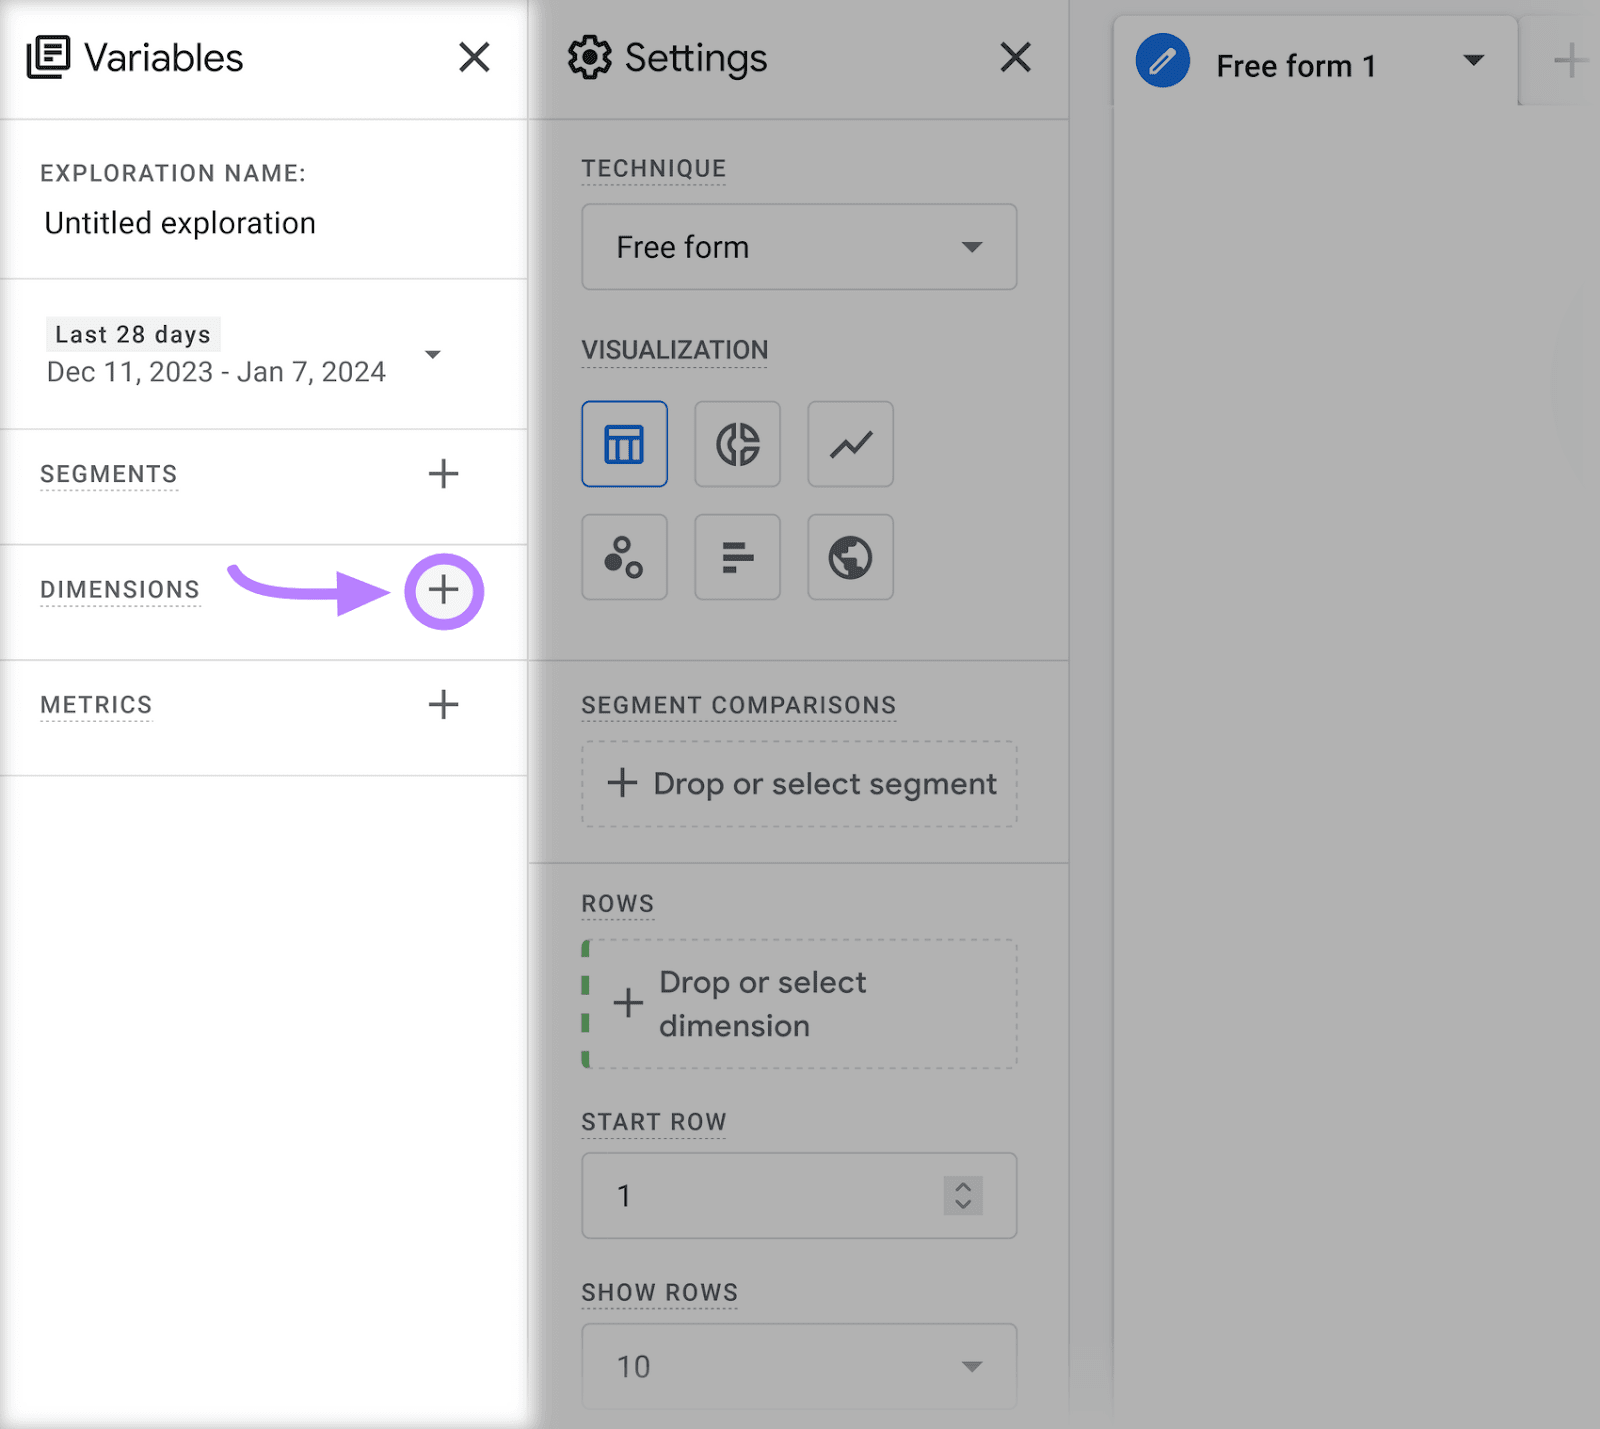
Now you can select your “Dimensions” for your custom report.
Click on the “+” sign to the right of “Dimensions.”
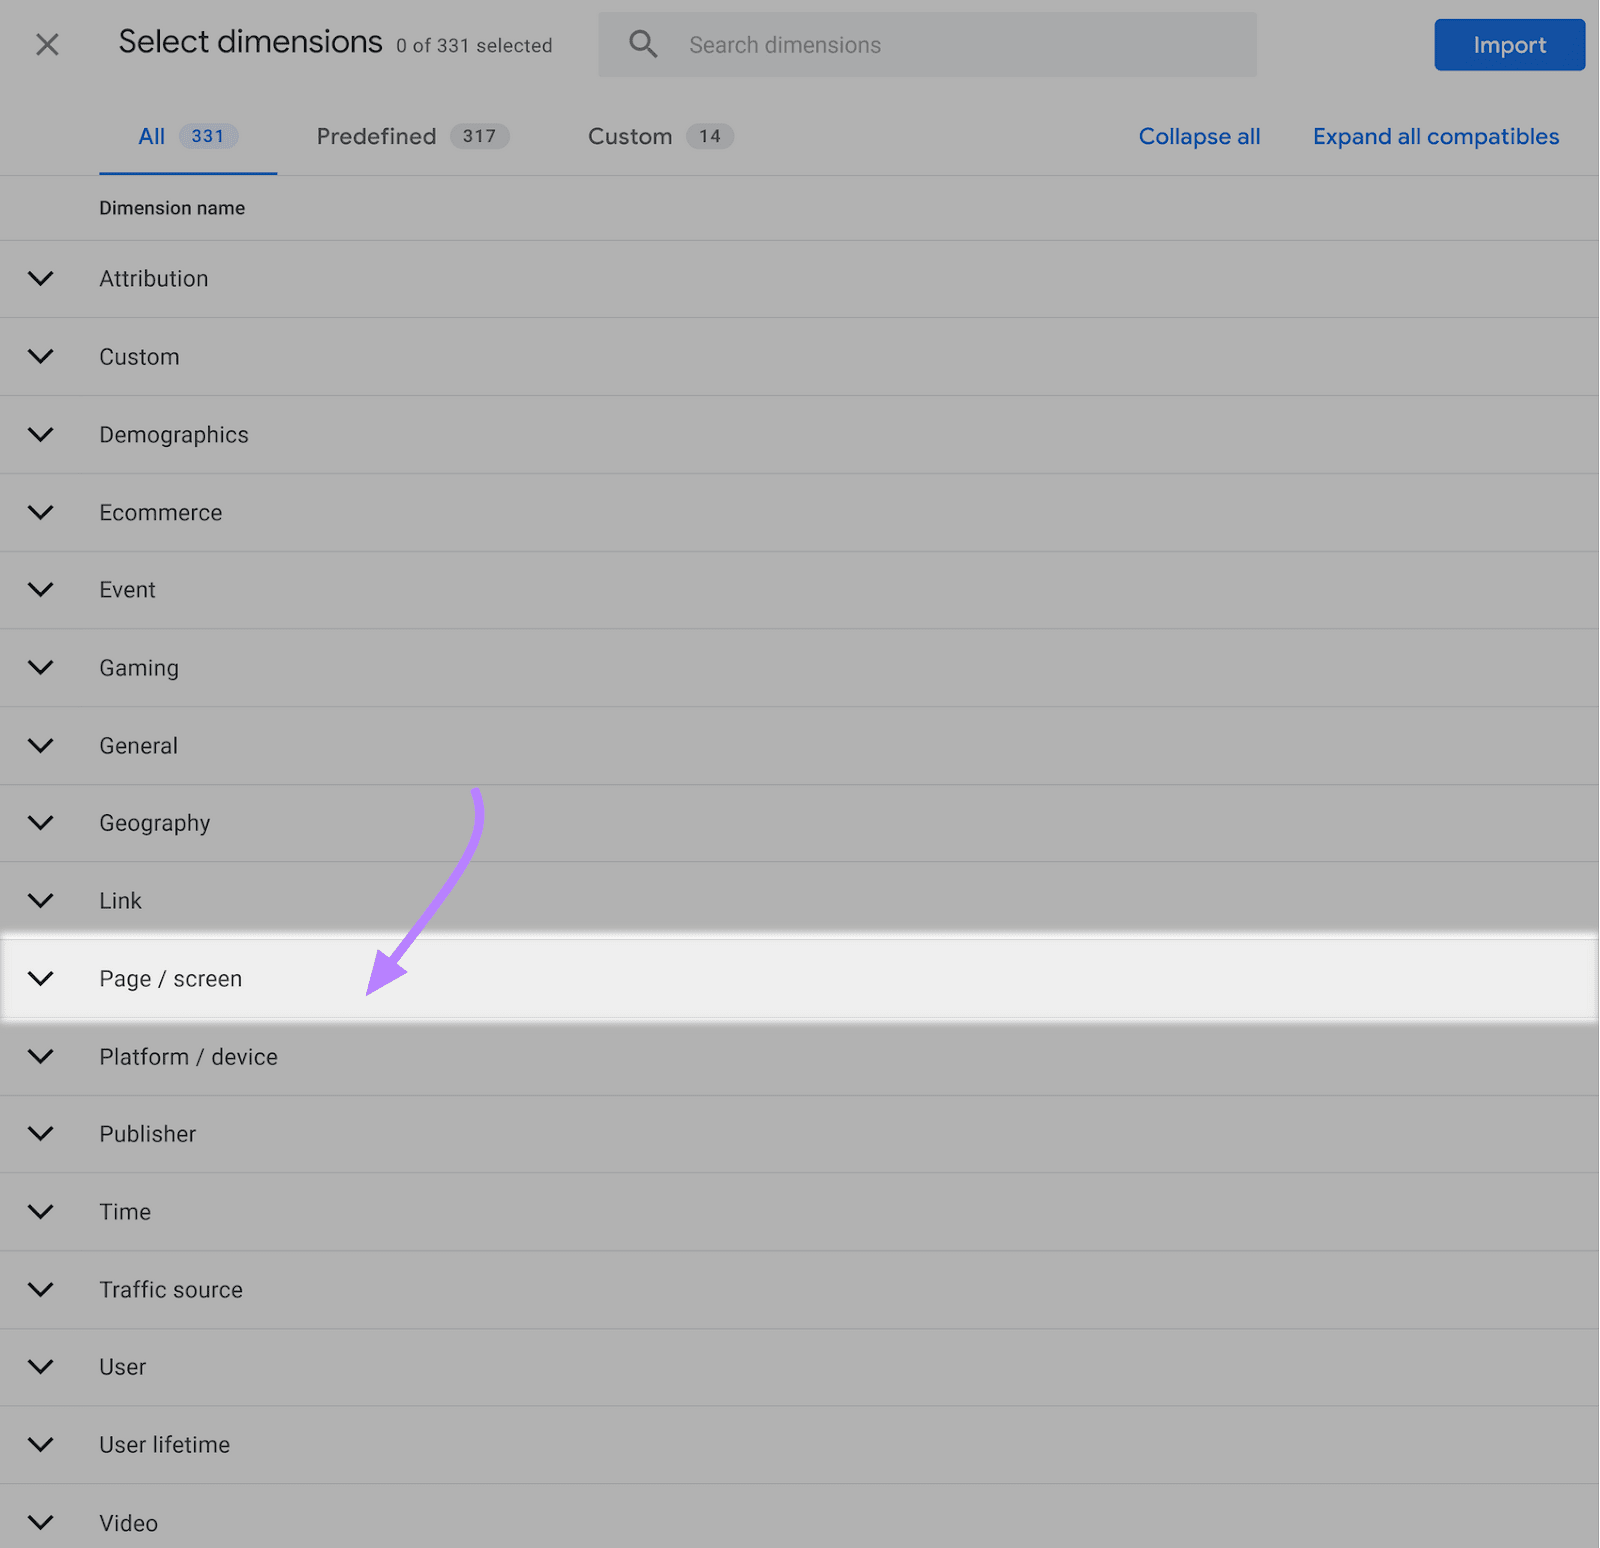
You’ll see a list of over 300 dimensions arranged in groups. You want to analyze scroll depth at the page level, so click on the “Page / screen” drop-down to expand your options and find the dimension you need.
Use the checkbox to the left of “Page path and screen class” to select this dimension. Then, click “Event” so you can select the other dimension you’ll need.
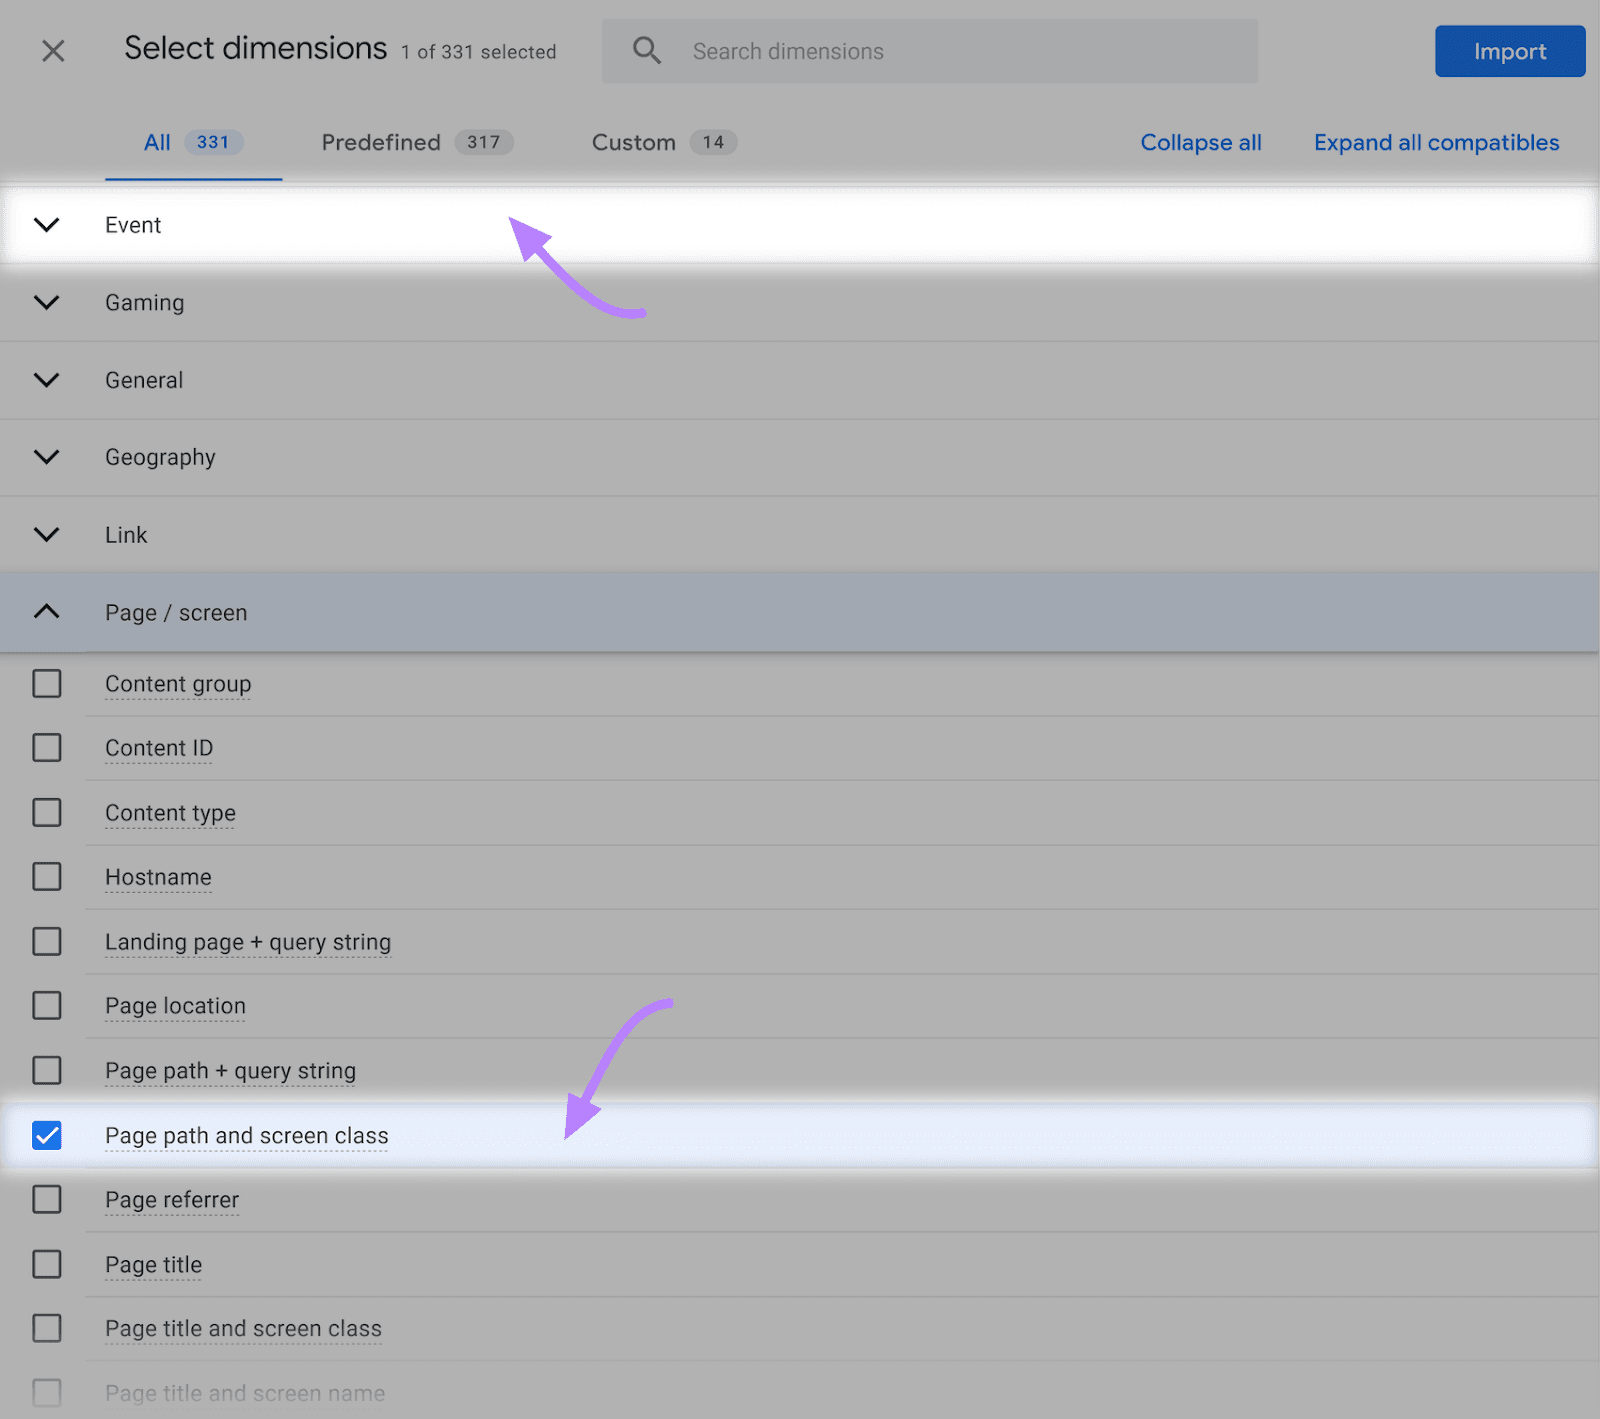
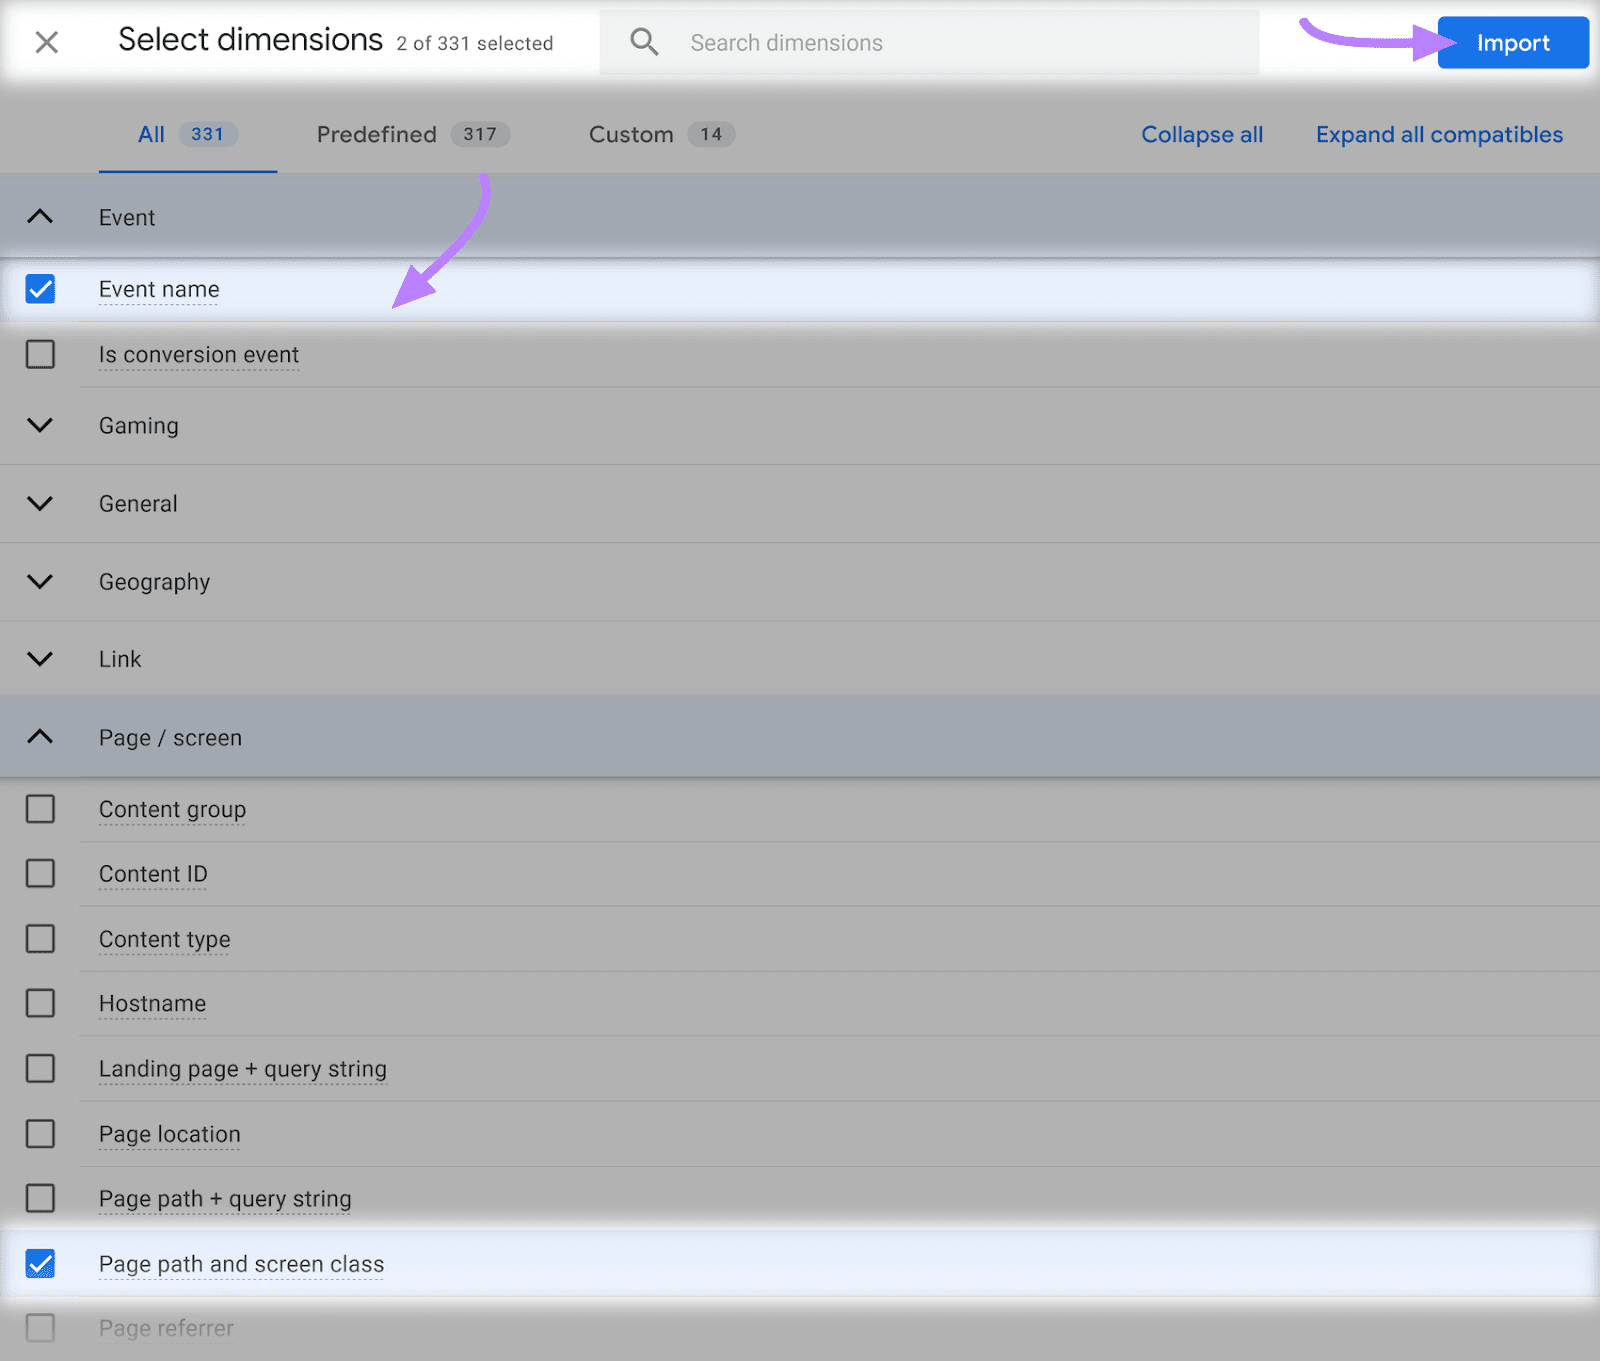
You can now select the “Event name” dimension using the checkbox. Like this.
Then, click “Import” to add both dimensions to your report.
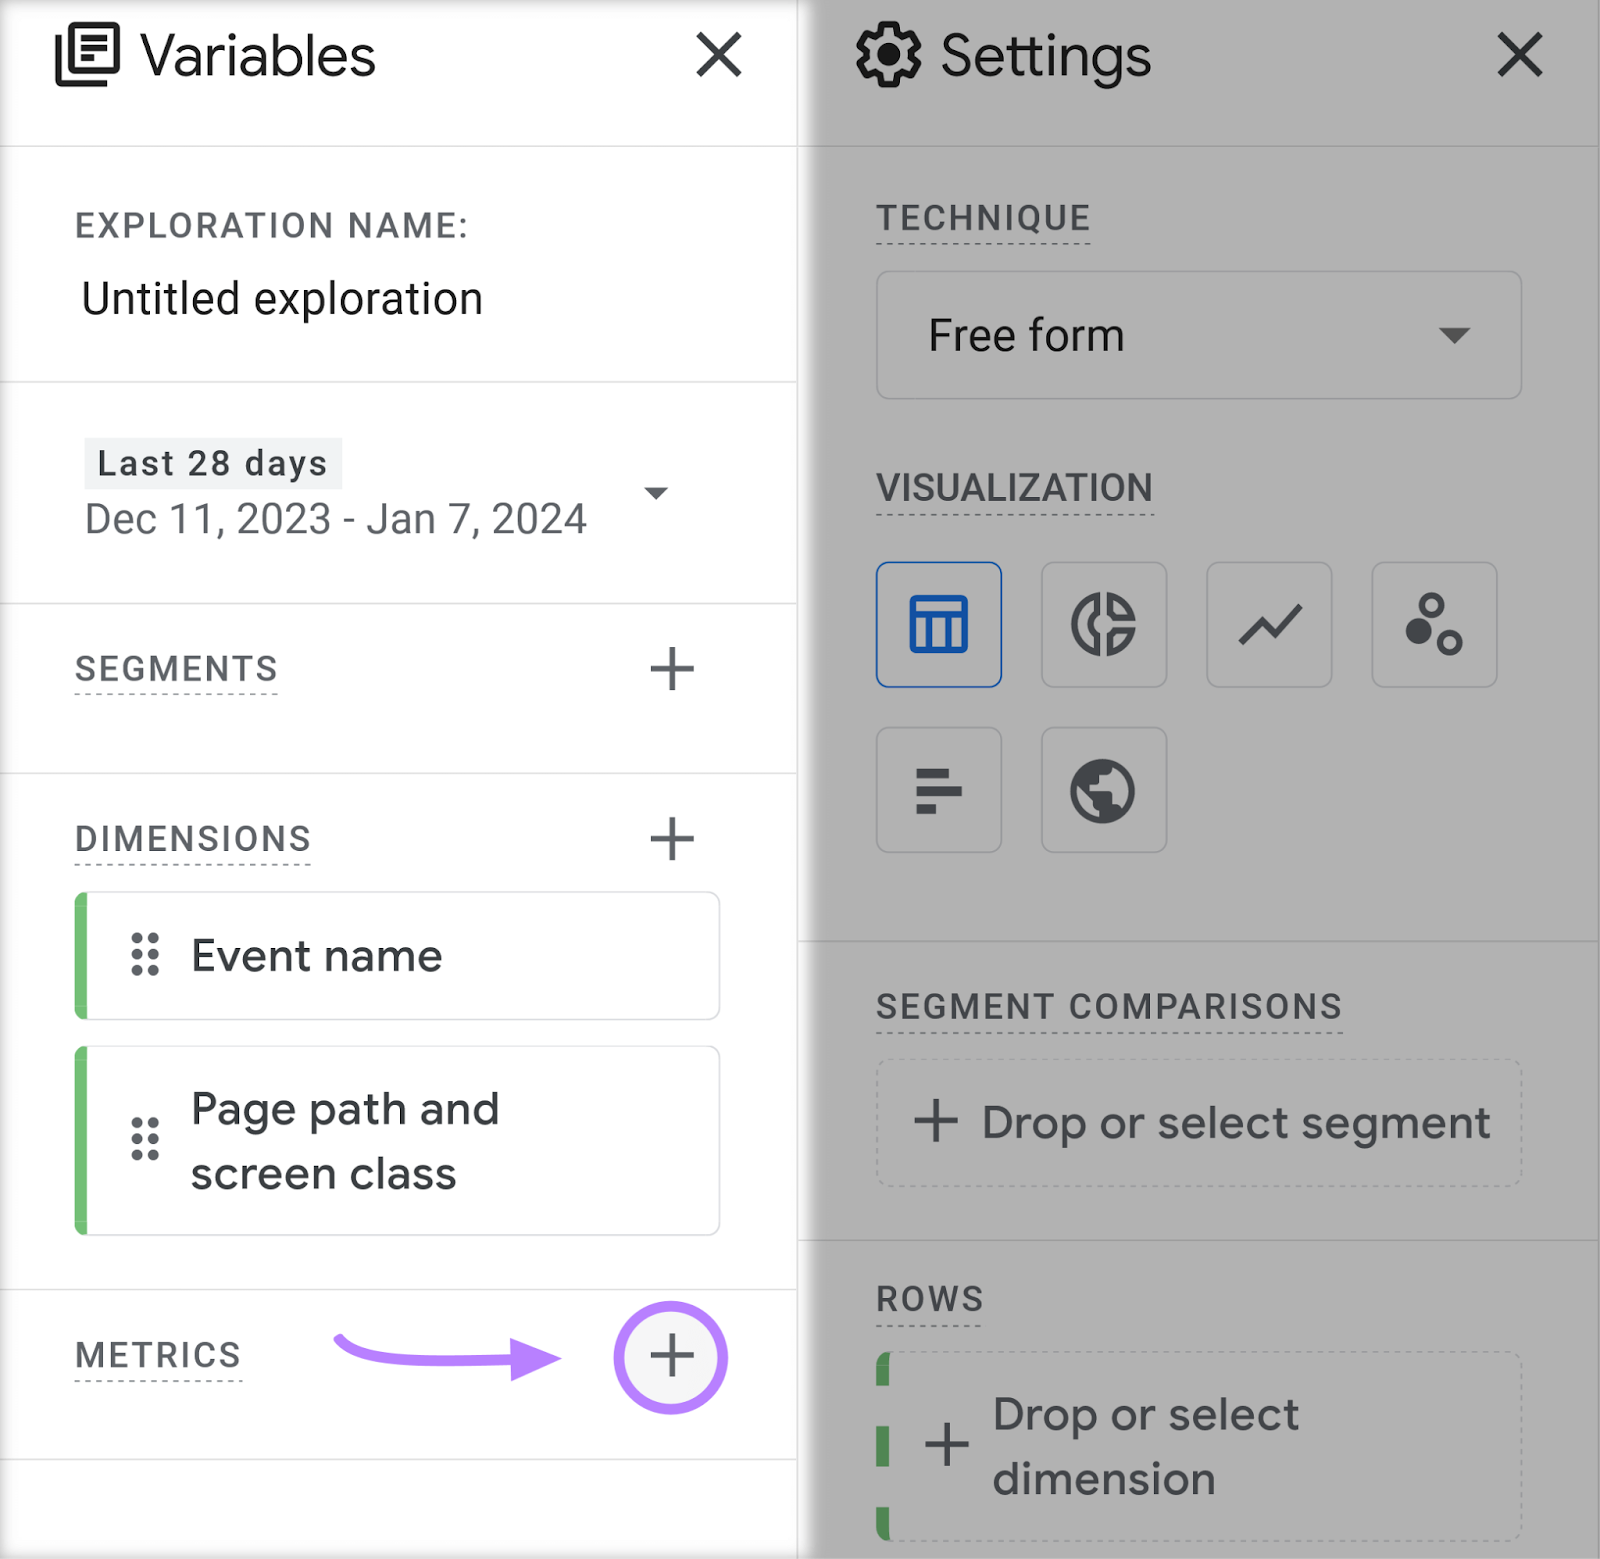
Now, click the “+” sign to the right of “Metrics.”
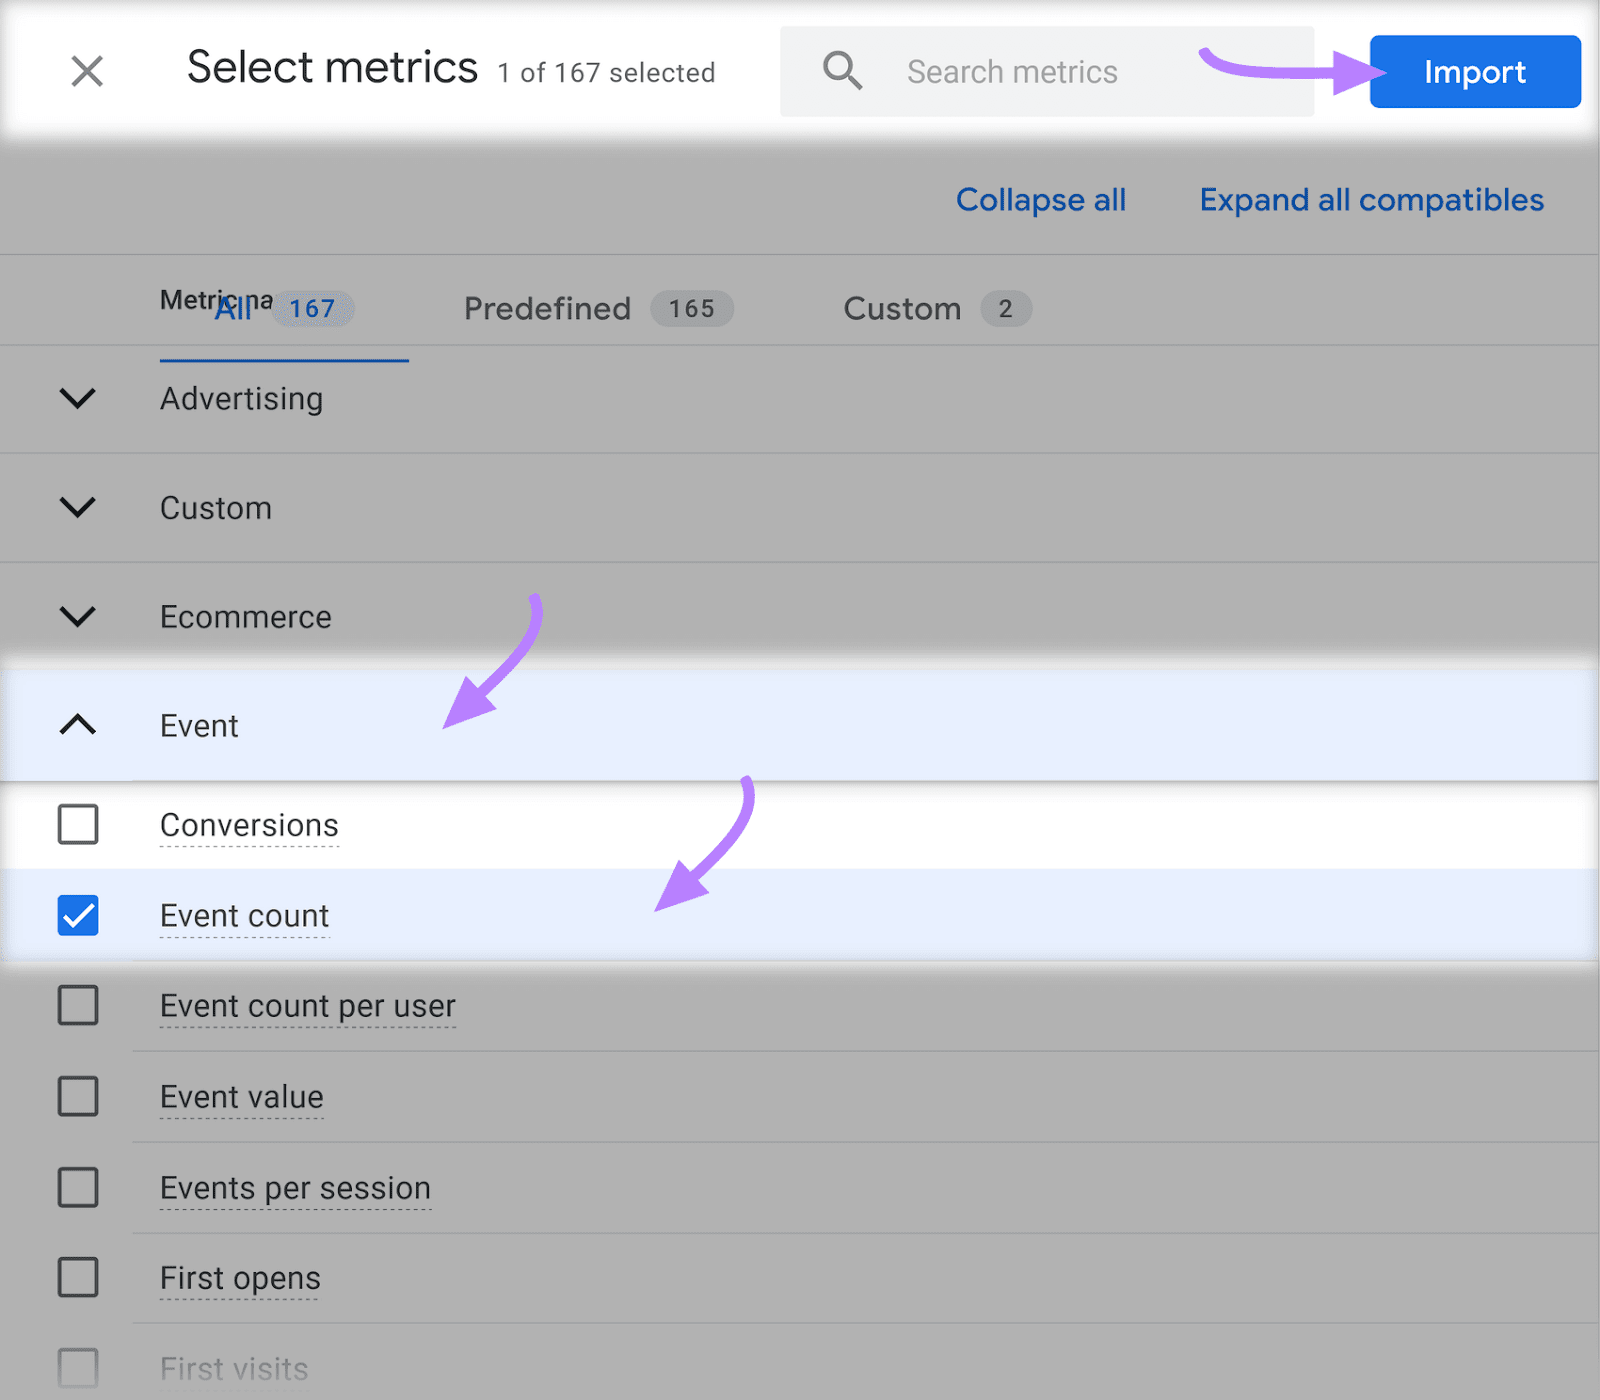
You’ll see a list of metrics you can choose. Click into the “Event” group and then use the checkbox to select “Event count.”
Then, click “Import.”
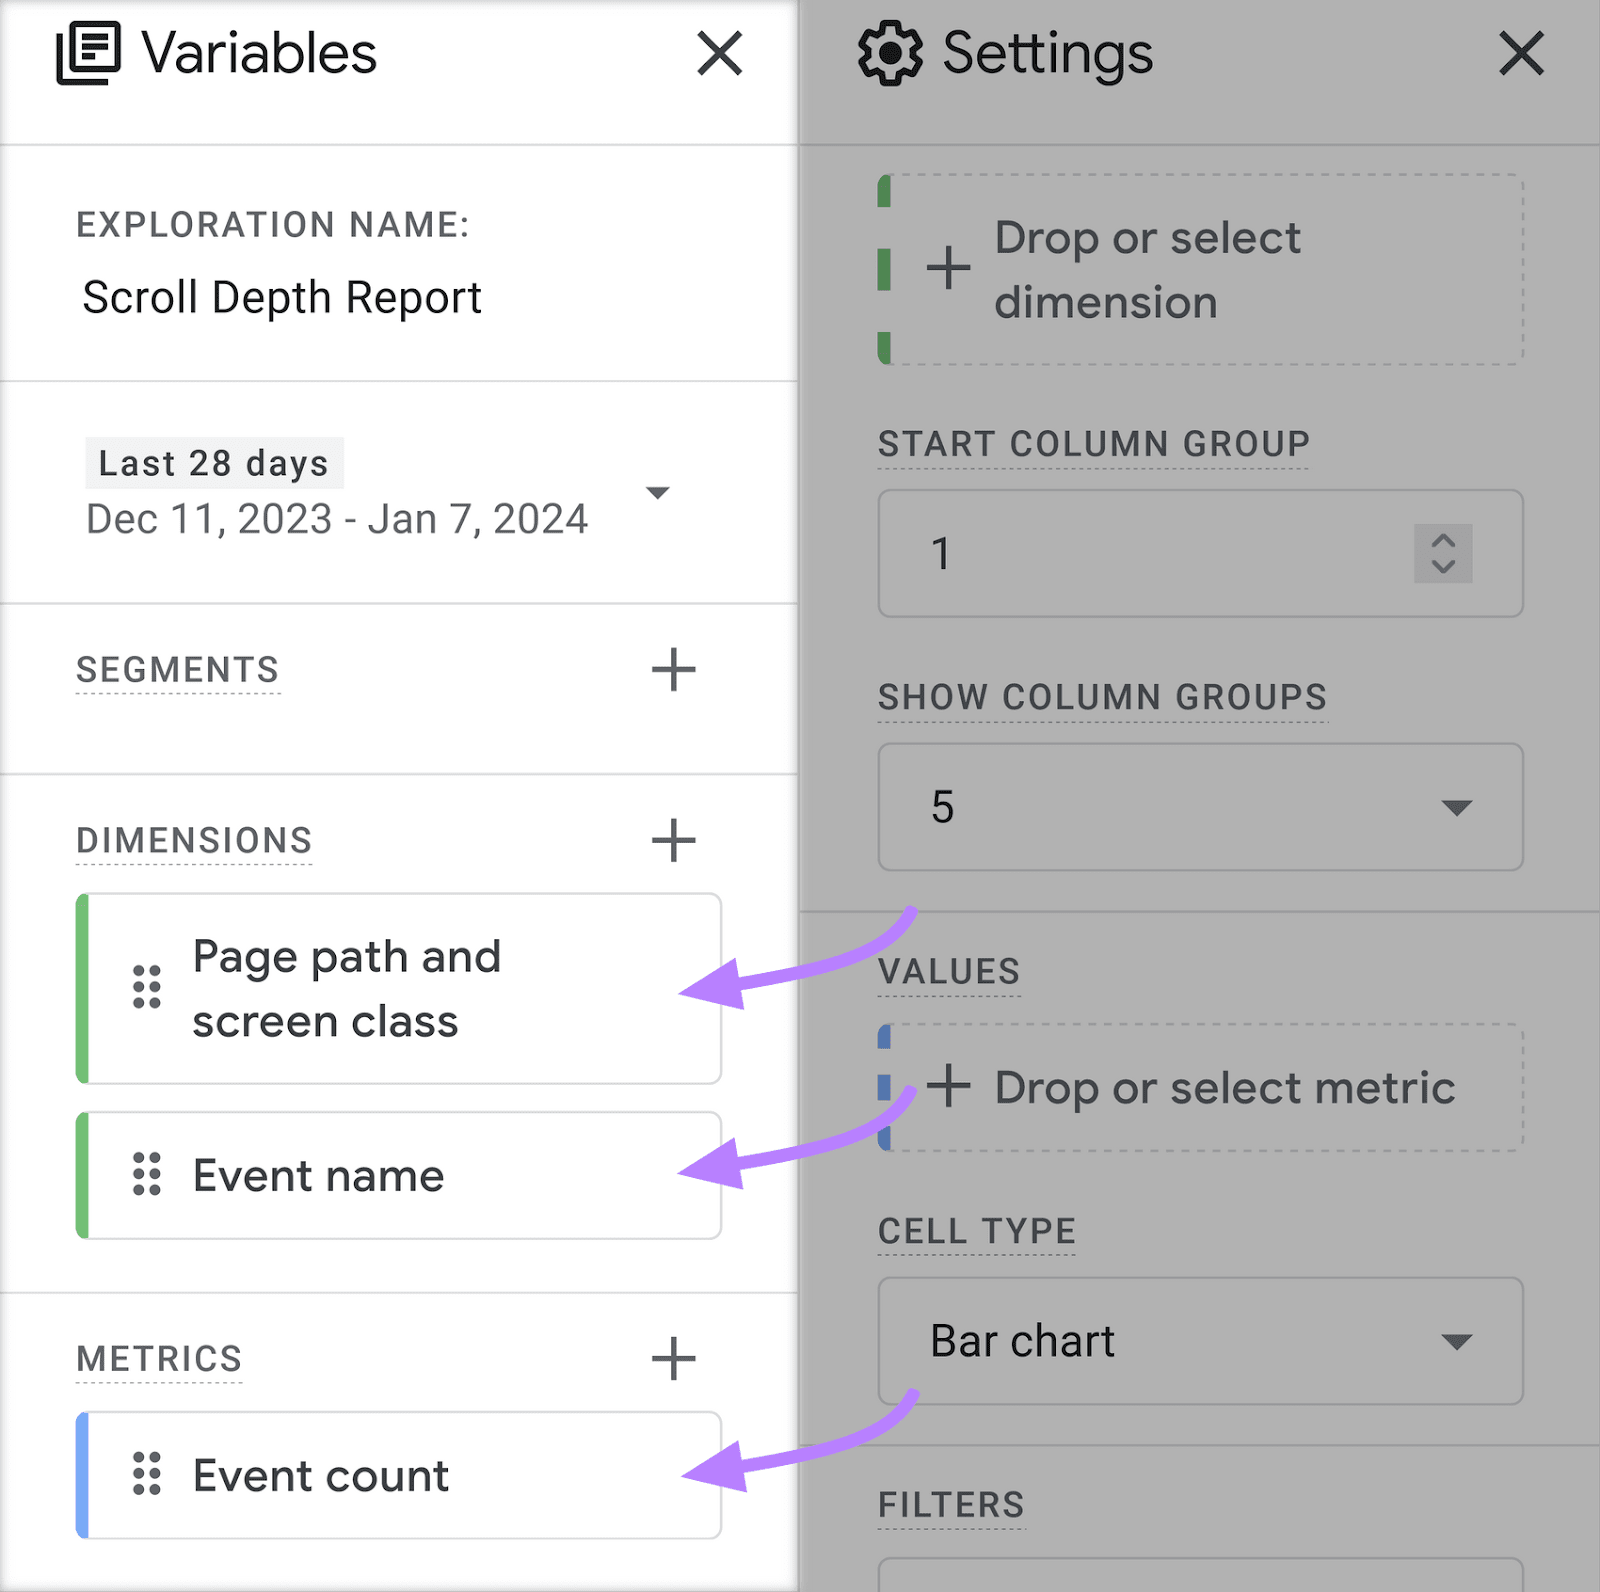
You now have your dimensions and metrics ready for your report. Name your report using the “Exploration Name” field.
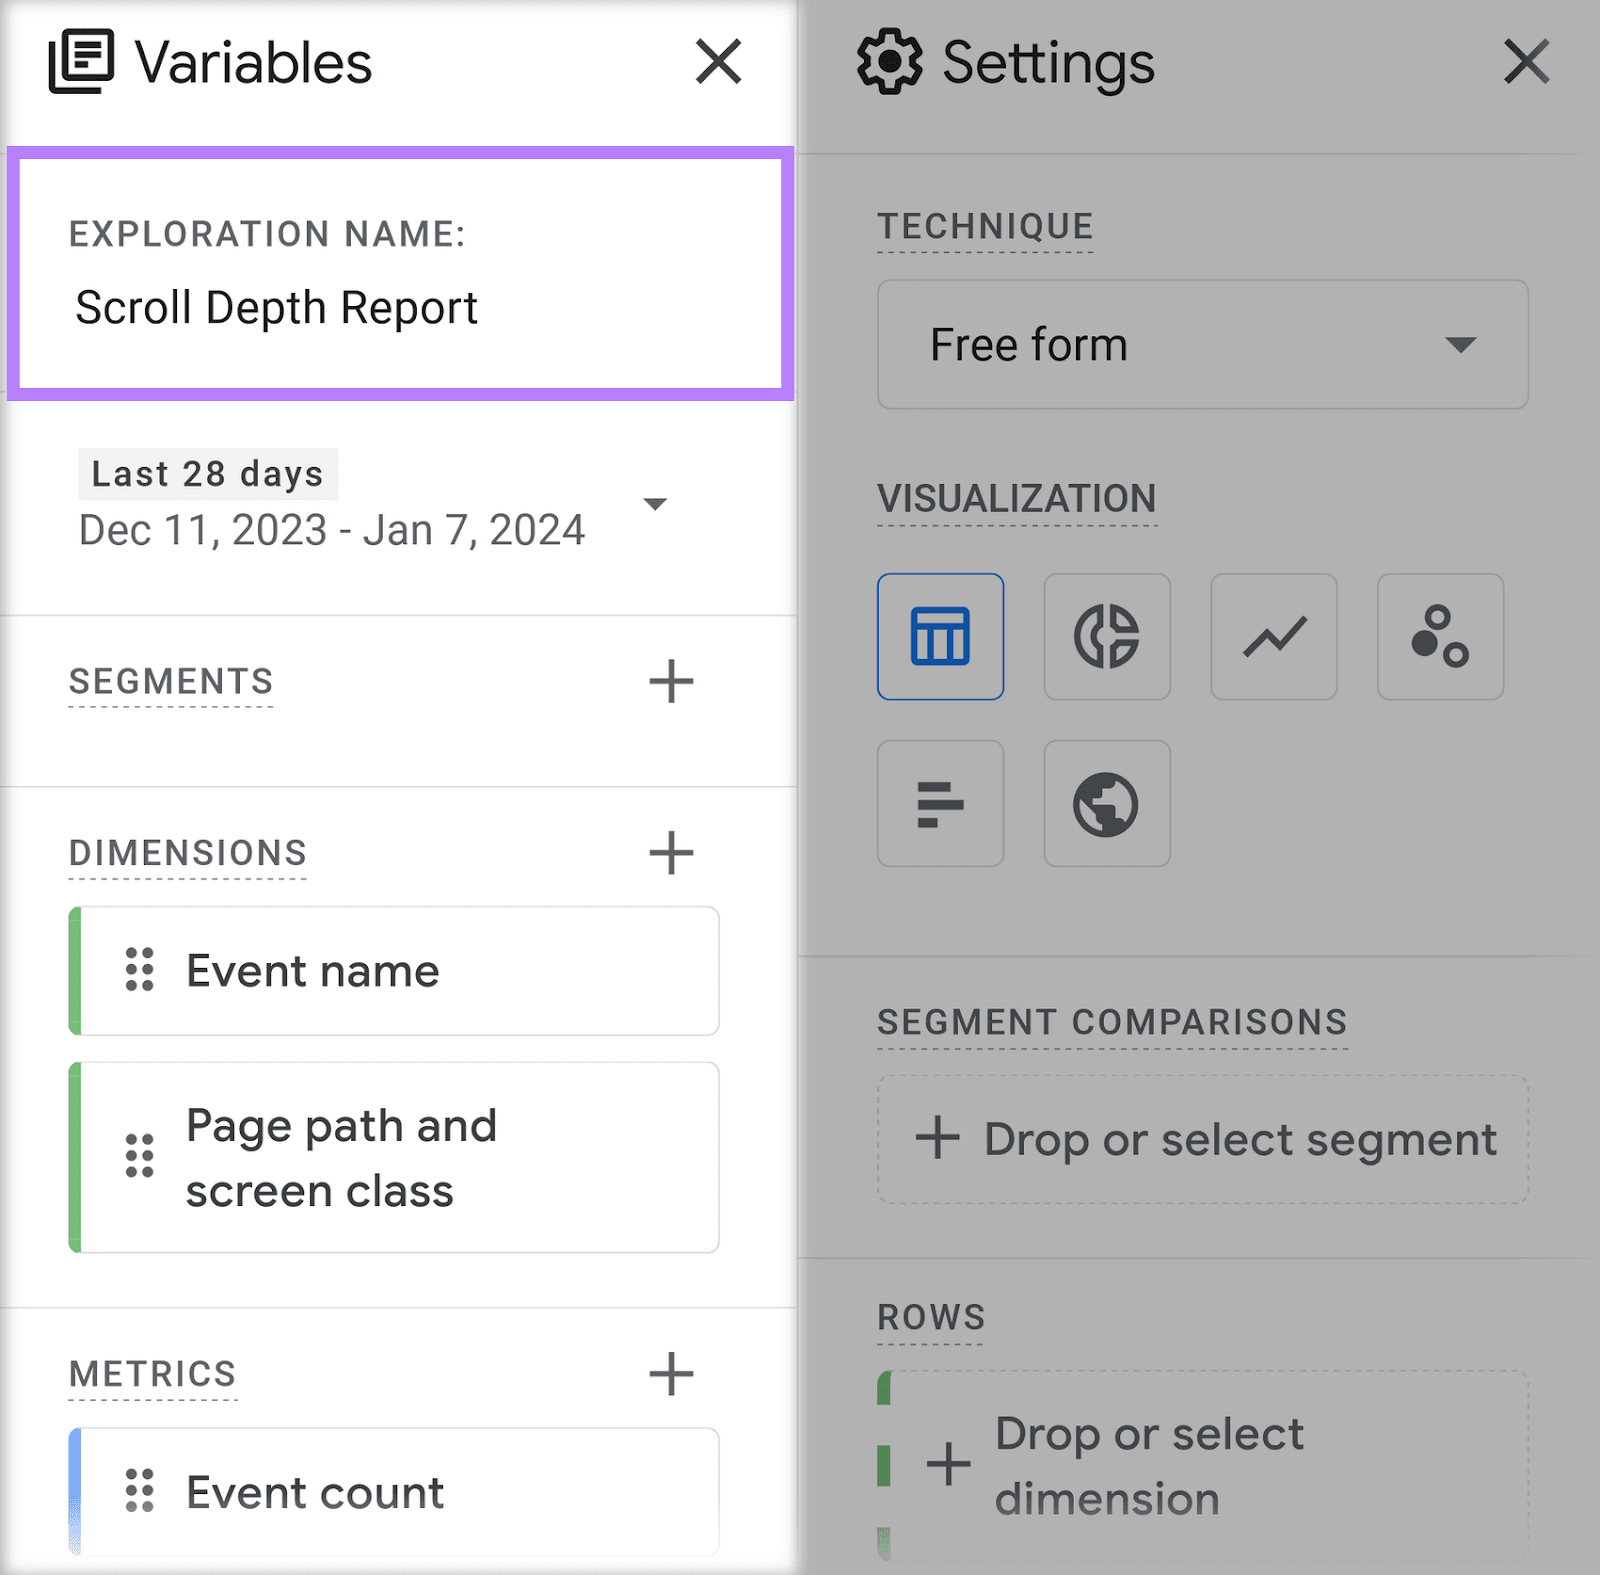
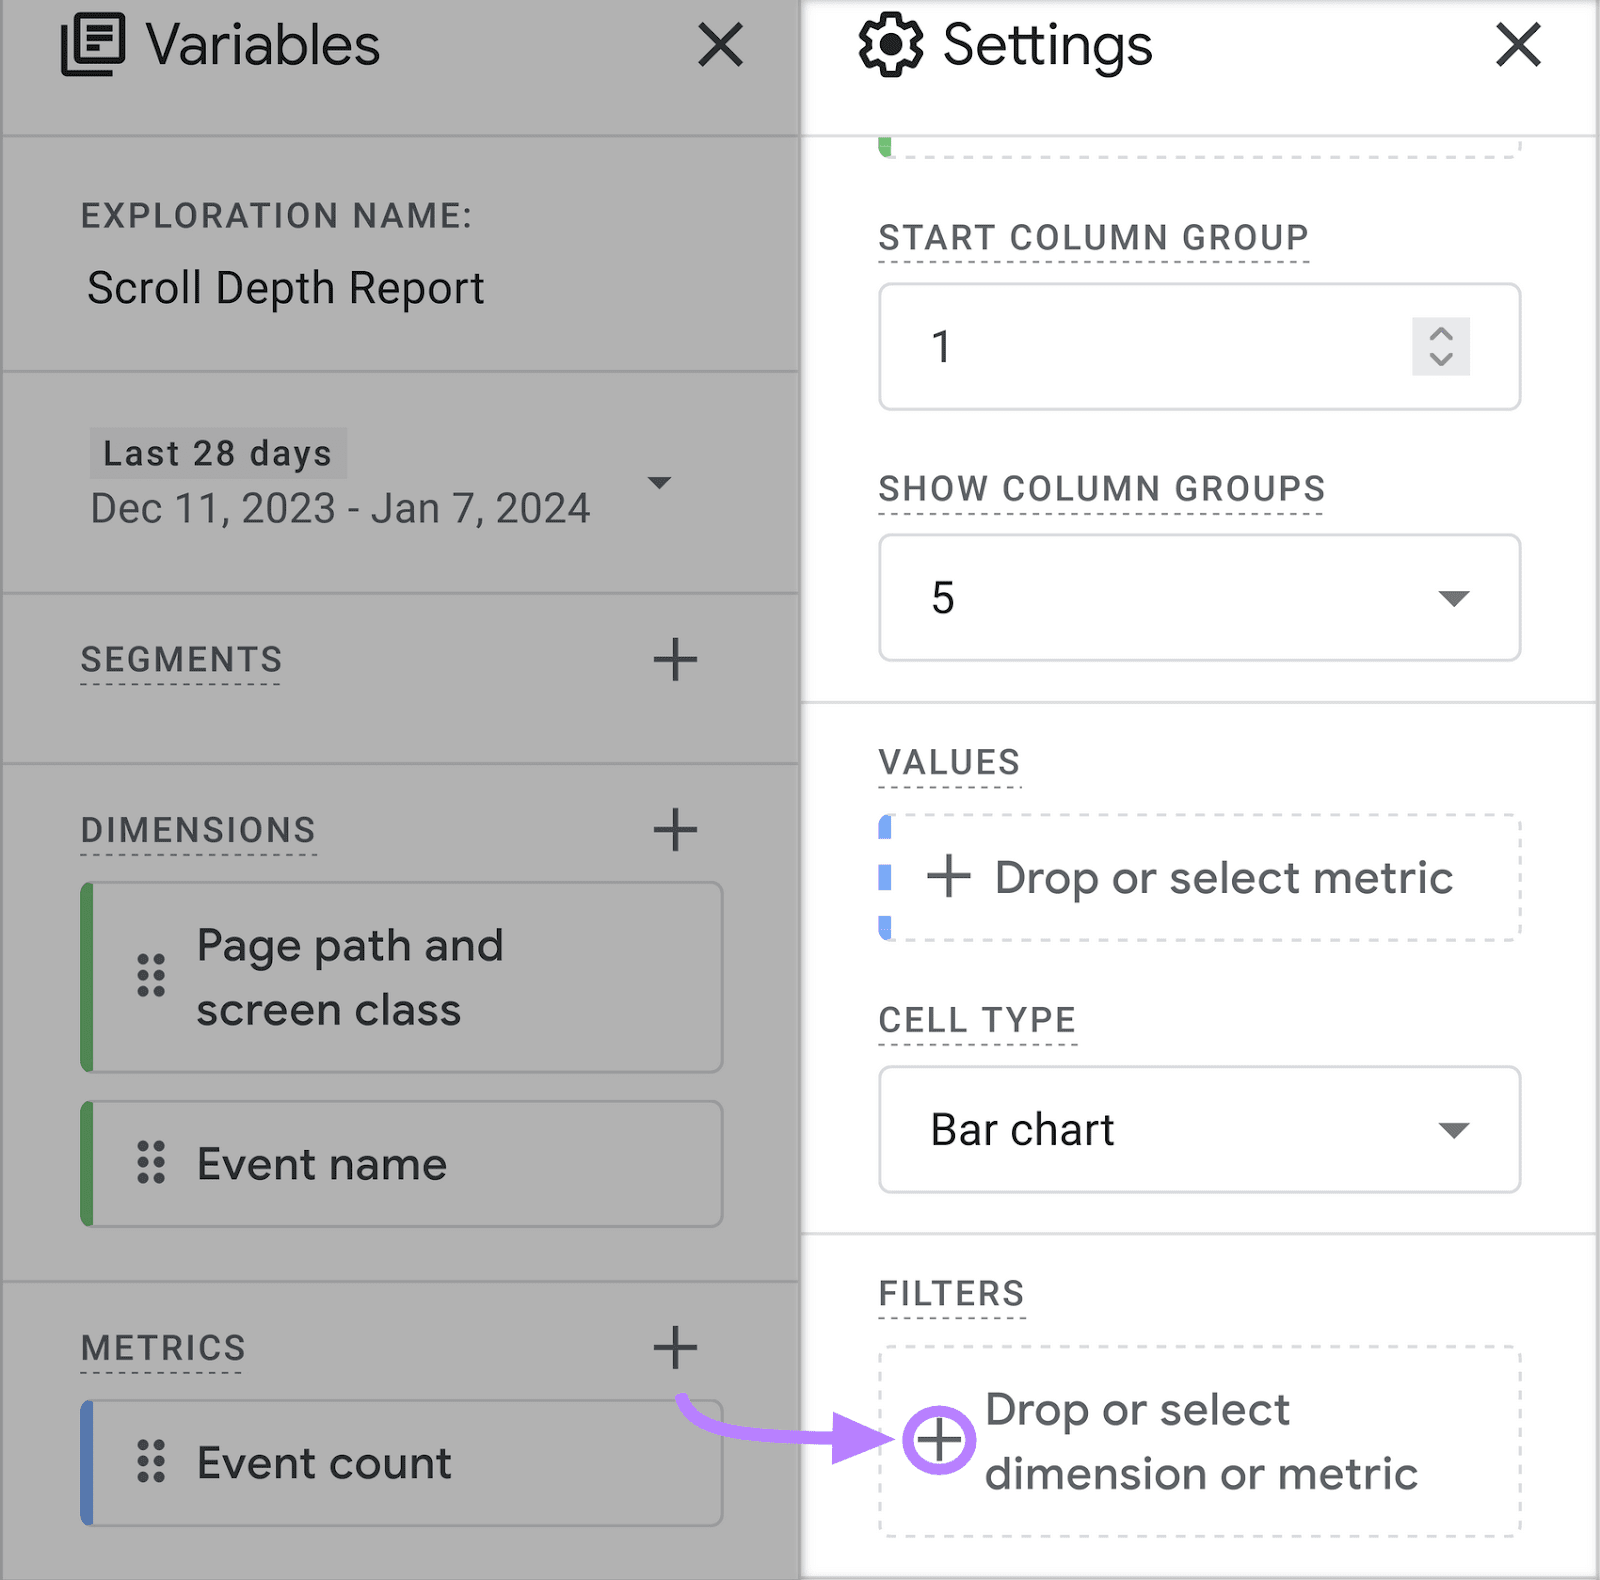
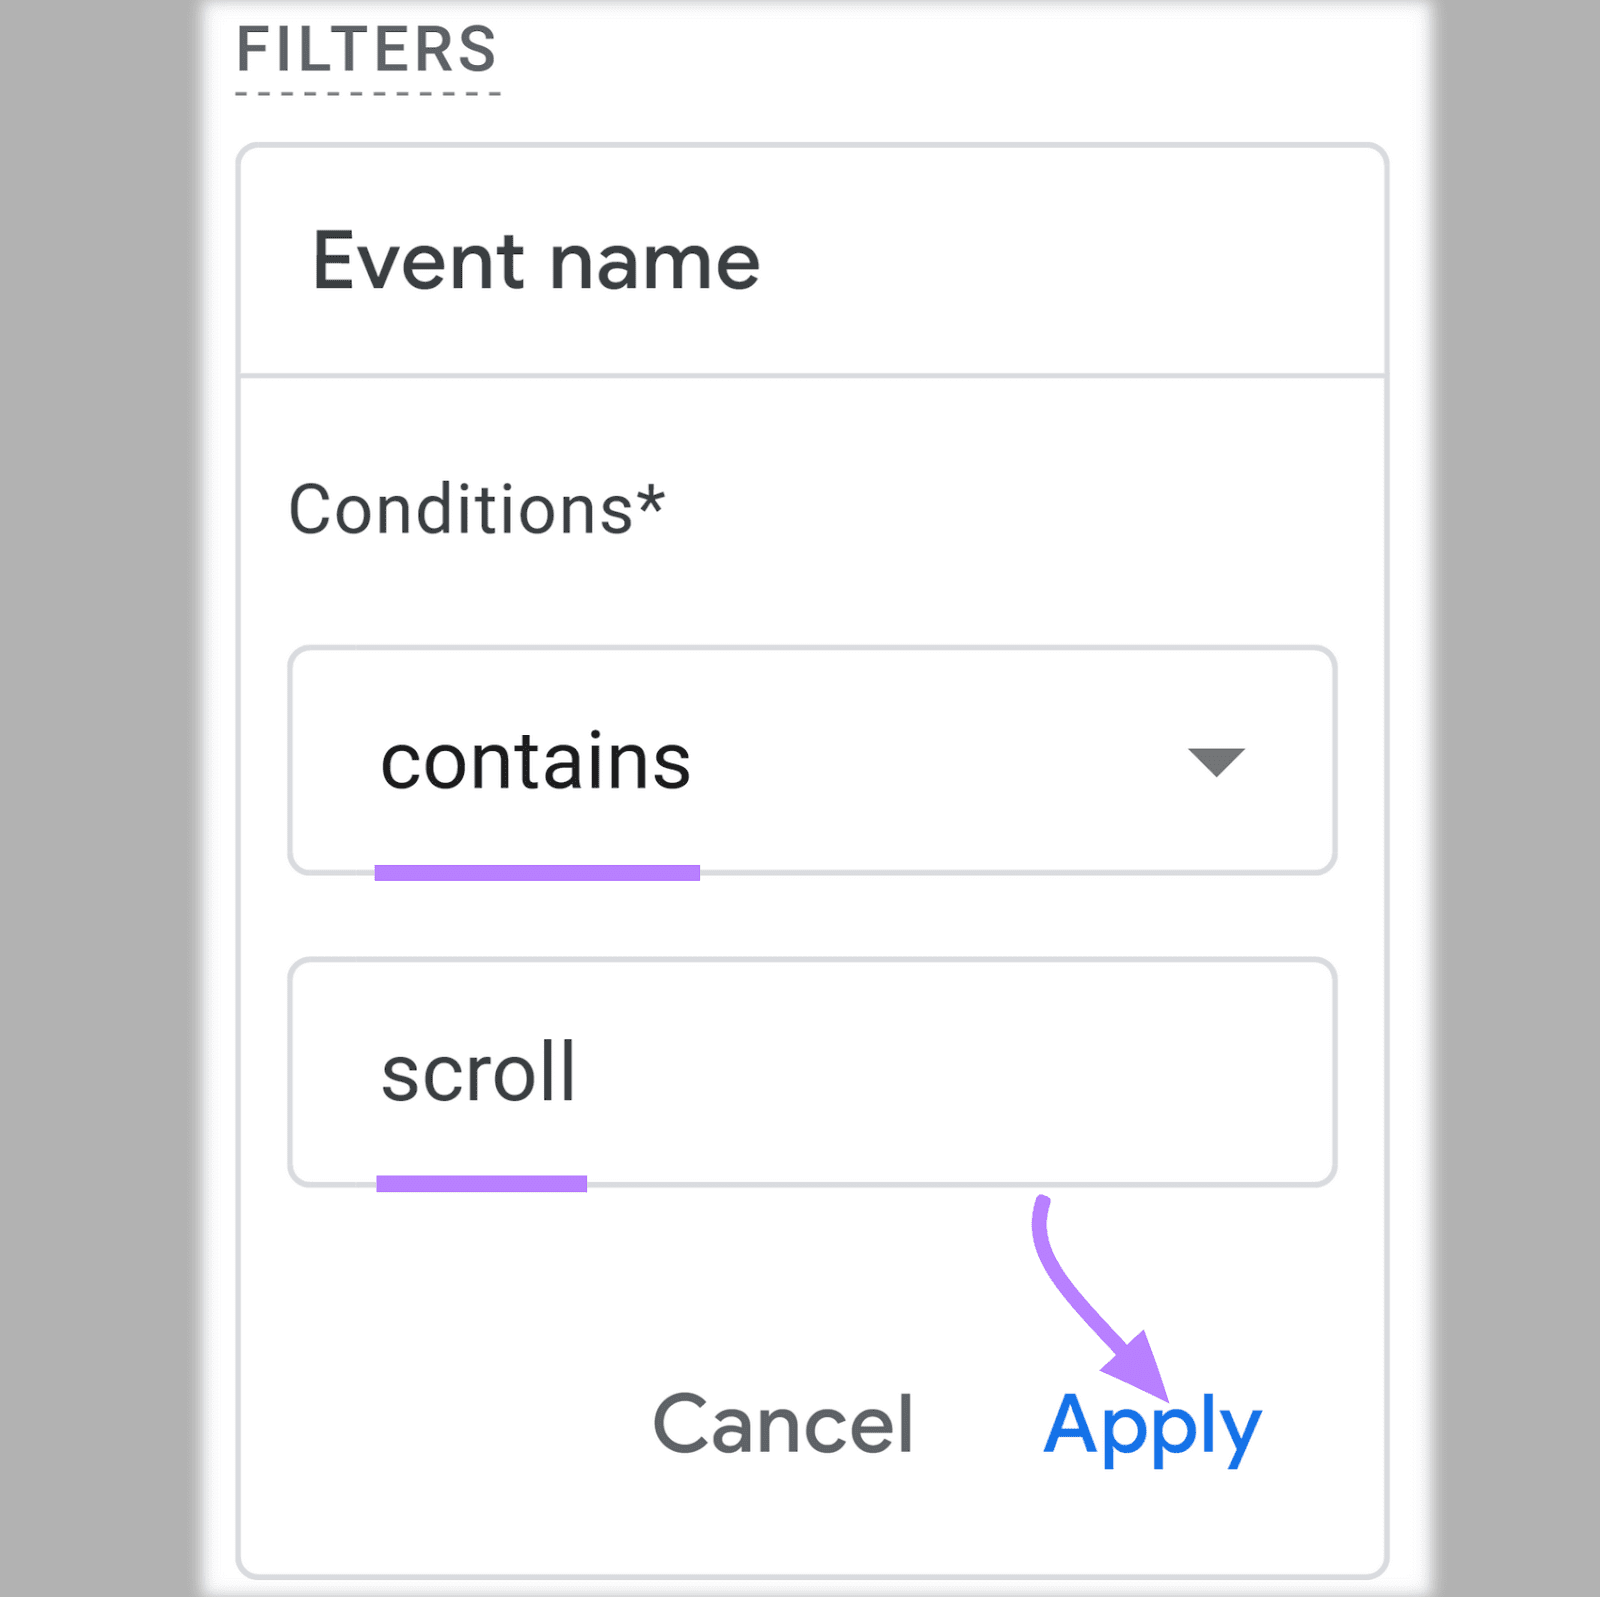
Now, it’s time to add a filter to look at scroll events. To do that, look within “Settings” and click on the “+” below “Filters.”
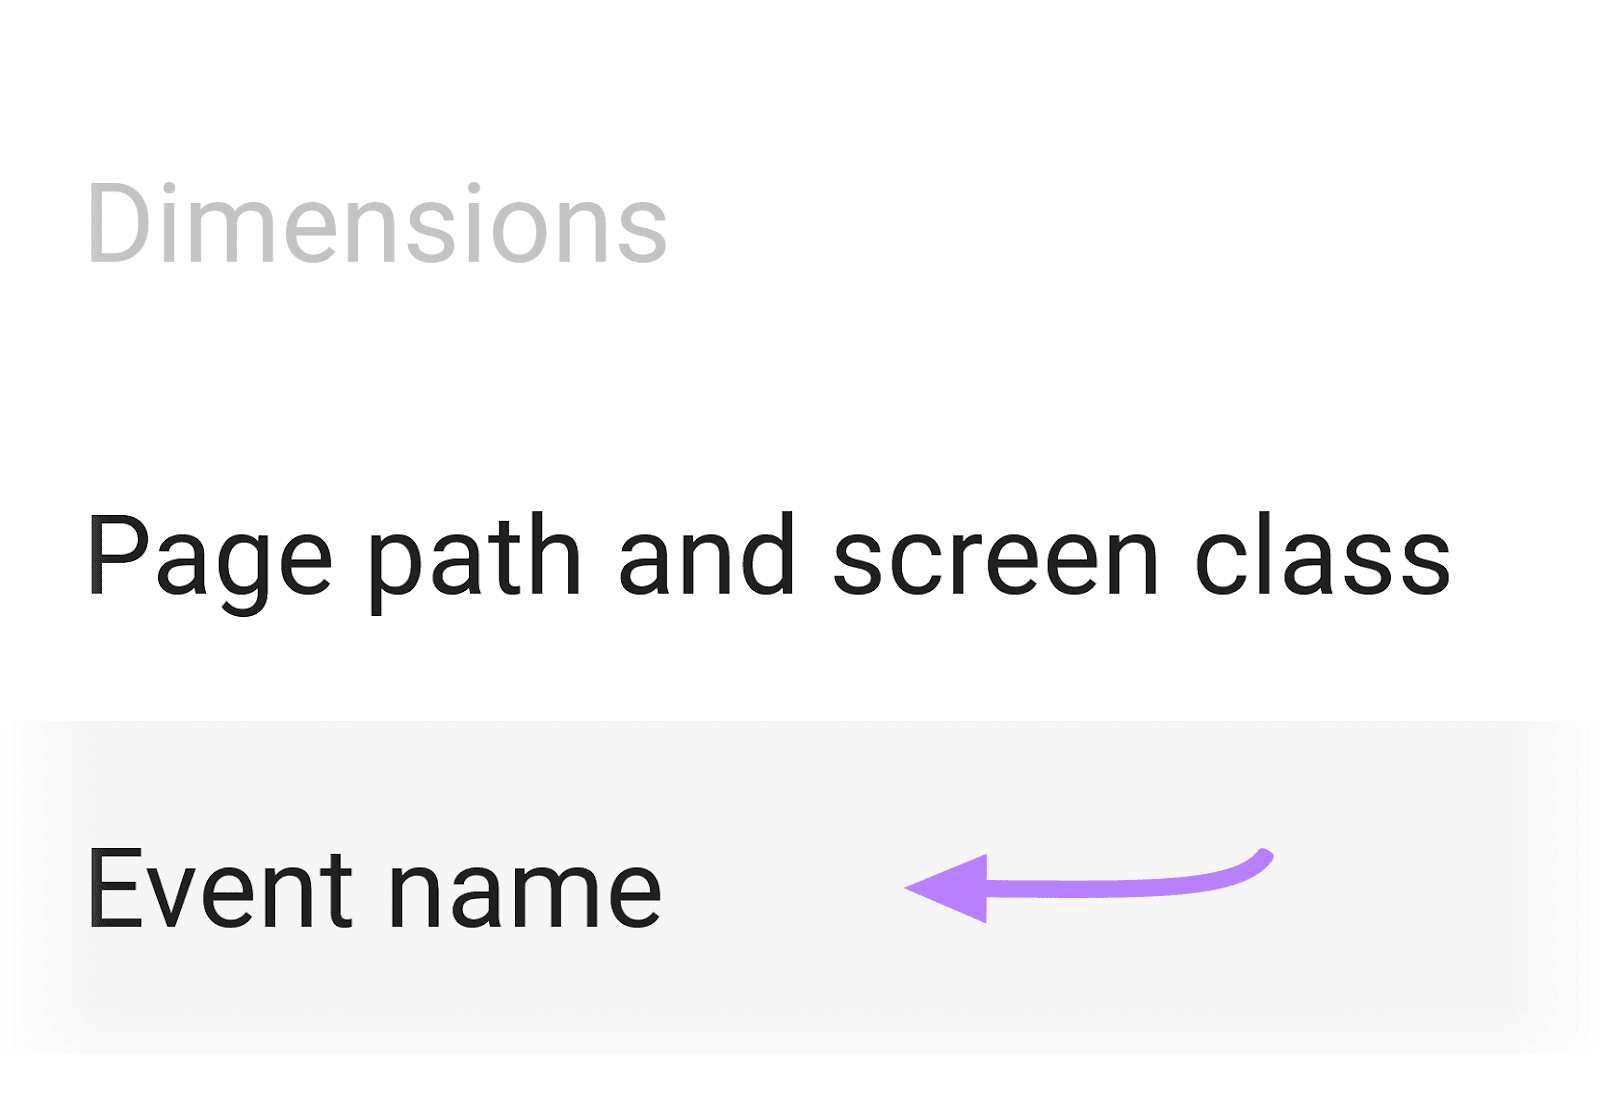
You’ll see the two dimensions you’ve imported. Choose “Event name.”
Now, you can set the conditions of your filter using two fields.
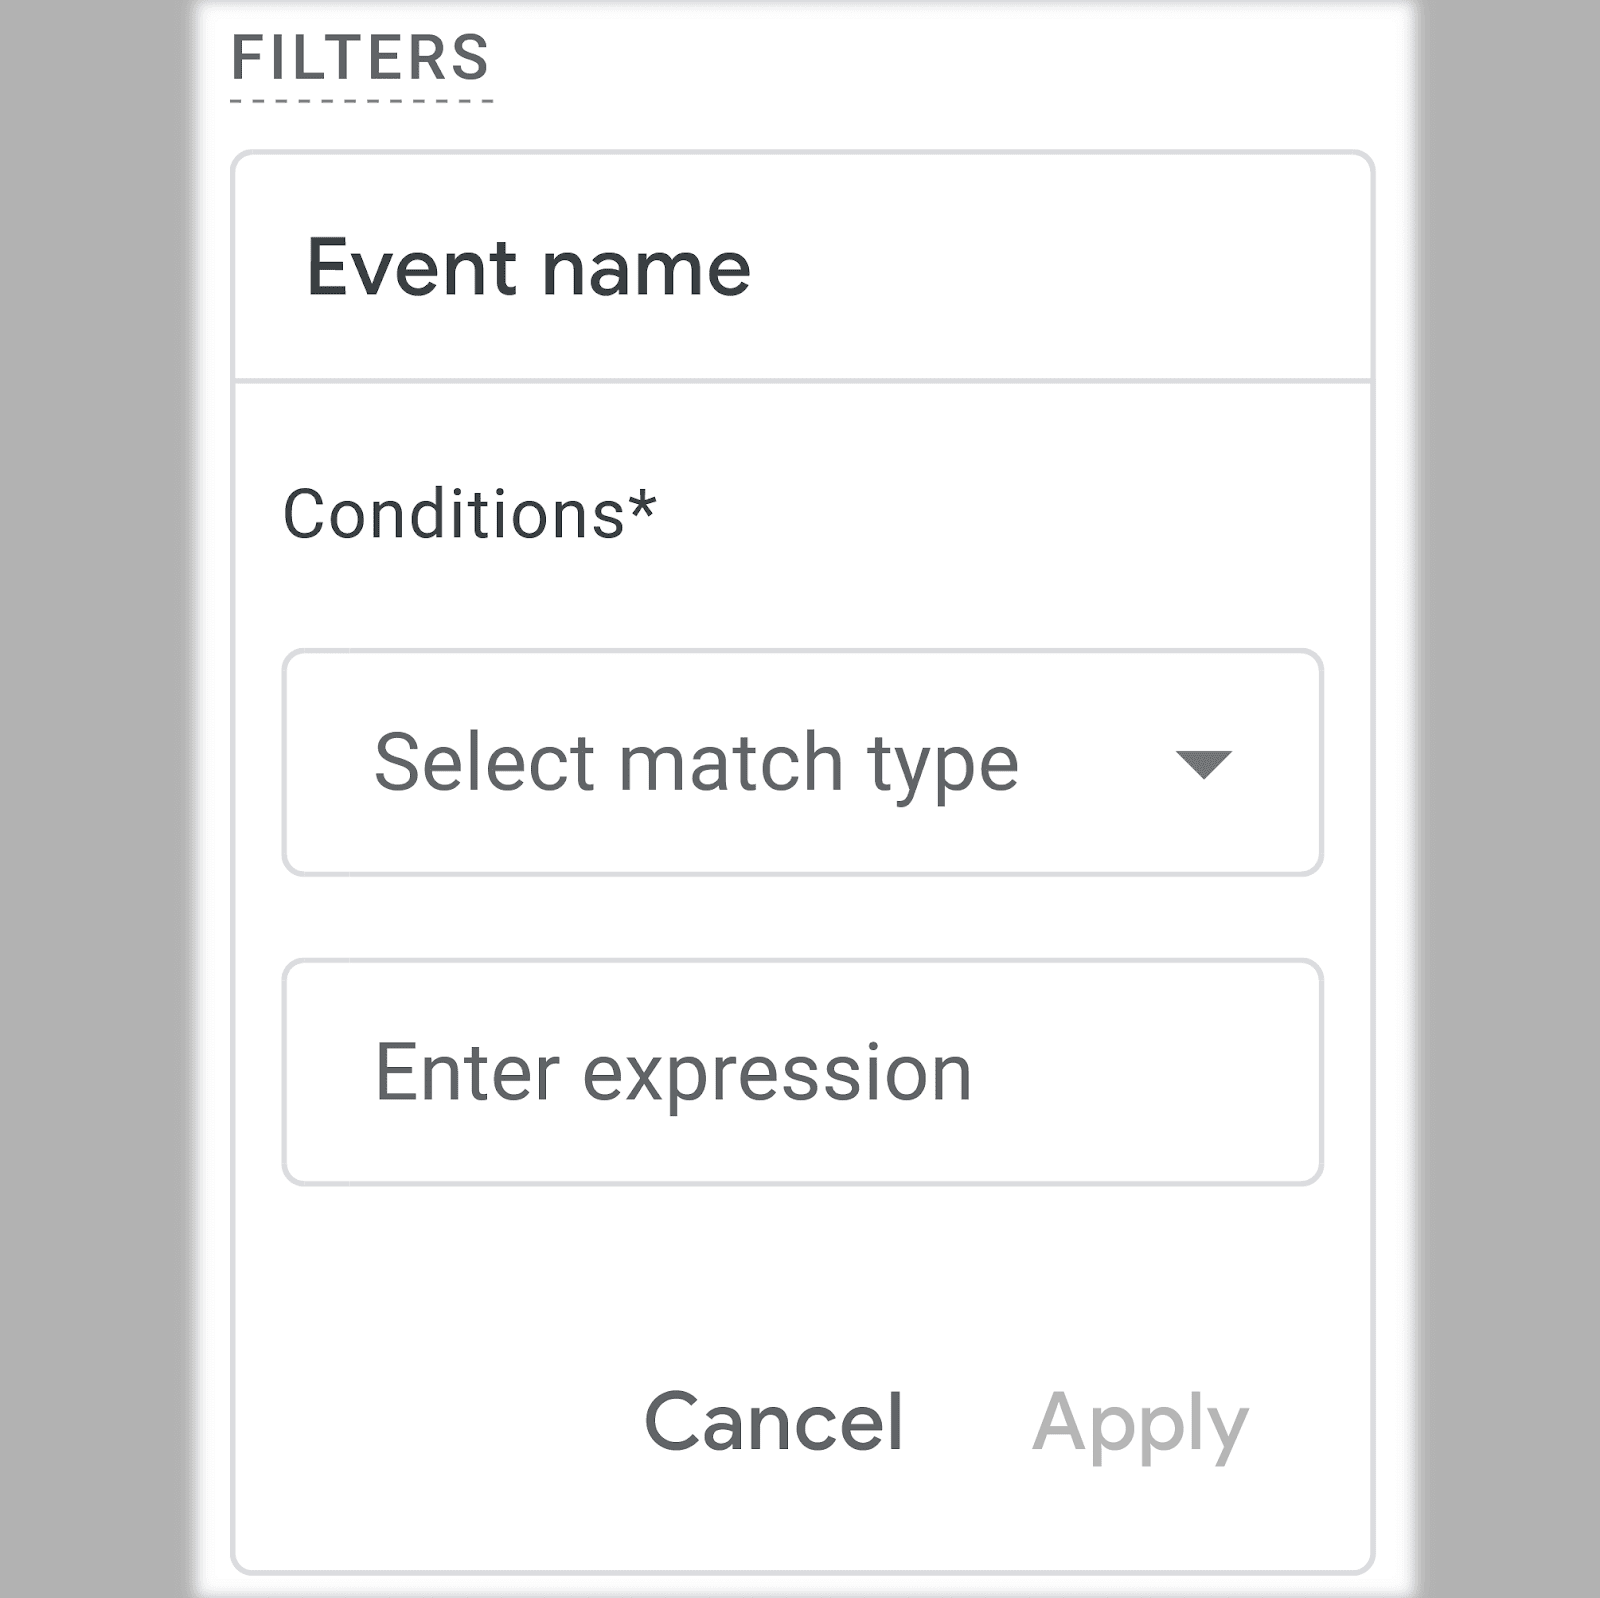
Choose “contains” as your match type in the first field. Select or type “scroll” in the second field to include all of your scroll events. Click “Apply.”
The last step is to add your data to your report. To do that, double click on each of your two dimensions and your single metric from the “Variables” section.
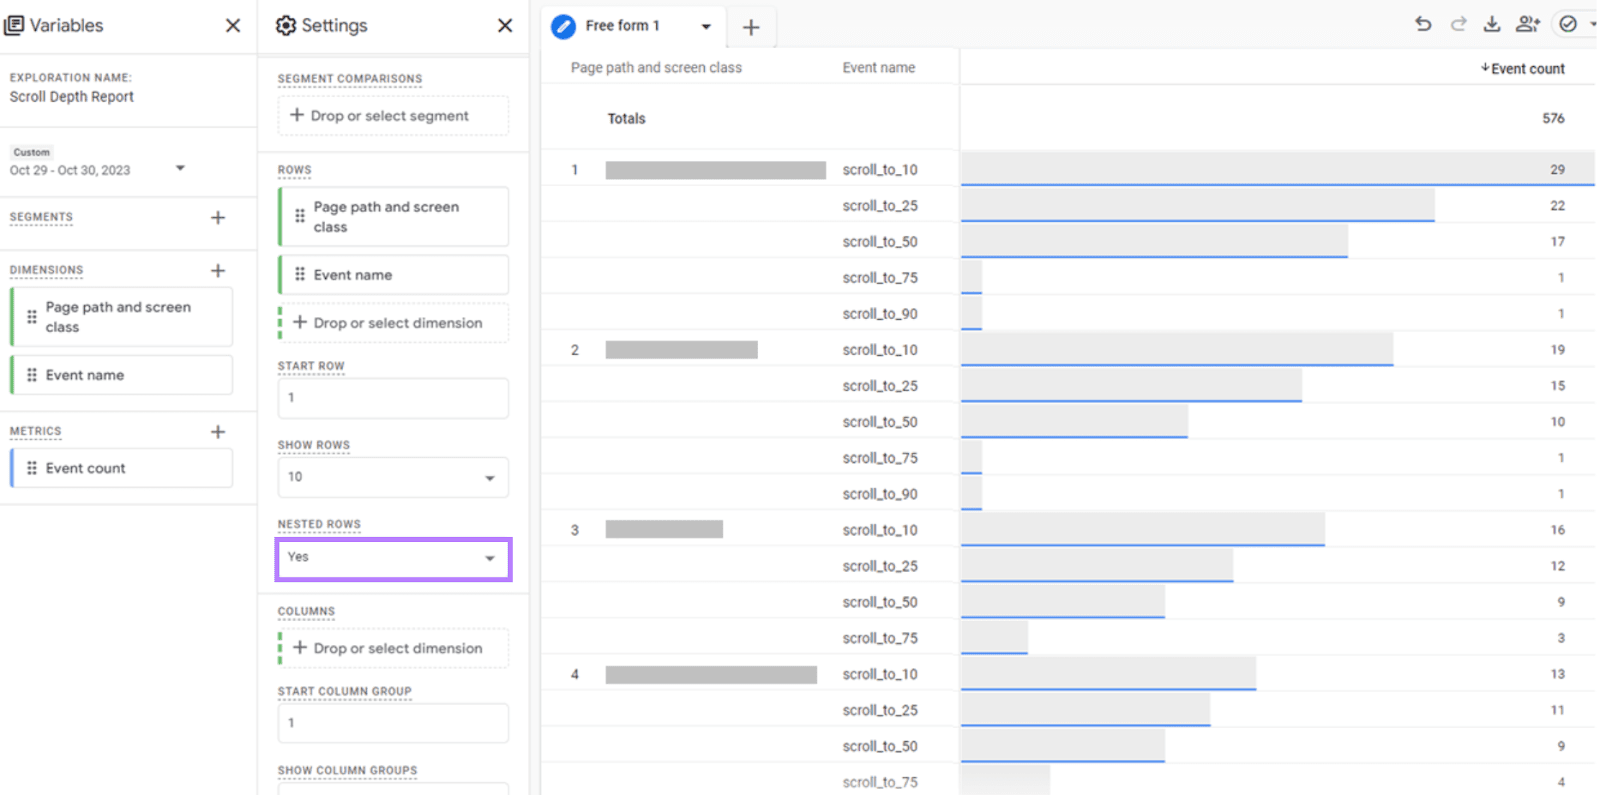
Finally, change the “Nested Rows” drop-down from “No” to “Yes” to organize your data at the page level.
Let’s now look at three ways you can use your data.
You can uncover page-specific insights to improve performance by comparing scroll data at different thresholds.
Let’s say you’re a marketing manager for a B2B website and you rely on your blog to help generate leads. You’re interested in the performance of the specific articles on your blog.
You track scroll depth at 10%, 25%, 50%, 75%, and 90% and you use that information to find places to improve.
Here are three ways you can do that using the report you’ve built in the previous section.
Learn from Your Top Pages
You can identify structure and layout patterns in your top performing content that you can apply to other articles.
When you analyze your top four articles by total page views, you notice that the first and second have significantly more readers at the beginning of the article. You look at the scroll_to_10 event counts to see they are more than twice as high as the third and fourth articles.
And yet the scroll_to_75 event counts for the third and fourth articles are more than three times as high as the first and second.
Why are your top two articles getting more views in total, but fewer people are making it all the way through them?
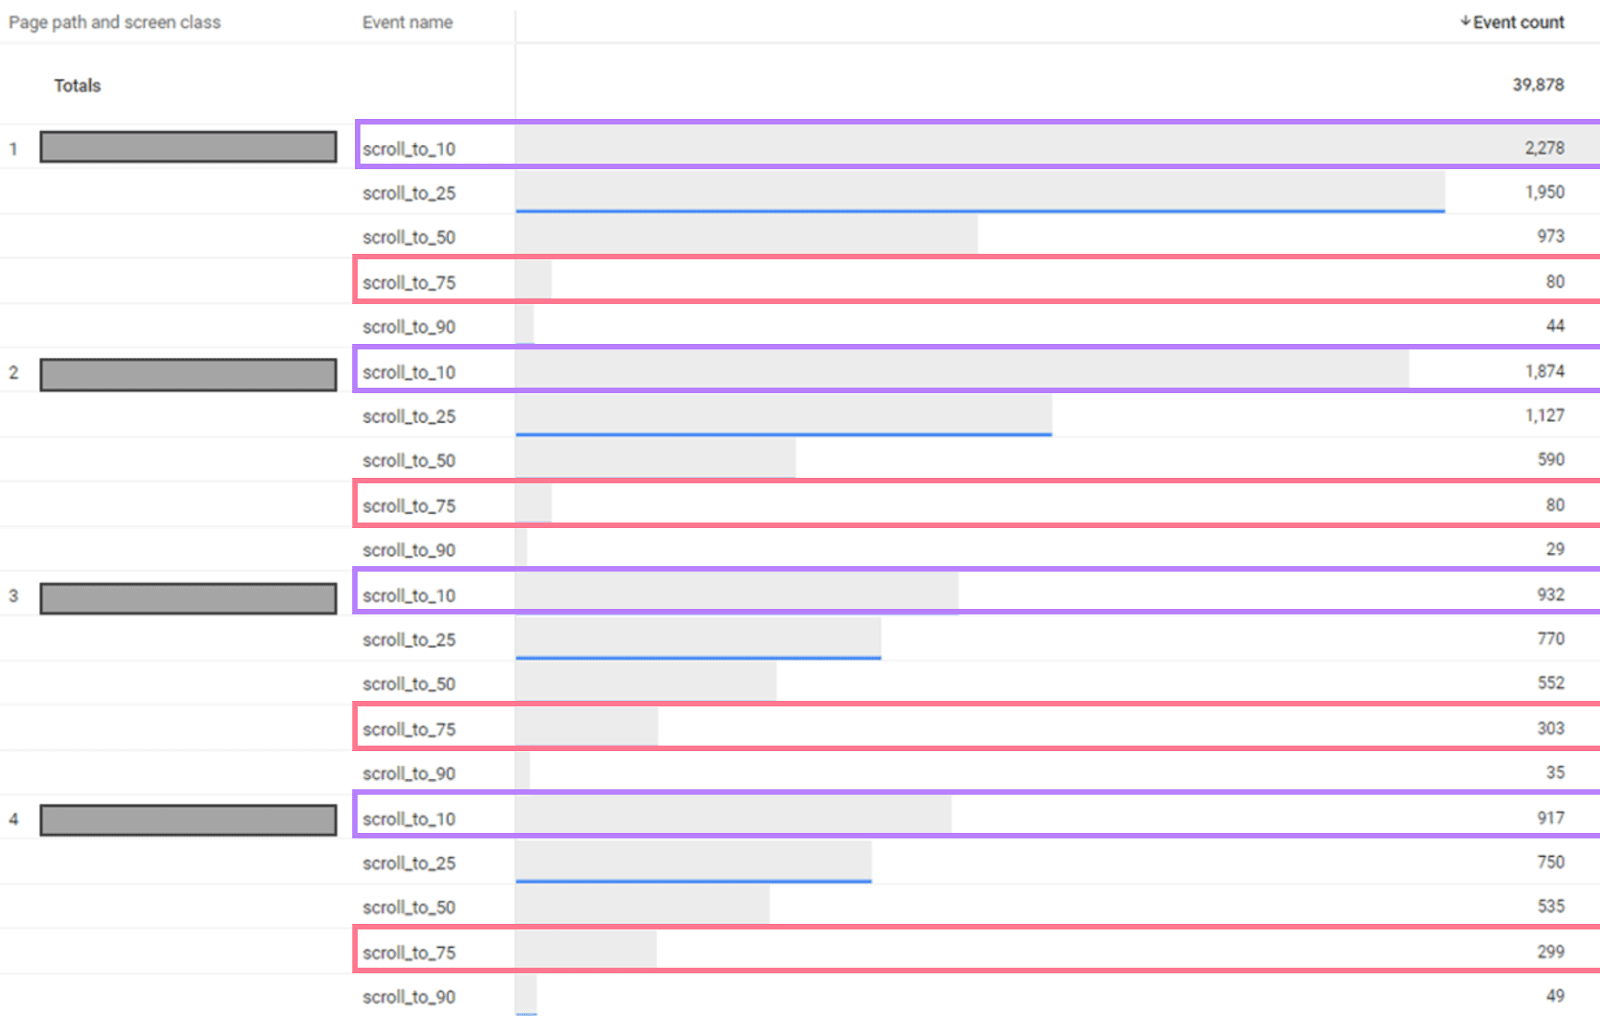
You review all four pages and see that your third and fourth best articles have significantly more images than the top two. They also feature shorter paragraphs and more white space.
In contrast, the first and second articles are visually dense without as much white space. You surmise that the layout and structure may be holding your readers back from getting all the way through.
You plan to revise the first and second articles and measure results. If you get the results you hope to see, you can continue to roll out the changes in other pieces of content.
You could also use Semrush’s Keyword Magic Tool to see if there are any keyword opportunities to improve the ranking potential of the third and fourth best pages. You know your audience is finding them helpful. So, optimizing them for other relevant keywords could improve their overall performance.
Understand Where You Need to Improve Introductions
You can also compare the number of scroll_to_10 events with the number of scroll_to_25 events to understand how well your introduction is grabbing attention and motivating your visitors to keep reading.
You compare your average ratio for all articles to the same ratio for new articles. You do this by dividing the number of scrolls to 25% by the number of scrolls to 10%, then multiplying that by 100.
You know that your overall ratio is just over 80%, and you’ve just published a new article that is performing slightly worse than normal. You get this number via the sum: (15/19) x 100 = 78.9%.

You want all your new articles to hit an 80% or higher ratio. So you ask your content team to revise the introduction to make it even more compelling.
If you find articles with very few people getting past 10%, you might have a real issue with content quality. Or you might have a title tag and meta description that don’t accurately reflect the content.
You know that if more readers get beyond the introduction, there will be more opportunities for them to see your call to action (CTA) and consider becoming leads for your business. So you prioritize updating the introductions, titles, and meta descriptions of articles with very few people making it past 10% scroll depth.
Find Opportunities for Multiple CTAs
You can compare the number of scroll_to_25 events with the number of scroll_to_75 events to understand how engaged your readers are in the main body of your article.
This matters because you typically place a single CTA about halfway down the page. But you know some of your content maintains readers’ interest better than others. And you want to test two CTAs in those most engaging pieces to see if it boosts conversions.
To find those test subjects, you compare your average ratio for all articles to the same ratio for individual articles.
You know that your overall ratio of scroll_to_25 events compared to scroll_to_75 events is 40%.
Here is the article you’re analyzing. Instead of your normal 40%, this article has a 75% ratio (6 / 8 = 0.75. Multiply it by 100 to get 75%).

This would be an ideal candidate for testing an additional CTA, as your scroll depth data shows it’s a particularly engaging piece of content.
More Ways to Act on Your Data
Taking action with your scroll data is one way you can improve your website’s performance.
And you can use scroll depth data alongside insights from tools like Semrush to take things further.
Semrush’s Project Dashboard can help you manage the health of your website so you can put your best digital foot forward. Fast-loading, error-free sites are better optimized for search engines and more likely to keep your audience scrolling and engaged.
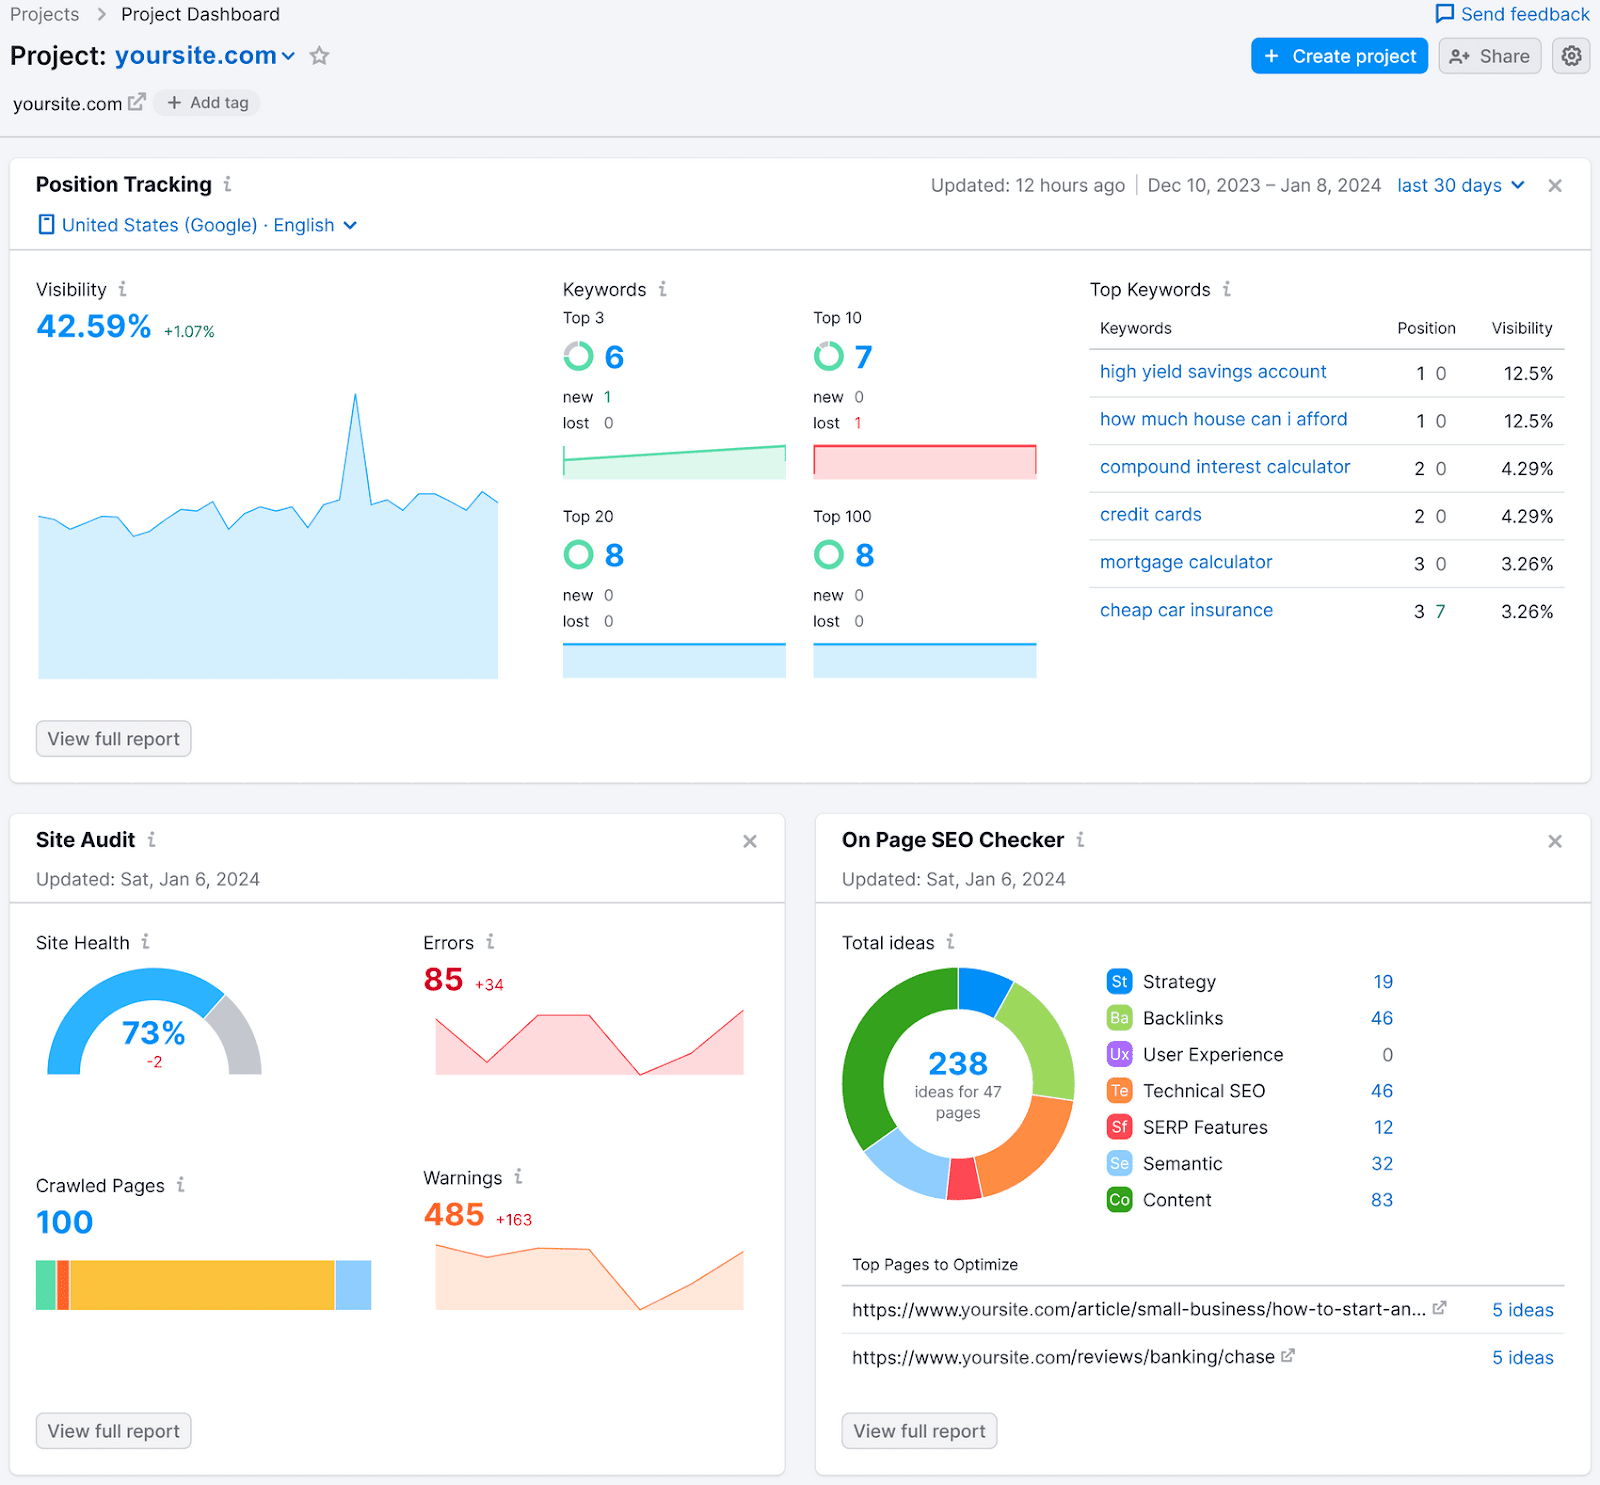
And you can integrate this with other digital platforms like Google Analytics. So you can learn more about how to improve your top content.
For example, Organic Traffic Insights shows your top landing pages from Google Analytics combined with keyword data from Semrush and Google Search Console.
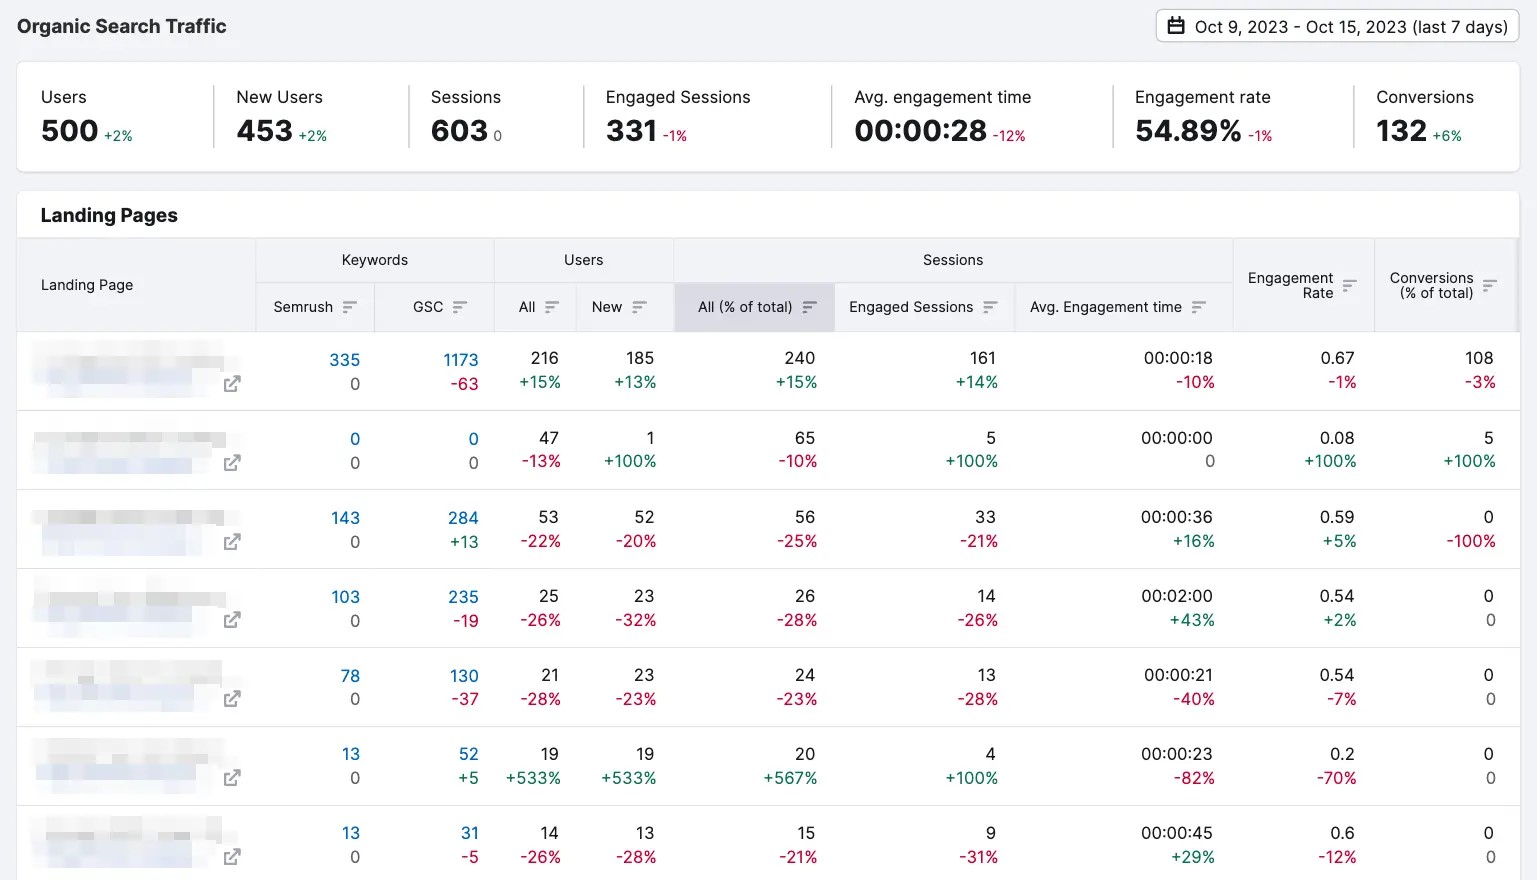
You can use it to prioritize your efforts to focus on ranking your most important pages. So you can improve your ranking potential while also making scroll data-informed content enhancements.
Are you ready to try out Semrush to get more data you can act on? Start your free trial today.
Source link : Semrush.com
