Posted by
Laura Campbell
We are excited to announce that our recently rolled-out SERP Features Tool data is now available in the Insight Graph. The inclusion of these search metrics enables you to analyze Google’s SERP Features in a newly profound and customizable manner.
Google SERP Features: Desktop
Presentation and **** Flexibility
Available as part of our Enterprise package, or as a standalone addition to our other marketing platform plans, the inclusion of the data from our SERP Features Tool in the Insight Graph allows you to analyze the presence and trends of SERP Features in a flexible fashion.
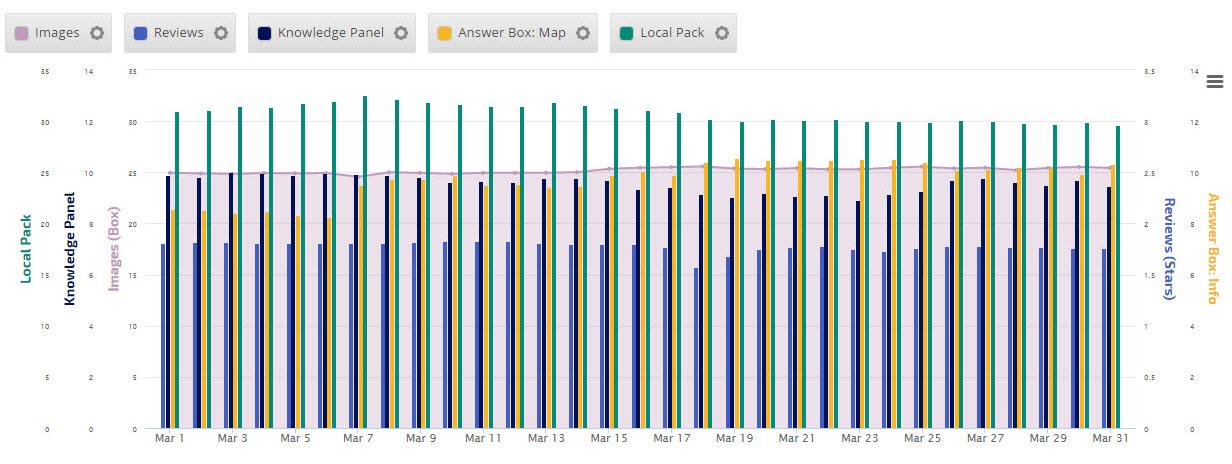
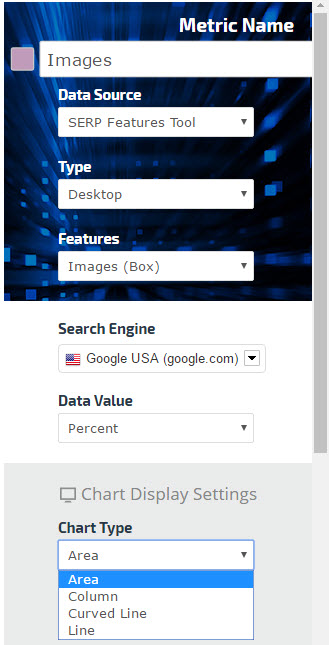
Plotting SERP Features data in an Insight Graph enables you to trend and layer with an array of presentation options such as line, area, column, and curved line graphs to create a dynamic data expression. The above example shows columns indicating the presence of Google’s Knowledge Panel, Answer Box: Map, Local Pack, and Reviews. This data is expressed against the backdrop of Images (Box) displayed on the SERP, which is presented as an area graph. The result is data that is presented in a compelling and visually diverse manner.
The Insight Graph affords the ability to trend historical data over several months by setting a custom reporting period. You can easily track SERP Features data within a specific and targeted interval.
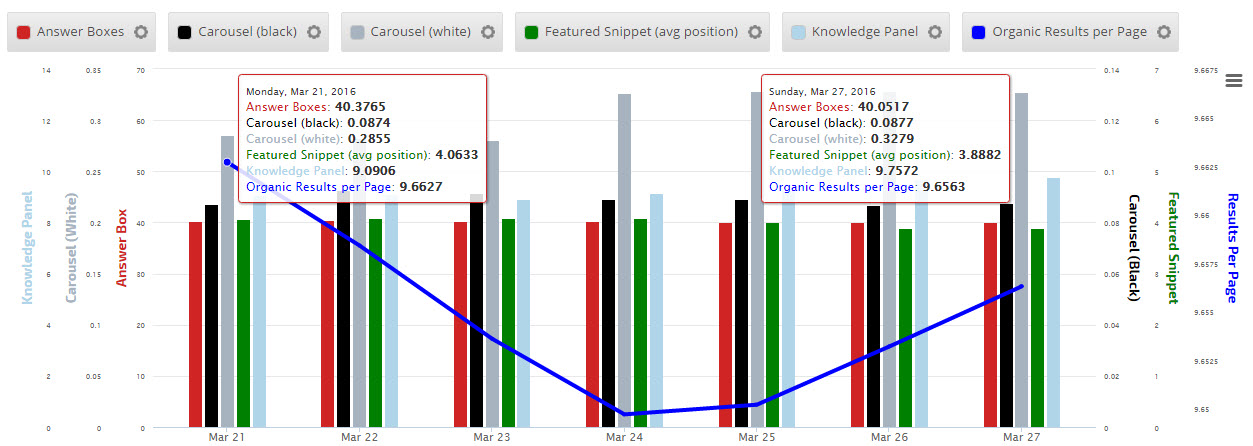
In the example below we wanted to determine if an increased presence of SERP Features has an impact on Organic Results per Page over a specific seven day period. From this brief time snapshot we can draw some conclusions, between March 21st & 27th there was:
- An increase in the presence of Knowledge Panels, White Carousels and Featured Snippets
- A very slight increase in Black Carousels
- A decrease in the number of Answer Boxes and Organic Results per Page
Aside from being able to set a specific reporting period, you’ll notice that we were able to effectively highlight the data on Organic Results per Page by including it as an intersecting line over a column graph.
Knowledge Graphs & Organic Results Count
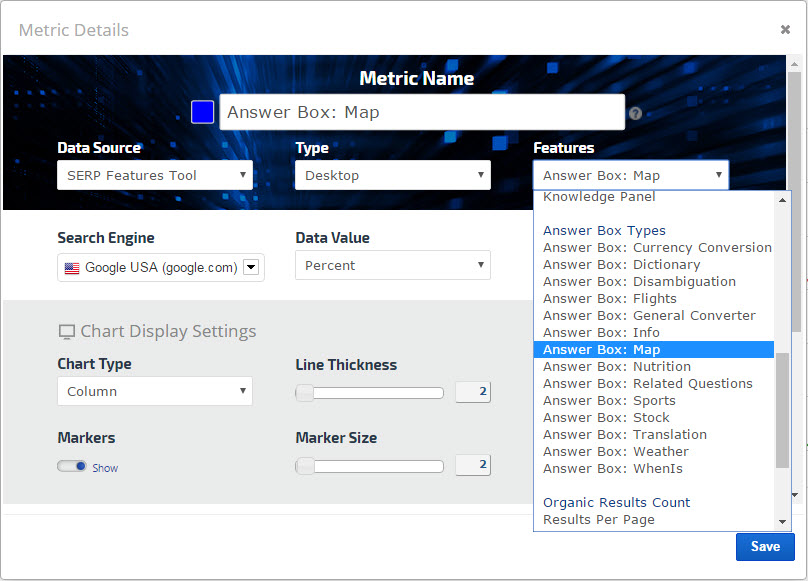
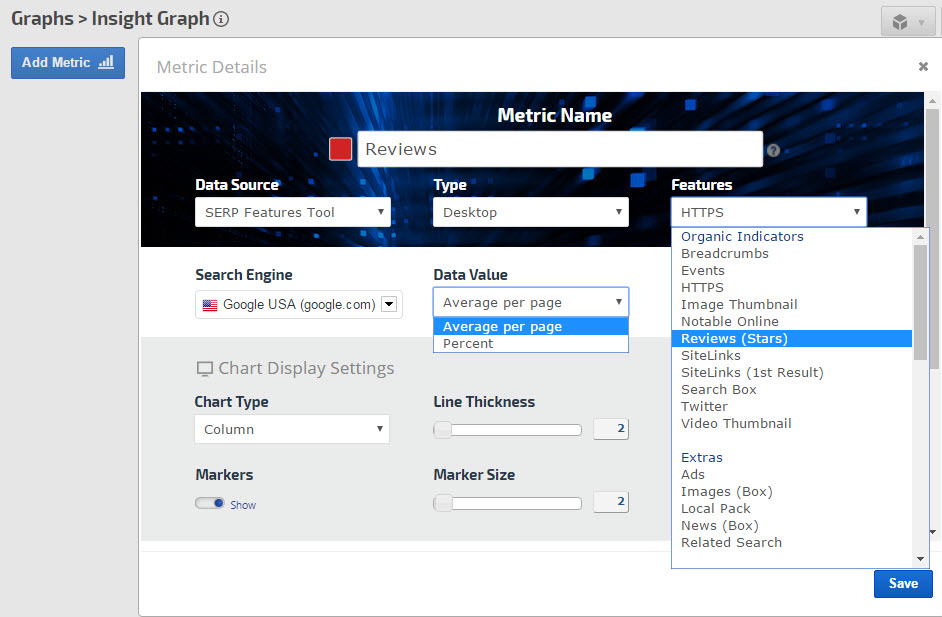
The above report is made accessible in such a dynamic way due to the inclusion of specific, not only categorical, SERP Feature data. For example, and as indicated in the Metric Settings screenshot below, not only can you include stats about the presence of Answer Boxes in search results for any Google desktop search engine, but you can select and compare specific Answer Box types since they are all available to be charted as individual metrics.
The search results reporting period flexibility afforded to you in the Insight Graph presents you with the capability to historically analyze SERP Features data over a considerable period of time. Subsequently, the ability to analyze the presence of the various SERP Features over periods such as a quarter or more are readily available for use in determining the general trends of Google’s SERP Features.
Historical Data Options
Our free Google SERP Features Tool provides a detailed daily snapshot with a customizable 30-day trend graph. The Insight Graph provides the opportunity for more in-depth research with historical search statistics ****** back to November 2015 for all of the Organic Indicators, Knowledge Graphs, Page One Extras and Organic Results Count options found in the free search results tool.
SERP Metric Options
Currently, the SERP Features add-on (and stand-alone packages) allow you to add any of the following metrics to an Insight Graph. New features will be included as they become available.
- Organic Indicators:
Breadcrumbs, Events, HTTPS, Image Thumbnail, Notable Online, Reviews (Stars), SiteLinks, SiteLinks (1st Result), Search Box, Twitter feed, and Video Thumbnail - Knowledge Graph Features:
Knowledge Panels, Featured Snippets, Carousels, and Answer Boxes and
types (e.g., Currency Conversion, Dictionary, Disambiguation, Flights, General Converter, Info, Map, Nutrition, Related Questions, Sports, Stock, Translation, Weather and WhenIs) - Page One Extras: Ads and ad positions, Images (Box), Local Pack, News (Box), and Related Search
- Organic Results Count: breakdown of the number of Results per Page
Certain SERP metrics also have options to display data either by the average number of occurrences per page or as a percentage.
Global Search Engines
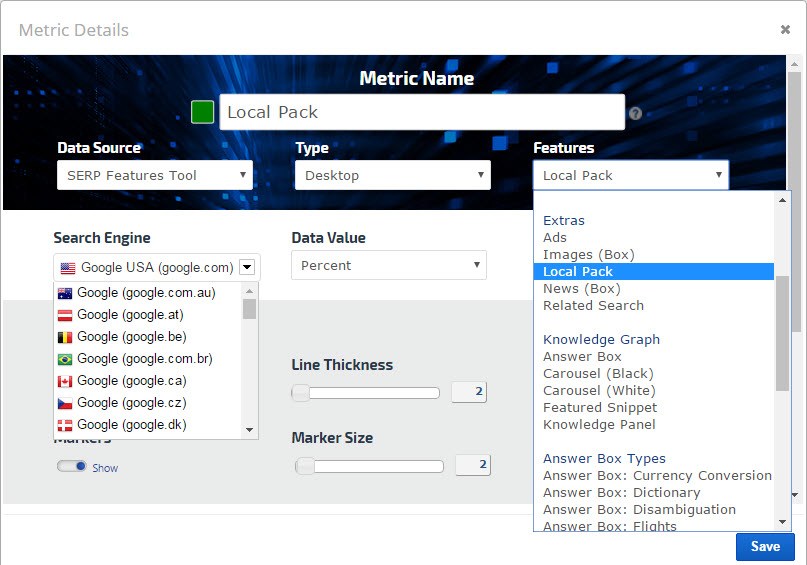
As with all of our rank tracking tools, you can choose a Google search engine in any country. This allows you to create graphs comparing SERP Feature metrics across multiple countries.
Using the daily SERP Features statistics available in our Global Search Intelligence tool, you might wish to create a search engine graph comparing the top countries for a particular SERP Feature.
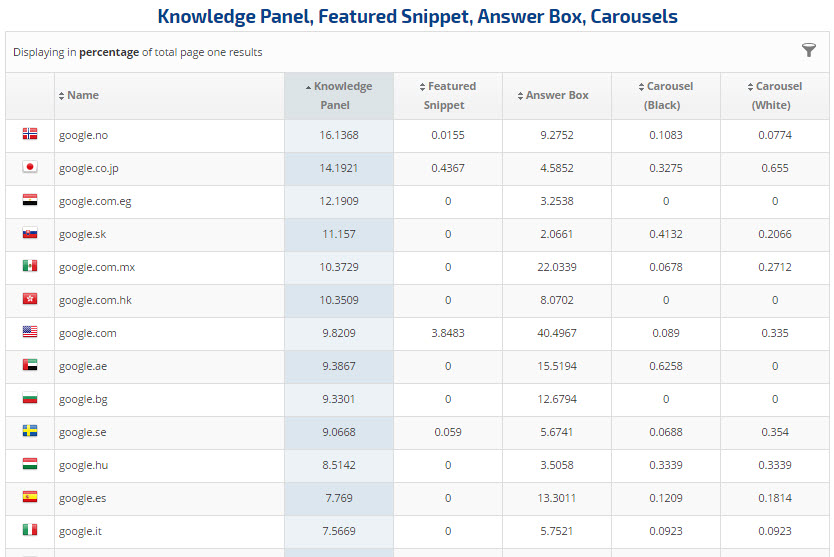
Top 5 Knowledge Graph Countries
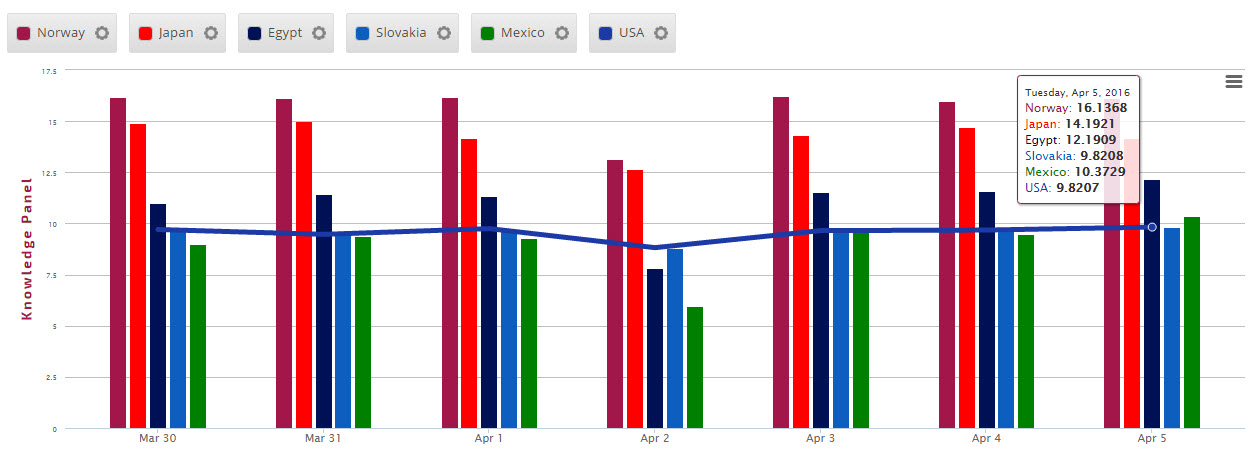
Selecting the top 5 countries with the highest percentage of Knowledge Graphs in Page One Results (from the SERP Features by Country report), this one week graph presents the top countries (columns) with a line comparing the USA’s statistics for this search metric.
White Label SERP Features Reports
The beauty of the Insight Graph is that you begin with a clean canvas and have the freedom to express not only your marketing wisdom but also your vision and creativity using a designer color palette, a variety of chart types – and, of course, our search metrics.
Once you’ve completed your masterpiece we expect you’ll want to share it with clients or managers, so we’ve made it simple for you to add your Insight Graph to a White Label Client Dashboard or PDF Report.
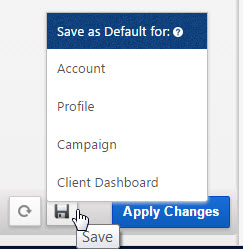
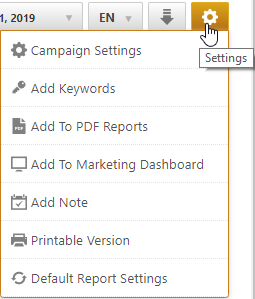
For example, this attractive Insight Graph highlights the trends of Answer Boxes that provide in-search reference tools. You can save a SERP Features Insight Graph’s settings to the Client Dashboard for this campaign using Default Report Settings, and also add it to a scheduled PDF Report by hovering over the Settings gear icon and selecting “Add To PDF Reports”.
Research to Your Heart’s Content!
With the inclusion of SERP Features data within the Insight Graph comes not only customization in display and **** but in use as well. Just as varied as the display options, are the implementation opportunities. Here is one example of how a professional online marketer might analyze and present search statistics on a practical level using an Insight Graph.
Impact of Sidebar Ads Dropped from Google Search
When Google announced their decision to drop sidebar ads in Google Search, there was much speculation regarding the potential ramifications. By blending AdWords PPC data with our Google SERP Features intelligence, there is no need to speculate for this customer as we can plainly and colorfully graph the results.
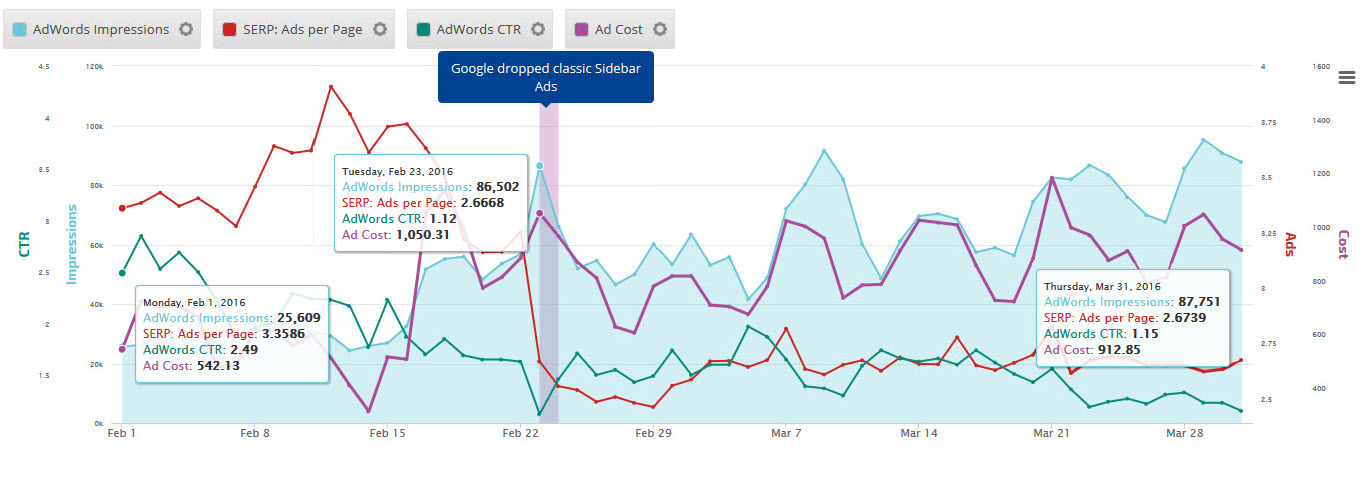
We can see a significant change in the number of Google AdWords ads per page in February. The roller-coaster begins with AdWords at an average of 3.36 per page on the 1st, peaking at 3.91 on the 12th, declining to 3.25 on the 22nd and dropping to 2.67 on the 23rd (the day sidebar ads were dropped), after which they bottomed out at 2.46 on the 29th. In March there were a few spikes that went as high as 2.82 and the month closed out at an average of 2.67 ads per page for Google USA.
The impact of this AdWords change on the advertiser site we’re analyzing:
- February 1st AdWords Impressions: 25,609, Ad Cost: $542 and CTR: 2.49
- February 23rd AdWords Impressions: 86,502, Ad Cost: $1050 and CTR: 1.63
- March 31st AdWords Impressions: 87,751, Ad Cost: $913 and CTR: 1.15
If the advertiser used the same ad copy throughout this entire period, then one might conclude that the 54% drop in CTR (click through rate) is due to the elimination of AdWords sidebar ads. Is the 68.5% increase in Ad Cost due to a rise in competition because less ads are displaying (on average) on page one of Google search results?
Caution!
As I’ve demonstrated, the Insight Graph is a powerful tool for analysis and presentation of SERP Features statistics. In all fairness, I must caution you that creating Insight Graphs and playing with the historical trends of Google SERP Features throughout the world – or even in your own backyard – can be fun and addicting. Contact us if you’d like to gain access to this Insight Graph add-on or to subscribe to a stand-alone research package.

