We’ve tackled the three Core Web Vitals in our previous article on optimizing for Google’s Core Web Vitals update. However, we cannot talk about Core Web Vitals without a deep dive into one key factor: LCP, also known as Largest Contentful Paint.
In this guide, we’ll explore what LCP is, why it’s important, its benefits, and what improvements you can make to optimize your website.
What Is LCP and Why Is It Important?
LCP is short for Largest Contentful Paint. LCP is a measure of page speed; it tells you how long it takes for the main content of a webpage to load (basically when the page becomes readable for the user.)
LCP is pretty integral to the user experience. Users don’t generally want to hang around and wait for a site to load when they could immediately get a better experience elsewhere.
If your LCP is poor, you could be experiencing a higher bounce rate, and your overall rankings could be taking a hit. Bad LCP can even lead to a lower conversion rate — not good for budding businesses.
Thanks to Google’s Core Web Vitals update, LCP is becoming a more significant factor for your rank on the SERPs. To keep ranking organically and maintaining those visitors, it’s super important to stay on top of your LCP.
LCP only applies to the main content above the fold. That includes any images, videos or blocks of text that show up without the user having to scroll down to find them. Keep this in mind when noting any problem areas.
Defining Good or Poor LCP
According to Google’s guidelines, the main content of your page should load within the first 2.5 seconds of a user’s visit to earn a good LCP. The graph below shows this in more detail:
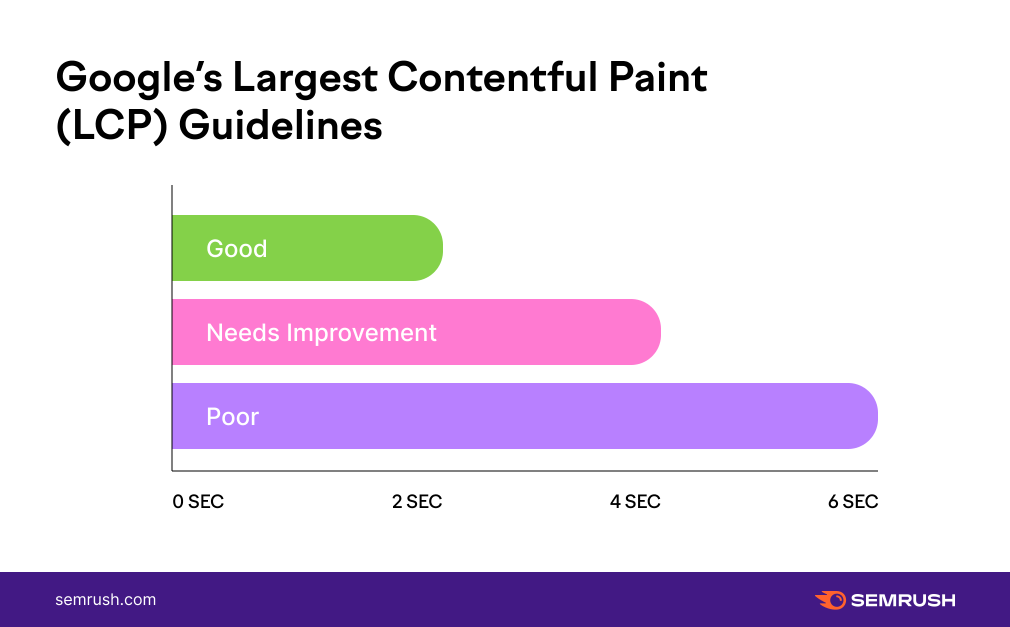
If your users have to wait five seconds or more for the main content to load (i.e., if your LCP is poor and in need of improvement), they’re very likely to give up and look elsewhere.
Google’s guidelines further specify that your LCP needs to rank as ‘good’ at least 75% of the time. If you can manage this, your performance will skyrocket.
We’ll take a look at your specific LCP in a moment. For now, let’s focus on the general causes of poor LCP and how to tackle them.
What Causes Poor LCP?
The list of what could cause poor LCP is technically endless.
It could be anything that’s taking up a lot of space: built-in media players that can slow a page down, slides of unoptimized images, social media buttons, or even widgets like the login, a newsletter sign-up form, and more.
But let’s get a bit more specific.
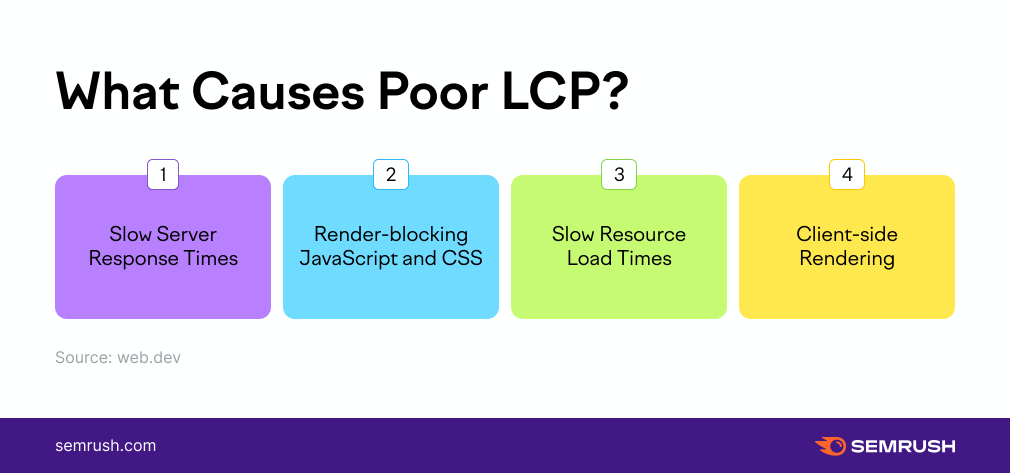
As the graphic above shows, the factors causing poor LCP often belong to four main groups:
1. Slow Server Response Times
Having a slow server response time negatively impacts all your loading speed metrics and is, therefore, a definitive cause of poor LCP.
Slow server response times are often the results of problems with your back-end infrastructure, unoptimized database queries, or API responses that are taking a long time to resolve — all happening in your site’s background.
The first step towards improving this is just making sure you host your website on a good server.
2. Render-blocking JavaScript and CSS
Although customizing your website is a great way to help it stand out, adding JavaScript and CSS to beautify your site theme and its content will unfortunately also impact your website’s loading time.
It’s sometimes a better idea to stick to a less-”heavy” site design and reduce the number of plugins you have, particularly above the fold, for the sake of your LCP.
3. Client-side Rendering
Client-side rendering (aka rendering web pages directly in the browser with JavaScript) is a pretty popular web development method.
However, it involves much back and forth for the browser to collect and load the JavaScript ahead of rendering the main content and more waiting for your user.
If you also rely on client-side rendering, this might be something you’ll want to take a look at when working on your LCP.
4. Slow Resource Load Times
Large resources or visually impactful content on a page are bound to take a lot of time to load — that’s just a fact of life.
If you have lots of unoptimized high-quality images, GIFs, and text boxes to be rendered above the fold, your LCP is going to be affected.
Read on to learn more about optimizing these things to improve your LCP.
How to Fix Poor LCP
There are a couple of fixes for poor LCP — some of which are easier than others. We’re going to take you through a few of the simpler ones here.
1. Optimize Your CSS
CSS files are resources that block rendering. Resources have to be loaded and processed before the server can render the entire page.
However, you can optimize CSS files by manually removing unused code, minimizing CSS files in use, or optimizing your CSS background images with media queries.
It sounds tricky, but there are plenty of resources and tutorials about user-centric speed metrics out there that can help!
2. Optimize Your Images
There are a few steps you can take when optimizing your images. The main ones are as follows:
- Compress your images
- Consider converting your images to more efficient formats
- Use videos instead of GIFs (they take less time to load)
- Ensure your images have the correct dimensions
And it’s always worth thinking: do I really need this image at all? Is it adding anything to my page? If not, it might be worth getting rid of it.
3. Optimize Your WebFonts
Fonts often come in large files. As a result, the text content in an uncommon font won’t show up on a page until the font file loads.
It’ll take longer for users to see essential information on a webpage! That just won’t do.
To avoid this, you’ll want to optimize your WebFonts. By reducing your WebFont size, using font-display or updating your page styling to use your custom font, the page load should speed up.
4. Optimize Your JavaScript
You write your JavaScript, get all the information you need into it, and you’re good to go, right?
Not quite. If your JavaScript has been sitting around for a while, it might be worth checking up on it because it could be costing you page load speed.
A few things you can do to optimize your JavaScript (given the newest LCP metrics) include:
- removing unused code
- checking that your code is up to **** and compatible with modern browsers
- installing modern JavaScript and reducing payloads with code splitting
Discovering Your LCP
So, how do you find out what your LCP is?
A good place to start with checking your LCP performance is to use the tools that Google has provided: the Google Search Console, Google Page Insights and Lighthouse.
You’ll find a tab for Core Web Vitals in the left-hand navigation bar in the Google Search Console. Entering this tab will show you an overview of your URLs. From there, it’s pretty easy to see where any issues may be and also what adjustments you could make to solve them.
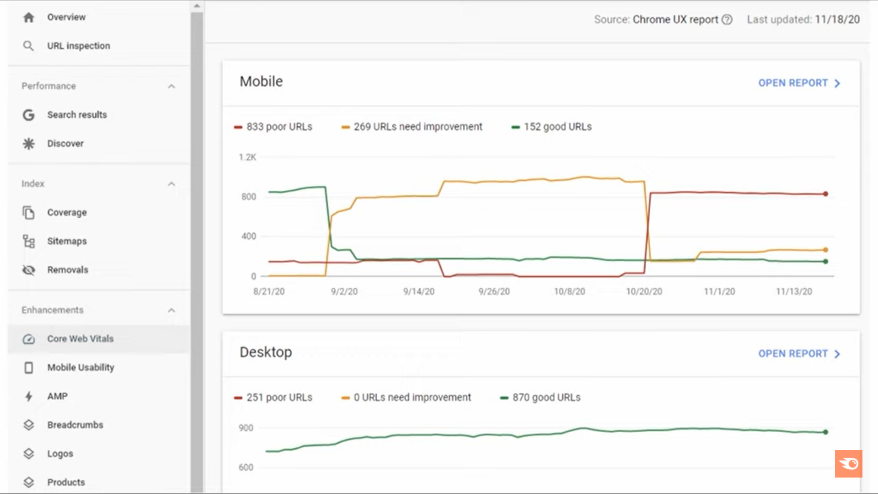
If you don’t have a Google Search Console set up for your website, don’t worry. You can also access this information through Lighthouse and PageSpeed Insights tools. If you’re new to PageSpeed Insights, you can find a full explanation of using this Google tool on our blog.
Here’s the Page Insights overview for the Amazon desktop site. It shows us all the Core Web Vitals at a glance:
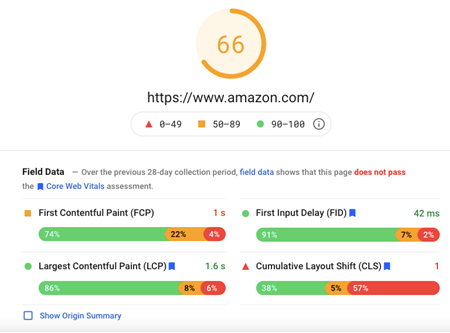
As you can see, the Largest Contentful Paint is doing pretty well, but there is always room for improvement. Head over to the Opportunities section, explore all recommendations and grab all those chances at even better rankings.

It’s a good idea to work through these recommendations in time to pass Google’s Core Web Vitals update. Check-in frequently to insure the constant improvement of your LCP and other site metrics and general SEO situation.
What Can Semrush Do to Help?
So, you’ve checked in on your LCP, and you’ve identified any issues. Now you’ve got to work on fixing them and then repeat the whole process in a week or two.
The constant upkeep of your SEO to maintain your website’s LCP up to scratch can get tiring fast. The good news is that we know exactly how you can make this process more efficient: the Site Audit tool.
Test your website speed with the tool, and generate a list of all possible improvements and issues — just like PageSpeed Insights but better. The Site Audit tool will also scan for technical SEO errors to provide you with easy-to-read charts and tables explaining all problems and fixes.
The tool can help you fill in your Core Web Vitals gaps by assessing your URL and analyzing its content while constantly keeping you up to **** on how your LCP is performing.
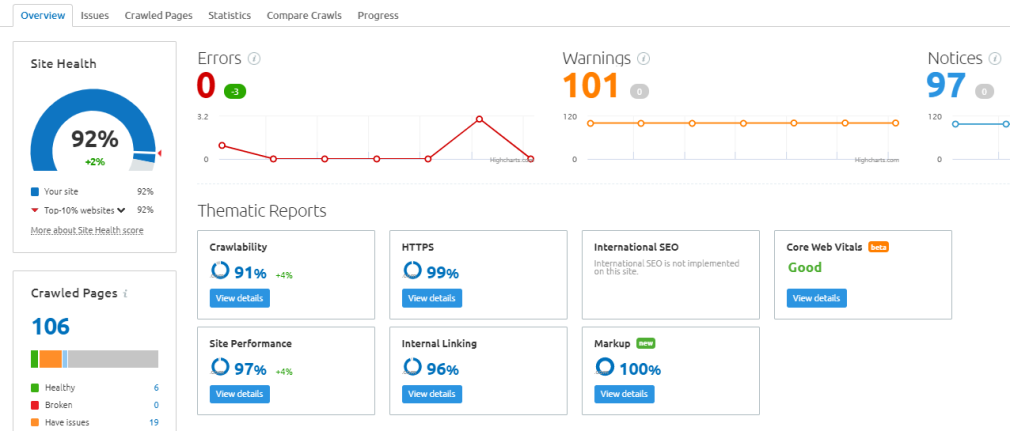
Once you’ve set up your site audit, all you have to do is click ‘View details’ under ‘Core Web Vitals’:
You can find your LCP results in the left-hand graph:
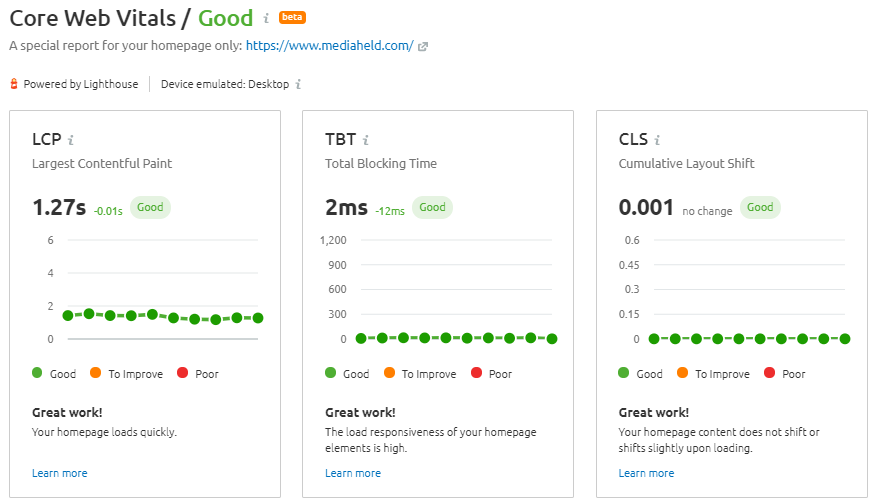
Now you know how to keep your LCP performance up-to-**** and where to go to spot points of improvement. If you work through each recommendation in the Site Audit regularly, your LCP and Core Web Vitals are on their way to improving.
Use this data to keep track of your LCP over time, and you’re bound to upscale your web speed performances in no time.
Still feel a little unsure? For more information on using Site Audit for page speed in general, check out our blog post on measuring Core Web Vitals with Semrush’s Site Audit.
Source link : Semrush.com
