Posted by
Shay Harel
The addition of LinkedIn to the available social analytics metrics that can be plotted on our Insight Graph provides the opportunity to trend and compare the effectiveness of social media marketing activities. In truth, LinkedIn has become a marketing giant of sorts, with over 400 million users how could it not be part of any marketing strategy?! All of the more reason then to ensure that you are making the most of this interweaving net of business connections. With it’s endless crisscrossing, intertwining, and communal braiding, tracking this beast of a social network can be challenging, which is precisely where the Insight Graph comes in.

Notes and Events
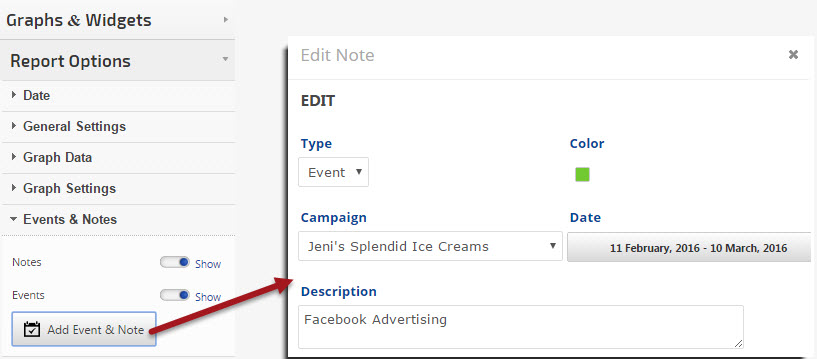
More than ‘how’ what you need to know is ‘why’. Consider this, if you spent a substantial amount of money running ads on LinkedIn last month, or maybe you spent endless hours pushing new content on the site… wouldn’t you want to know if your efforts are having an impact? Maybe you can get the same bang for your buck without spending all of that money? With the advent of the Insight Graph graphically reporting LinkedIn results, you can tangibly see the ROI and thereby make a well-informed and educated next move. By graphically indicating events such as an ad or content campaign, the Insight Graph noticeably, and as such easily, indicates your LinkedIn performance during “crunch time.” The Insight Graph even allows for qualifying a one time shift in the data. Say, for example, you see a one day spike in followers, by adding in a note that on that day your announcement about the conference you’re sponsoring went out, the spike in data is demystified and comprehensible. The implications are tremendous in so far as determining the impact of your various marketing campaigns and strategies is concerned.

Data Dissection
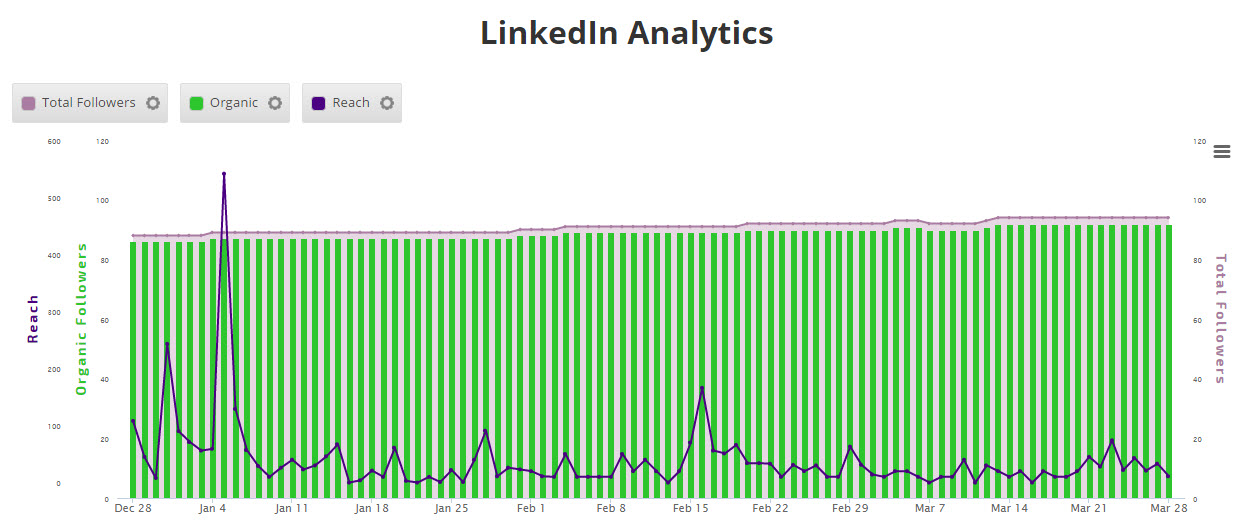
In order to go deep into the sea of data, the Insight Graph enables you to filter your LinkedIn progress. By qualifying your metrics, the Insight Graph affords you the ability to track your LinkedIn followers by source. Running with the example from above, having spent considerable sums of money on ads, you just might want to weed out your organic followers. As such, you can easily set up a metric that categorizes your followers as being either organic or acquired followers. Of course you can simply track your total followers as well. More so, the Insight Graph enables you to monitor your ‘reach’ on LinkedIn, giving you a glimpse into your full LinkedIn power!

The coolest part is that you don’t have to choose one metric over the other. You can view them all simultaneously! What does that mean here? Well, it means you can show your total followers as an area graph with your organic followers as columns within it, all while your reach is tracked as a line graph that runs through your columns! (Just for the record, you could also substitute or add in your acquired followers as well.)
The upshot (in this specific case) is that a company just starting to look at its LinkedIn performance (as in the above graph) can clearly and easily establish a baseline to help identify their goals and next-steps. Here, while the organic following may be good, the reach is disproportionately low. The obvious focus going forward for this company would be to increase their overall reach.
Social Analytics Options
Providing you with metrics that align to the specific nature of the social media at-hand is part of the Insight Graph’s long tradition.
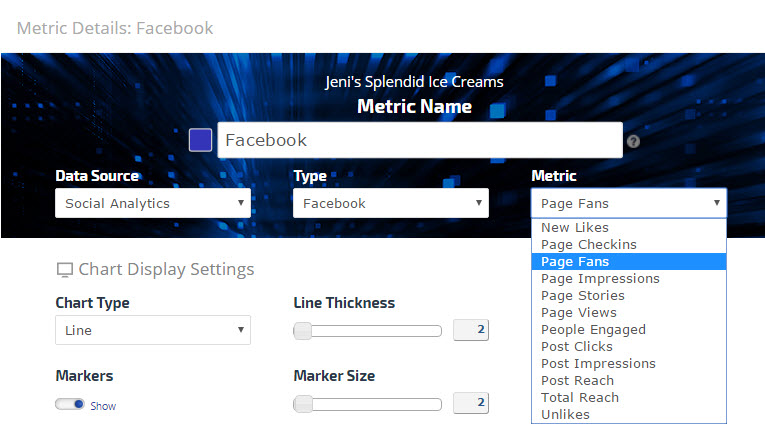
In the case of Facebook you are able to track metrics like (but of course not limited to):
- New Likes
- Page Views
- Post Reach
- Unlikes

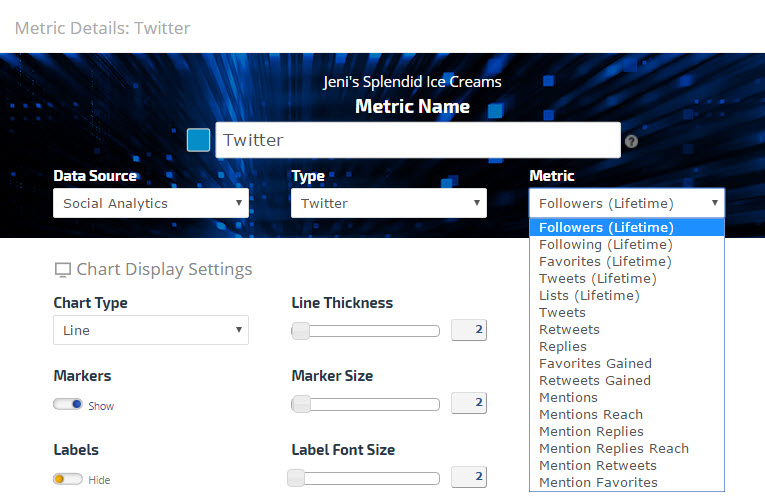
Your Twitter data can uniquely be viewed according to (and yet not limited to):
- Followers (Lifetime)
- Retweets
- Replies
- Mentions
The point being that the Insight Graph was designed with the definitive intention of allowing you to chart data that distinctly aligns to the specific form of social media you wish to monitor. Additionally, the Insight Graph comes with a slew of options that allow you to customize it in a variety of ways, all of which can be found within the documentation.
Syncing the social media giant to the Insight Graph will enable you to monitor and report LinkedIn performance trends in a colorfully visual way.


