25 Jan 2023|5 MIN READ
A lot can happen in just three months. And last quarter was certainly no different. Energy costs soared, many people are living through a cost-of-living crisis and huge sporting events caught the world’s attention. The end of 2022 saw seismic shifts in human behaviour across the globe.
How did this impact the search landscape? Using the data behind our industry Market Leaderboards released every quarter, we’ve taken a deep dive and highlighted some of the key insights from Q4 2022 below…
Significant growth in search volume for fashion terms during Q4 2022
After a relatively steady summer in terms of search volume for fashion-related terms, September saw a significant uptick and searches for womenswear grew to 26,030,740 by November 2022.
As expected searches relating to accessories saw a slight dip over the summer months, and not increasing until November – just in time for peak season. Searches for accessory-related terms went from 5,605,680 in October 2022 to 7,155,010 searches in November 2022.
Image source: Pi Datametrics | Search volume over time
View our Market Leaderboards
Are nails still the hottest trend in the beauty industry?
If we look at the beauty industry in both the UK and the US, searches relating to nails still reign supreme. However, after a huge rise in searches throughout June, July and August, popularity has started to decline.
Search volume relating to ‘nails – generic’ peaked at 2,939,700 in July 2022. In November 2022, searches were down to 1,920,080.
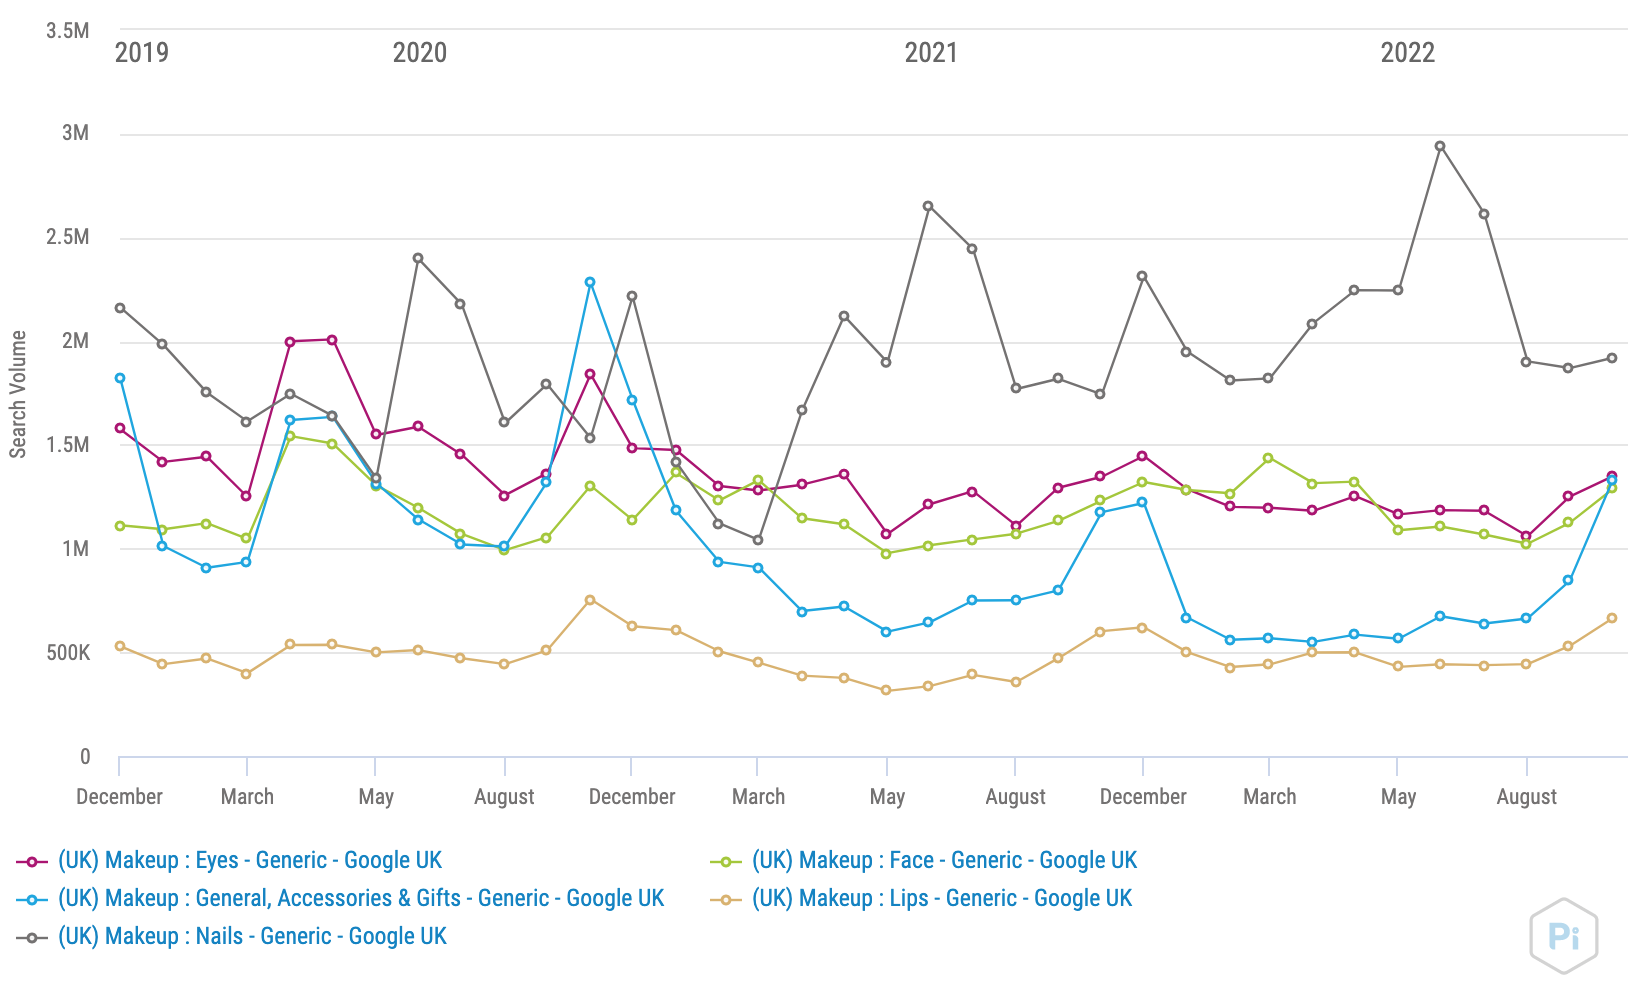
Image source: Pi Datametrics | Search volume over time
In the US, ‘nails – generic’ searches peaked in May 2022 at 11,994,560 and have declined ever since. In November 2022, searches were down to 8,106,810.
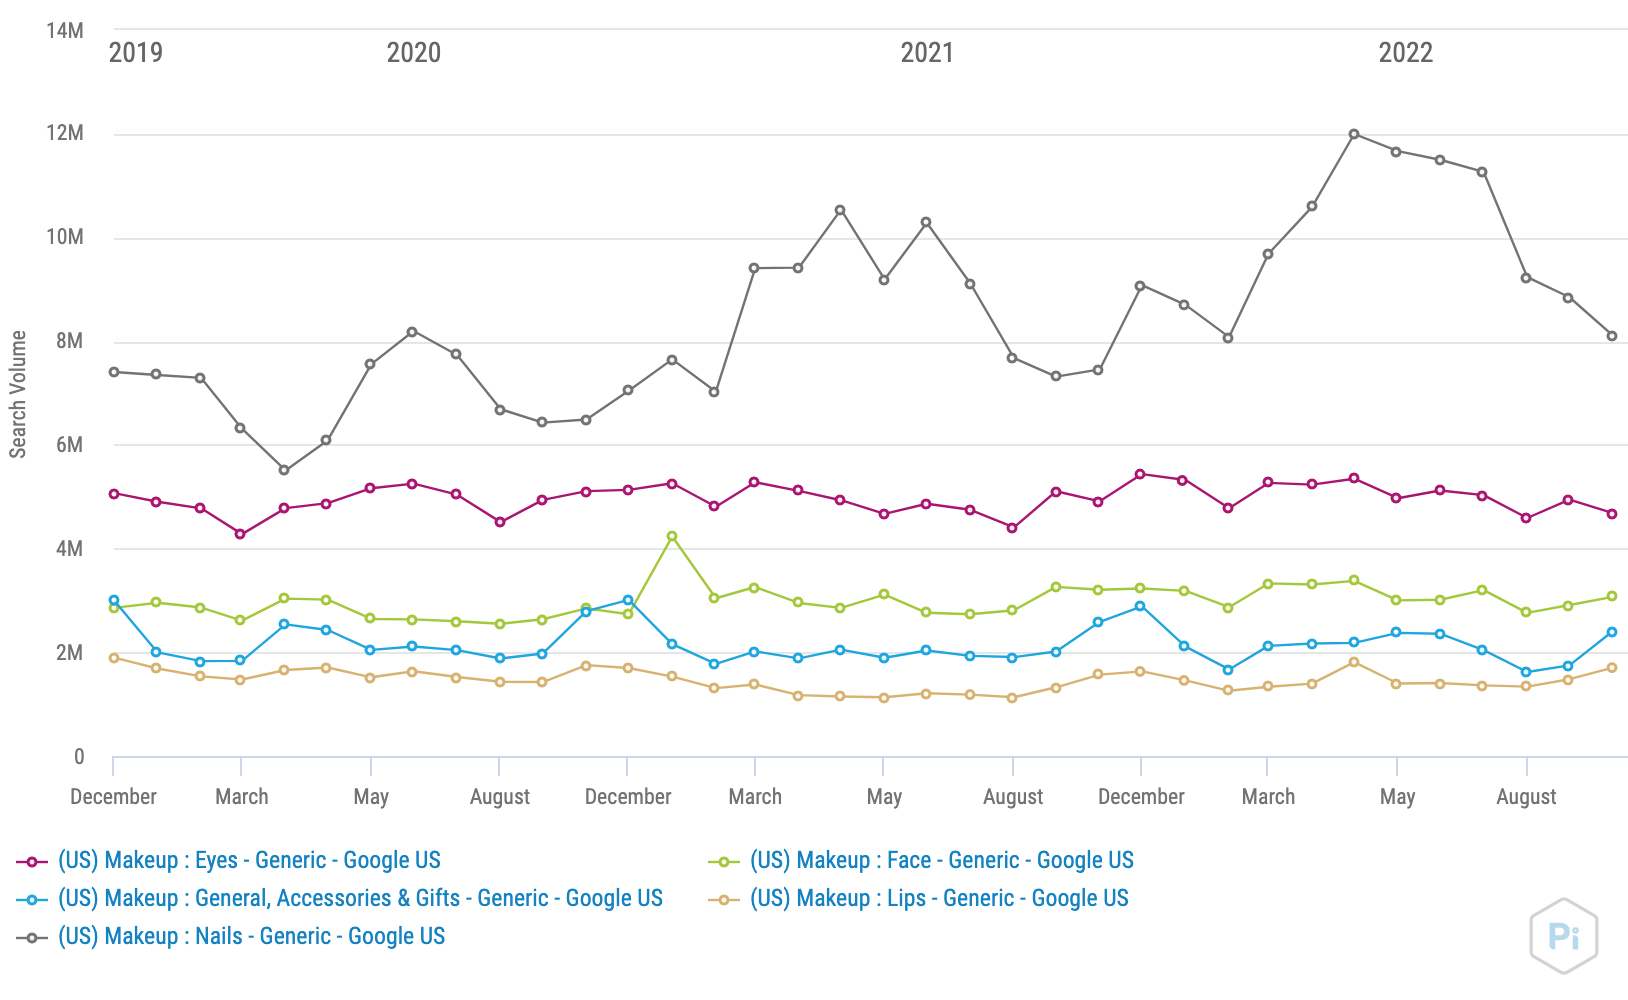
Image source: Pi Datametrics | Search volume over time
The Beauty – UK market saw some big movers in Q4 2022 as Cosmopolitan and Superdrug jumped a number of places on our Beauty Leaderboard – knocking YouTube from second place. Boots continued to dominate and held onto the top spot for another consecutive quarter.

Image source: Pi Datametrics Market Leaderboards
View the full leaderboard and access the data here.
The small appliances market is on the up despite a global downturn
Last quarter, the UK saw a considerable increase in the number of searches for Small Appliances. For example, searches relating to ‘small appliances – microwaves and cooking’ had a search volume of 14,946,610 between October and November 2022. This was a huge 190% increase compared to the same period the previous year.
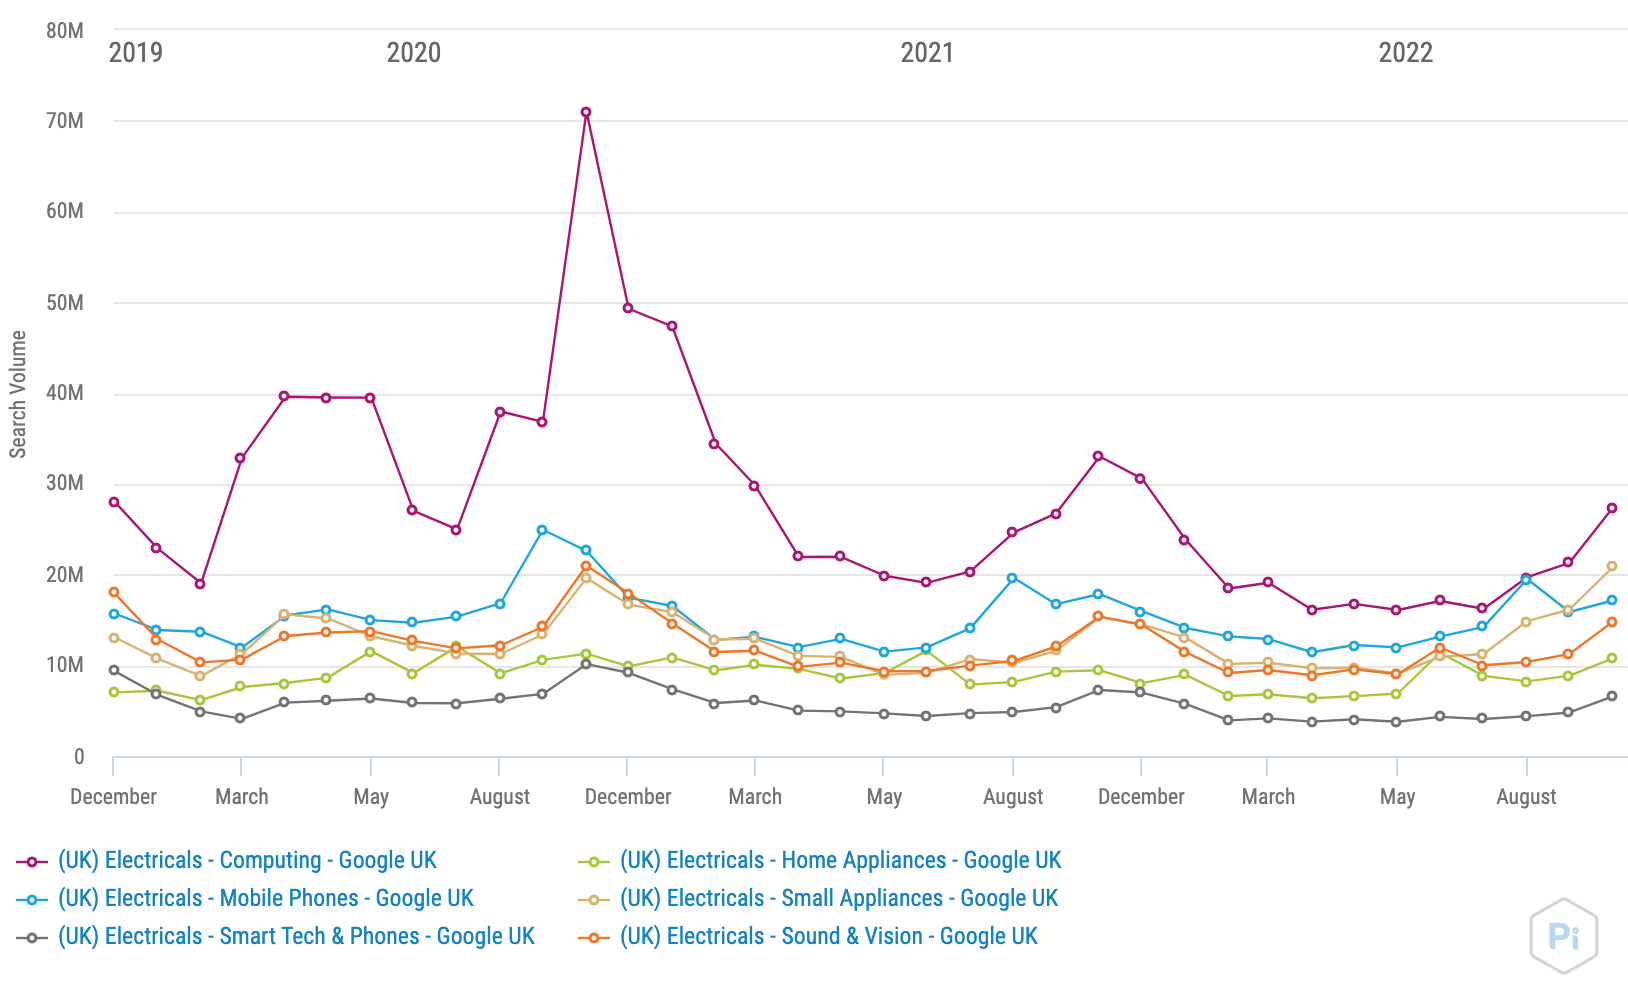
Image source: Pi Datametrics | Demand trends across the UK Electricals market based on search volume, over time
Deep dive into the latest search trends and learn more about the rise of the UK small and home appliance market here.
Things were a little different in the US Electricals market, as computing (particularly gaming) continued to dominate searches throughout Q4 2022. In November 2022 there were 81,711,900 computing-related searches.
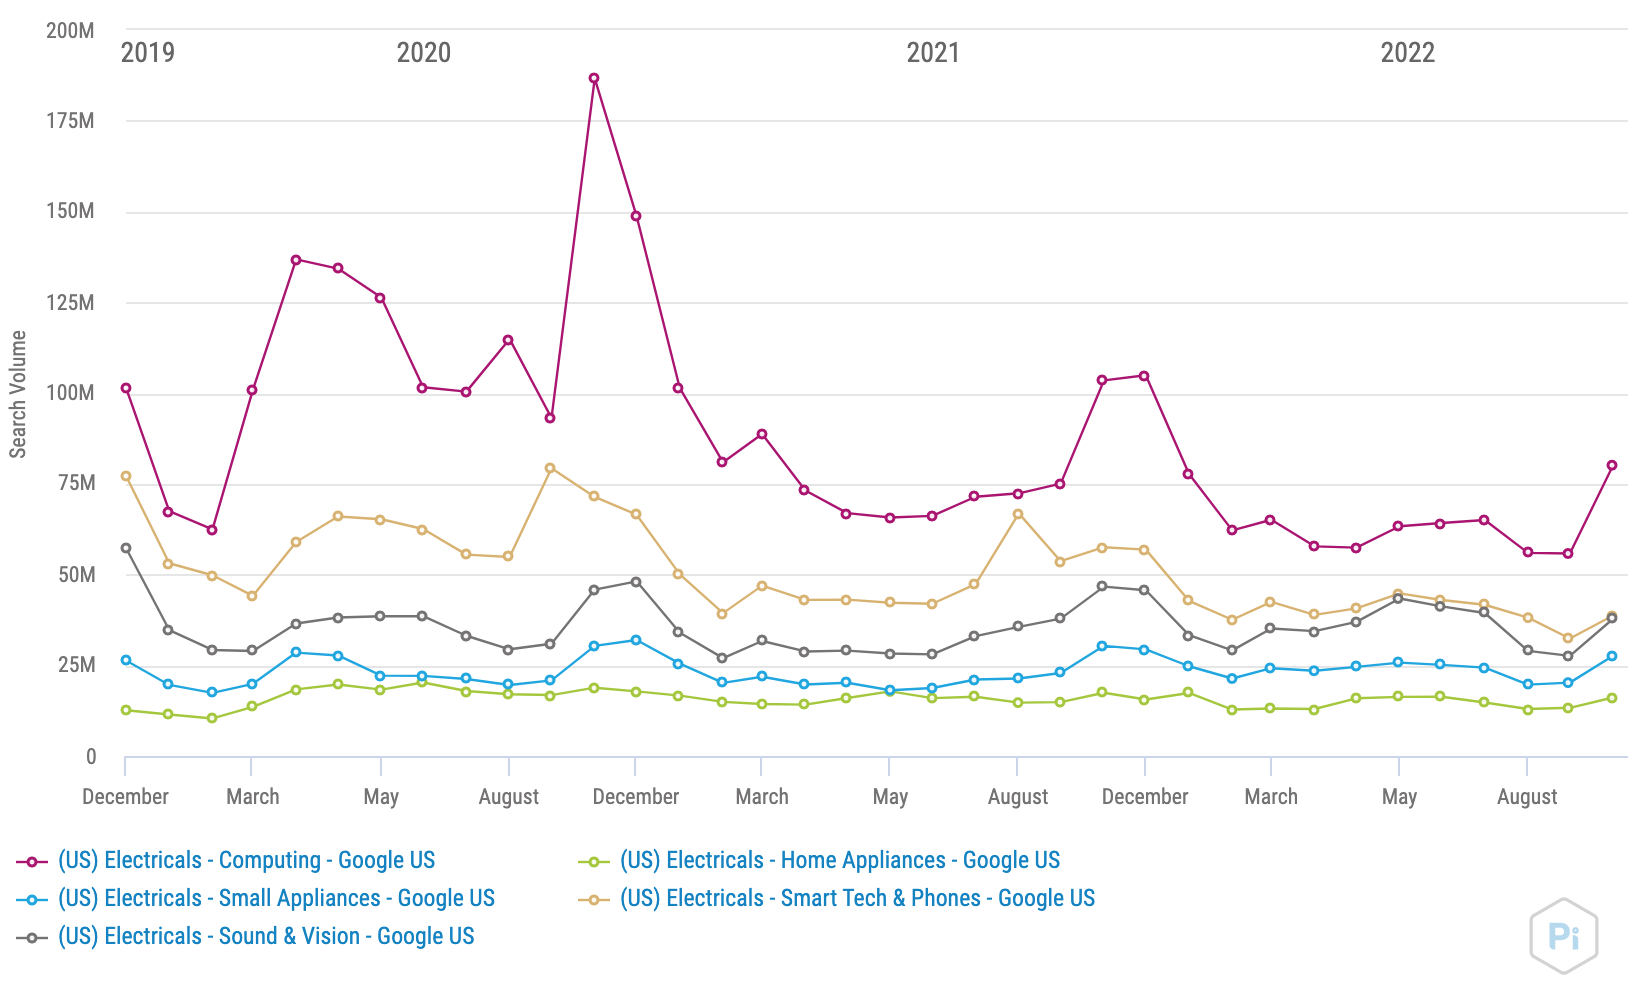
Image source: Pi Datametrics | Search volume over time
Searches for accommodation peaked in October 2022
Searches around accommodation continue to dominate the travel industry in the UK, and in 2022 searches peaked at 23,070,480 in October.
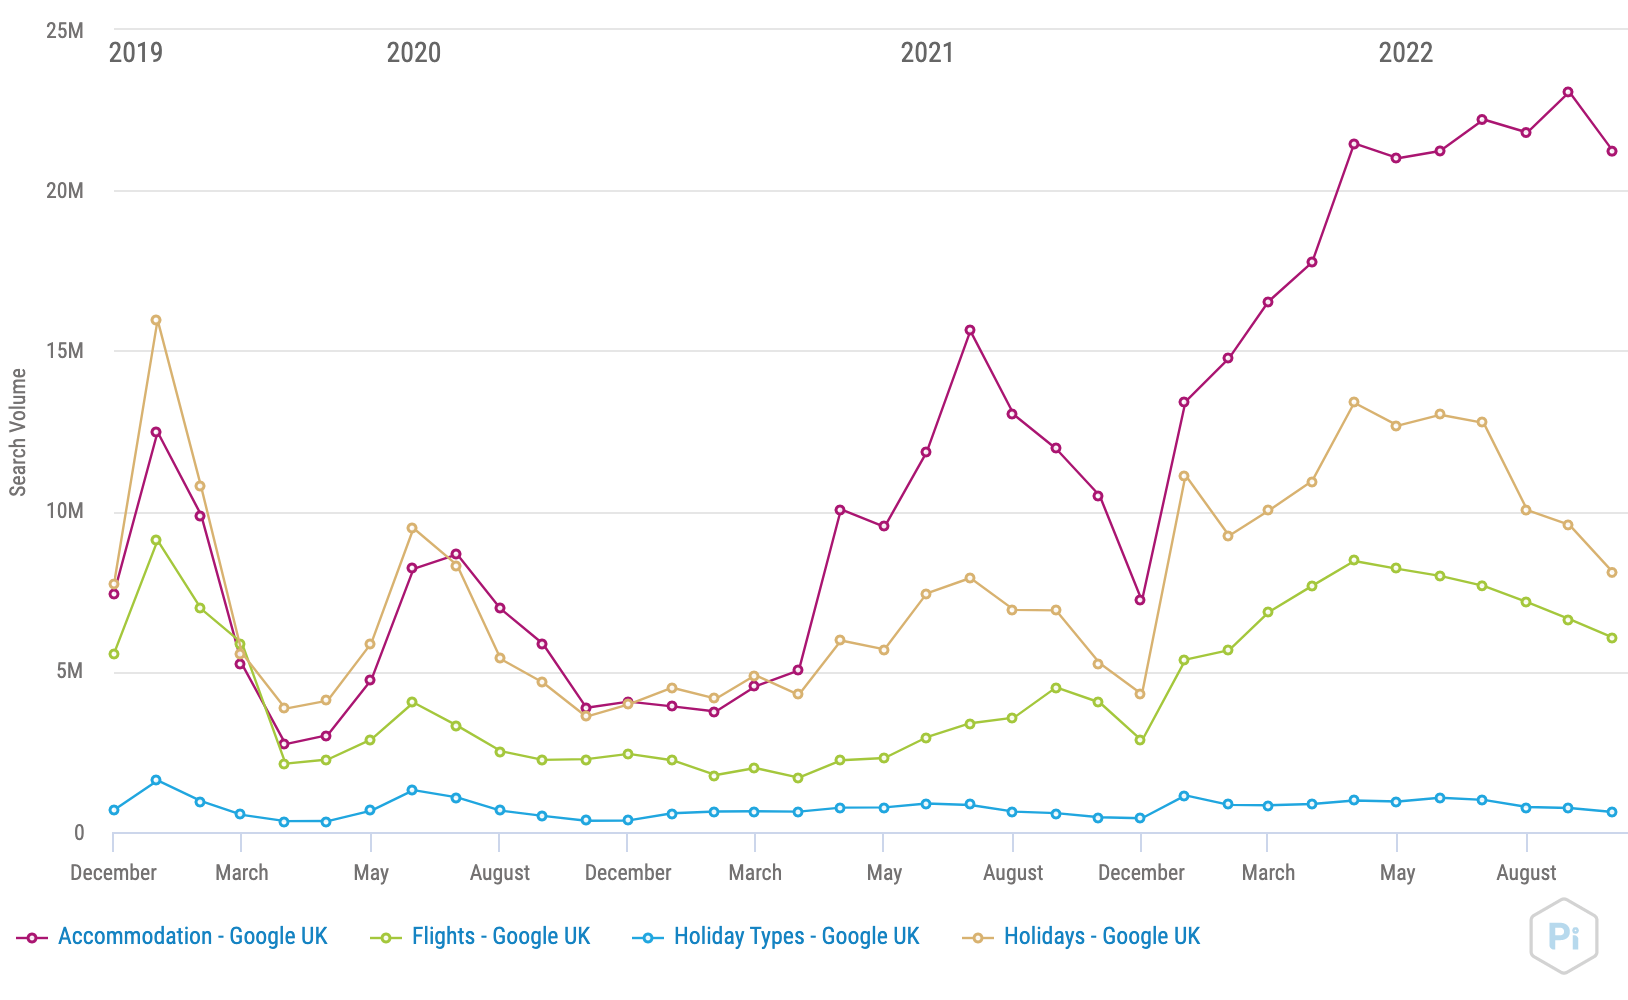
Image source: Pi Datametrics | Demand trends across the UK Travel market based on search volume, over time
Interestingly, although searches for UK-specific accommodation remain very high, we also saw an increase in searches for European accommodation in Q4 2022. There was a 142% increase in searches last quarter compared to the same period last year.
Competition is heating up for market leaders in travel
TUI had no trouble holding on to the top spot for another consecutive quarter on the Travel Leaderboard. However, Skyscanner, loveholidays and Booking.com are not far behind – watch this space to see if things heat up, even more, this quarter!

Image source: Pi Datametrics Market Leaderboards
View the full leaderboard and access the data here.
A significant rise in searches ahead of the 2022 World Cup
It’s no surprise that the 2022 World Cup held in December caused a significant increase in the number of searches for football-related terms in October and November last year.
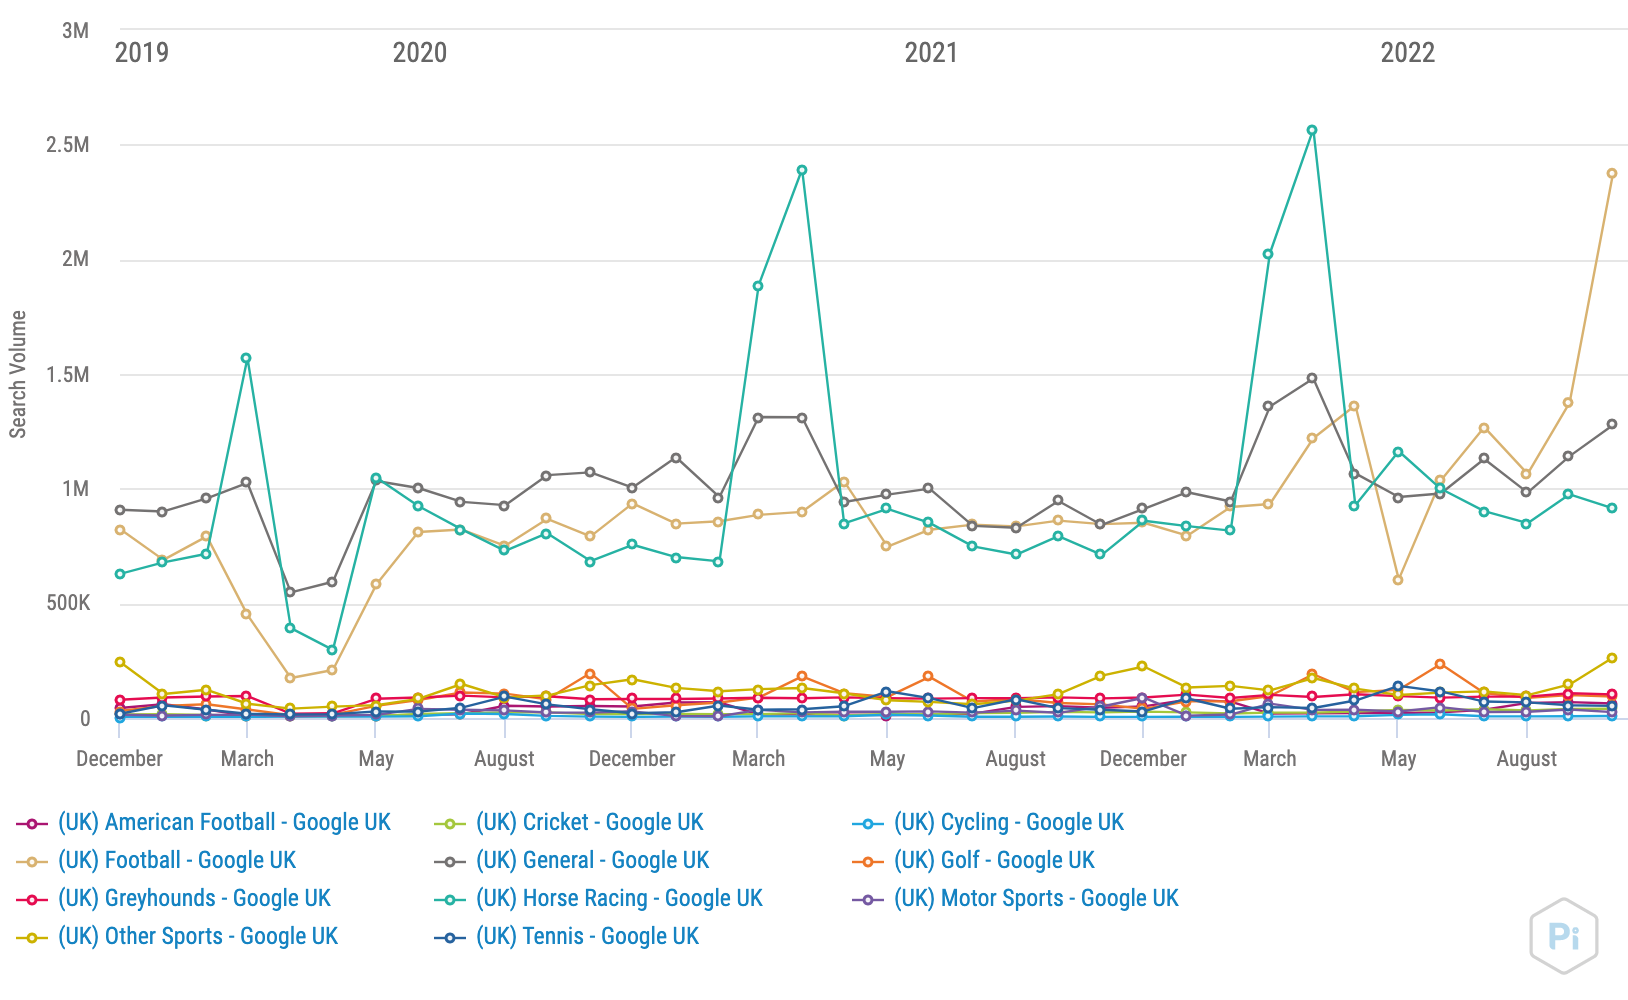
Image source: Pi Datametrics | Search volume over time
In October 2022, searches for football-related terms reached 1,375,570 and later peaked in November with 2,375,380 searches.
In November we saw the highest volume of searches in years, and many market leaders were quick to capitalise on this.
Q4 saw The Telegraph storm into first place on our Sportsbook Leaderboard, closely followed by ********.com and ******* Sites who both jumped up numerous places to claim second and third.

Image source: Pi Datametrics Market Leaderboards
View the full leaderboard and access the data here.
Get your hands on the data
Interested in delving deeper into the data behind our Market Leaderboards? You can now access the data via Google Data Studio!
View the market leaders in your industry and their share of voice over time, as well as the most searched terms last quarter.
And don’t forget we also have Leaderboards covering numerous industries in the UK and the US! View them all here.
Never miss a post
Join our mailing list and have our SEO news delivered straight to your inbox.
