52
| SEO | – 13 min read – | January 2, 2024 |


The Serpstat API has many endpoints encompassing virtually all facets of the SEO workflow, from keyword research to backlink analytics. The Domain Keywords endpoint can be used not only to extract the raw data on your client and their competitors but also to use data science techniques to generate insight. Below, we will demonstrate how to do it by employing Python.
The insights could be used as part of a cloud computing data pipeline to power your SEO dashboard reports such as Looker, Power BI, etc.
Get your API Token
You’ll need an API token before you can query the SERPSTAT API, which will appear on any documentation page, such as the main API page, as shown below:
Once you’ve copied over your API token, you can use this when you start up your Jupyter iPython notebook.
Start your Jupyter iPython Notebook
All of the Python code will be executed in the Jupyter iPython notebook environment. Equally, the code will run in a COLABs notebook if that is your preference. Once you have that up and running, import the functions contained in the libraries:
import requests
import pandas as pd
import numpy as np
import json
from plotnine import *
To make API calls, you’ll need the requests library.
To handle data frames, akin to Excel in Python, we’ll employ Python and assign ‘pd’ as a shorthand alias, simplifying the use of pandas functions. We’ll also use Numpy, abbreviated as ‘np,’ to manipulate data in data frames.
Data from APIs is often in dictionary format, so the JSON will help us unpack the results into data structures that we can push to a data frame.
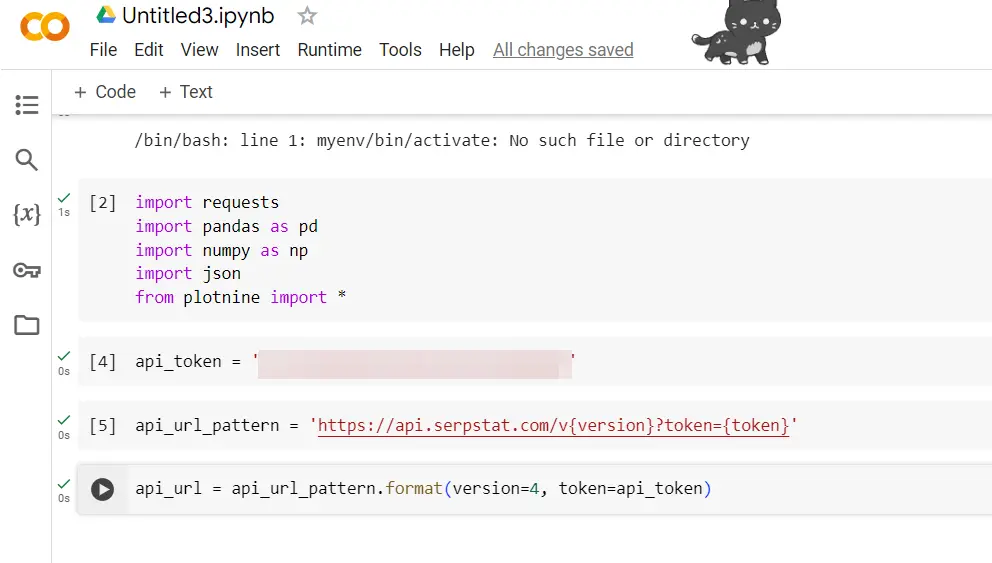
api_token = ‘your api key’
This was obtained earlier (see above).
api_url_pattern = ‘https://api.serpstat.com/v{version}?token={token}’
We’ll set a URL pattern that allows us to query different endpoints of the Serpstat API. The current version is APIv4. Since you’ll be calling the application programming interface a few times, this will save repetitive code from being typed out.
api_url = api_url_pattern.format(version=4, token=api_token)
Set the API URL to incorporate the API version and your API token.
Get Domain Keywords
The exciting part. We can now extract keywords for any domain that is visible by querying the Domain Keywords endpoint. This will show all the keywords a domain ranks in the top 100 for a given search engine.
We start by setting the input parameters the API requires:
domain_keyword_params = {
    "id": "1",
    "method": "SerpstatDomainProcedure.getDomainKeywords",
    "params": {
        "domain": "deel.com",
        "se": "g_uk",
        "withSubdomains": False,
        "sort": {
            "region_queries_count": "desc"
        },
        "minusKeywords": [
            "deel", "deels"
        ],
        "size": "1000",
        "filters": {
            "right_spelling": False
        }
    }
}
A thing to note: the Domain Keywords endpoint is accessed by setting the method to “SerpstatDomainProcedure.getDomainKeywords”
You’ll need to set your domain name “domain” under and your search engine under “g_uk”.
In our case we’re going to look at deel.com’s keywords in Google UK. A full list of search engines is available here which covers Google worldwide regions and Bing US.
Additional options include minus keywords (negative matching), in our case we’re only interested in non-brand keywords to understand where the organic traffic is coming from.
We have also set the “size” parameter to 1,000 which is the maximum rows output possible.
There are other interesting parameters such as being able to restricting the API to include certain keywords (“keywords”) or site URLs within the domain (“url”).
With the parameter set we can make the request using the code below:
domain_keyword_resp = requests.post(api_url, json=domain_keyword_params)

if domain_keyword_resp.status_code == 200:
    domain_keyword_result = domain_keyword_resp.json()
    print(domain_keyword_result)
else:
    print(domain_keyword_resp.text)
The results of the API call are stored in domain_keyword_resp. We’ll read the response using the json function, storing the data into domain_keyword_result.

The if else structure is used to give you information in case the API call isn’t working as expected, showing you what the API response is if there’s no data or an error which making the call.
Running the call prints domain_keyword_result which looks this:
{'id': '1',
'result':
{'data': [
{'domain': 'deel.com', 'subdomain': 'www.deel.com', 'keyword':
'support for dell', 'keyword_length': 3, 'url': 'https://www.deel.com/',
 'position': 73, 'types': ['pic', 'kn_graph_card', 'related_search',
 'a_box_some', 'snip_breadcrumbs'], 'found_results': 830000000,
'cost': 0.31, 'concurrency': 3, 'region_queries_count': 33100,
 'region_queries_count_wide': 0, 'geo_names': [], 'traff': 0,
 'difficulty': 44.02206115387234, 'dynamic': None},
{'domain': 'deel.com', 'subdomain': 'www.deel.com',
'keyword': 'hr and go',
 'keyword_length': 3, 'url': 'https://www.deel.com/',
 'position': 67, 'types': ['related_search', 'snip_breadcrumbs'],
 'found_results': 6120000000, 'cost': 0.18, 'concurrency': 4,
 'region_queries_count': 12100, 'region_queries_count_wide': 0,
 'geo_names': [], 'traff': 0, 'difficulty': 15.465889053157944,
 'dynamic': 3},
When working with any API, It’s important to print the data structure so you know how to parse the data into a usable format. Not that produces a dictionary with multiple keys, where the data we want is contained under the result data keys. The values of data are in a list of dictionaries where each dictionary represents a keyword.
We’ve produced the code below to extract the data from domain_keyword_result and push it to the domain_keyword_df dataframe:
domain_keyword_df = pd.DataFrame(domain_keyword_result[‘result’][‘data’])
Let’s display the dataframe:
display(domain_keyword_df)
Which looks like:

The dataframe shows all of the keywords for the domain up to a maximum 1,000 rows. It contains column fields such as:
- region_queries_count: search volume within your target region
- url: the rank URL for the keyword
- position: SERP rank
- types: SERP features
- concurrency: the amount of paid search ads which can indicate the level of transactional and/or commercial intent.
If you wanted more because you’re working on a larger site, you could:
2.Run multiple Domain Keyword calls using the code above on those site URLs as part of a for loop where specifying the URL as the input parameter for ‘url’.
Create Data Features
For insights, we’ll want to create some features which will assist summarising the raw data. As per best practice, we’ll create a copy of the dataframe and save it to a new dataframe called dk_enhanced_df.
dk_enhanced_df = domain_keyword_df.copy()
Setting a new column called ‘count’ will allow us to literally count things as you’ll see later.
dk_enhanced_df[‘count’] = 1
We also want to create a customised column called ‘serp’ indicating the SERP page category which can be useful for seeing the distribution of site positions by SERP and pushed into dashboard reports.
dk_enhanced_df['serp'] = np.where(dk_enhanced_df['position'] < 11, '1', 'Nowhere')
dk_enhanced_df['serp'] = np.where(dk_enhanced_df['position'].between(11, 20), '2', dk_enhanced_df['serp'])
dk_enhanced_df['serp'] = np.where(dk_enhanced_df['position'].between(21, 30), '3', dk_enhanced_df['serp'])
dk_enhanced_df['serp'] = np.where(dk_enhanced_df['position'].between(31, 99), '4+', dk_enhanced_df['serp'])
The SERP has been coded above using the numpy.where function, which is like the Python version of the more familiar Excel if statement.
If you note the types column, the values contain a list of the universal search result types shown on the search engine for the keyword.
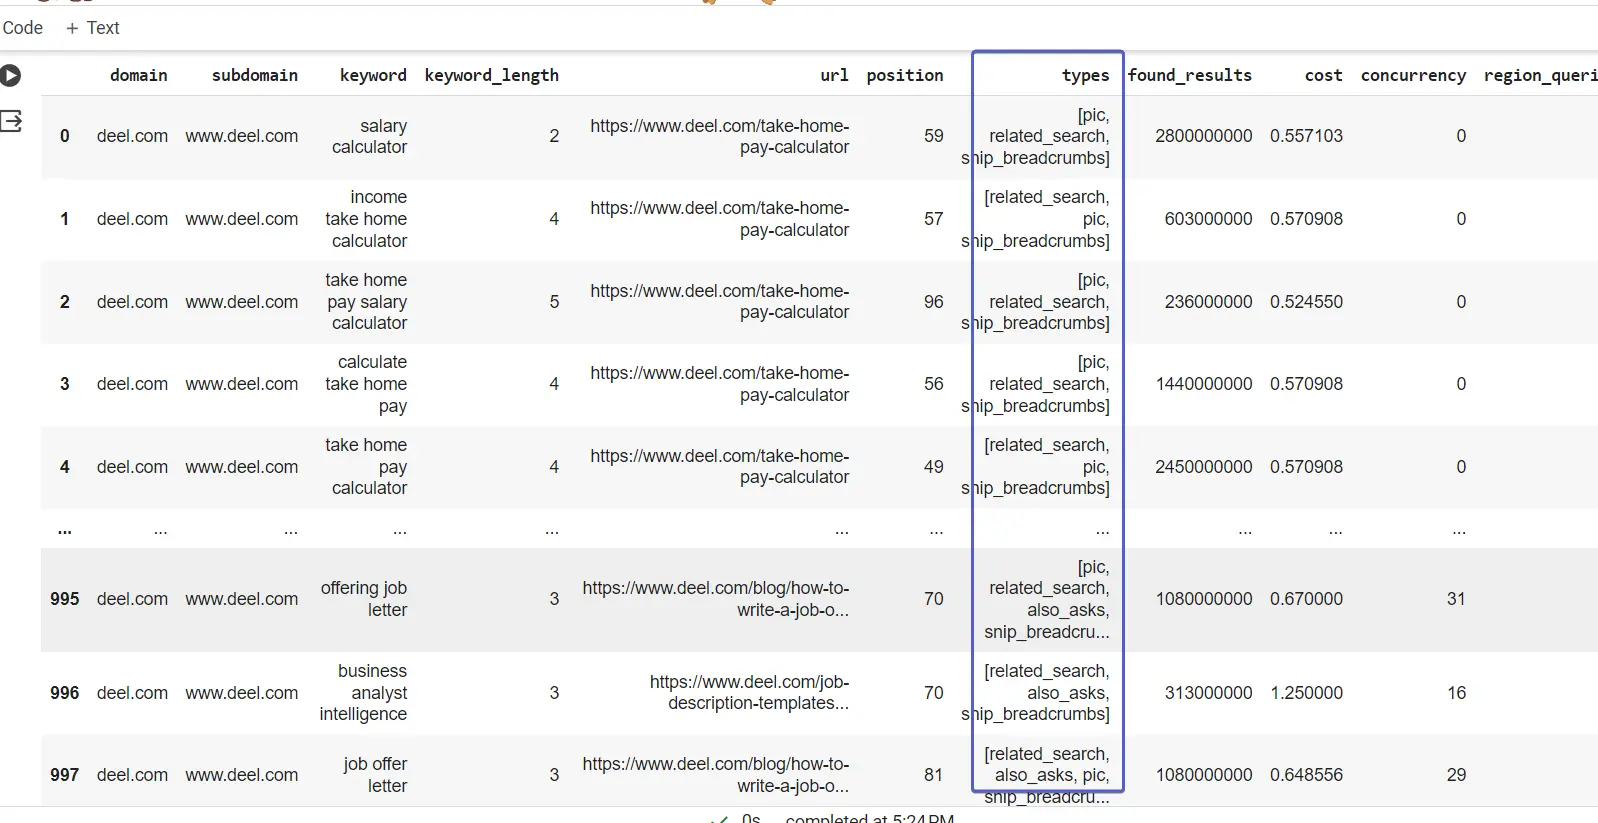
We can unpack this and make it easier to analyse using the one-*** encoding (OHE) technique. OHE will create columns for all the result type values and place a 1 where a result exists for the keyword:
types_dummies = pd.get_dummies(dk_enhanced_df[‘types’].apply(pd.Series).stack()).
sum(level=0)
Concatenate the one-*** encoded results type columns with the dk_enhanced_df DataFrame
dk_enhanced_df = pd.concat([dk_enhanced_df.drop(columns=[‘types’]), types_dummies], axis=1)
display(dk_enhanced_df)

Thanks to OHE and the other enhancements, we now have an expanded dataframe with columns that make it easier to analyse and generate insights from.
Start your SEO journey with confidence!
Sign up for our 7-day trial and dive into the world of advanced SEO analysis using our API. No commitments, just pure exploration.
7-Day Free Trial
Exploring Domain Keyword Data
We’ll start by looking at the statistical properties of the domain keywords data using the describe() function:
dk_enhanced_df.describe()

The function takes all of the numerical columns in a dataframe to estimate their statistical properties such as the average (mean), standard deviation (std) which measures the rate of dispersion from the average, the number of data points (count), and the percentiles such as the 25th (25%) as shown above.
While the function is useful as a summary, from a business perspective it’s often useful to aggregate the data. For example, using the combination of groupby and agg functions we can count how many keywords are on SERP 1 and so forth using the code below:
serp_agg = dk_enhanced_df.groupby(‘serp’).agg({‘count’: ‘sum’}).reset_index()
The groupby function groups the dataframe by column (much like an Excel Pivot table does), and then aggregates the other columns. In our use case we’re grouping by SERP to count how many keywords there in each SERP as displayed below:
display(serp_agg)
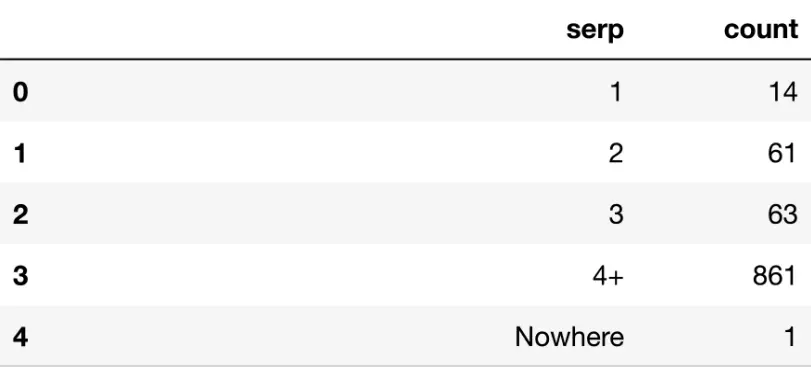
Most of the keywords are beyond page 3 as shown by the 861 count value for SERP 4+.
If we want to visualise the data for a non SEO expert audience we can use plotnine’s ggplot functions:
serp_dist_plt = (ggplot(serp_agg,
                        aes(x = 'serp', y = 'count')) +
                    geom_bar(stat = 'identity', alpha = 0.8, fill = 'blue') +
                    labs(y = 'SERP', x = '') +
                    theme_classic() +
                    theme(legend_position = 'none')
                   )
ggplot take 2 main arguments being the dataframe and the aesthetics (aes). aes specifies the parts of the dataframe that will be mapped onto the graph. Additional layers are added to the code to determine the chart type, axis labels and so forth. In our case we’re using geom_bar which is a bar chart.
The code is saved to the chart object serp_dist_plt which when run displays the chart:
serp_dist_plt
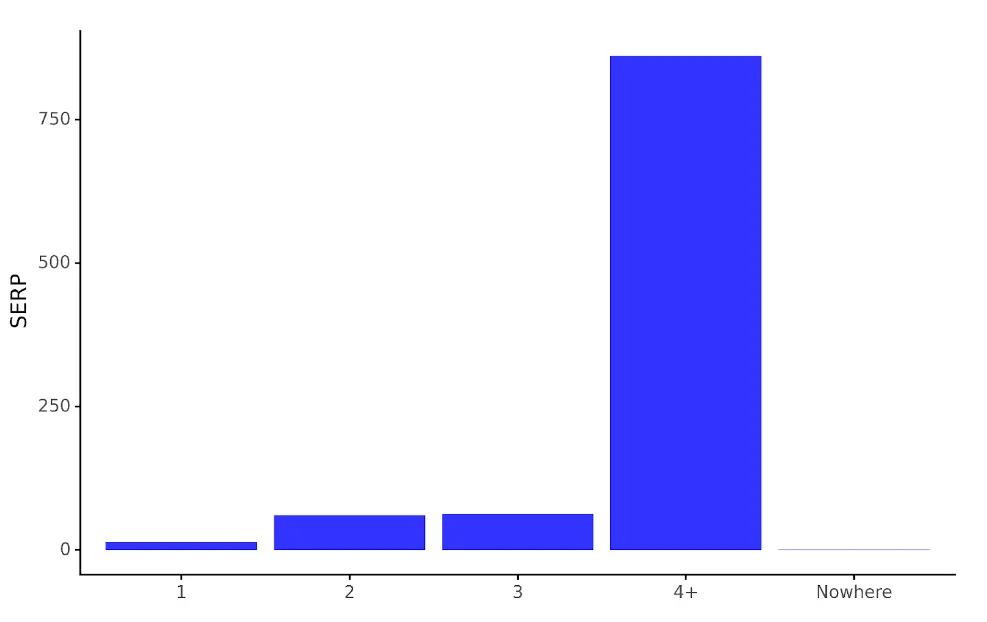
The chart produced creates a visualised version of the serp_agg dataframe, which makes it much easier to compare the number of keywords positions between SERPs.
Competitor Insights from Domain Keywords
While this is great, numbers for a single website domain are not as insightful as they would be when compared to other sites competing in the same search space. In the above instance, deel.com has 14 keywords in SERP 1. Is that good? Bad? Average? How can we know?
Competing domain data adds that context and meaning which is a good use case for spending those API credits. Adapting the code above, we can get data on several domains, to get something more meaningful.
For example, having used the same API endpoint on competitor sites operating in the same space, we now have a table showing the keyword counts by SERP for each domain:
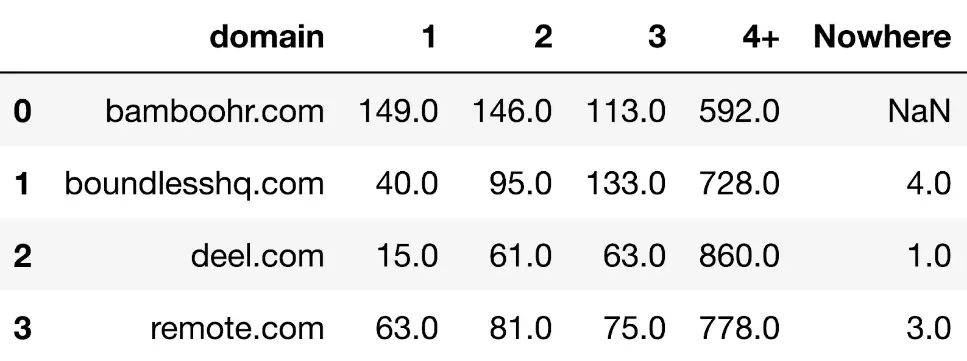
In a more visualised format, we get:
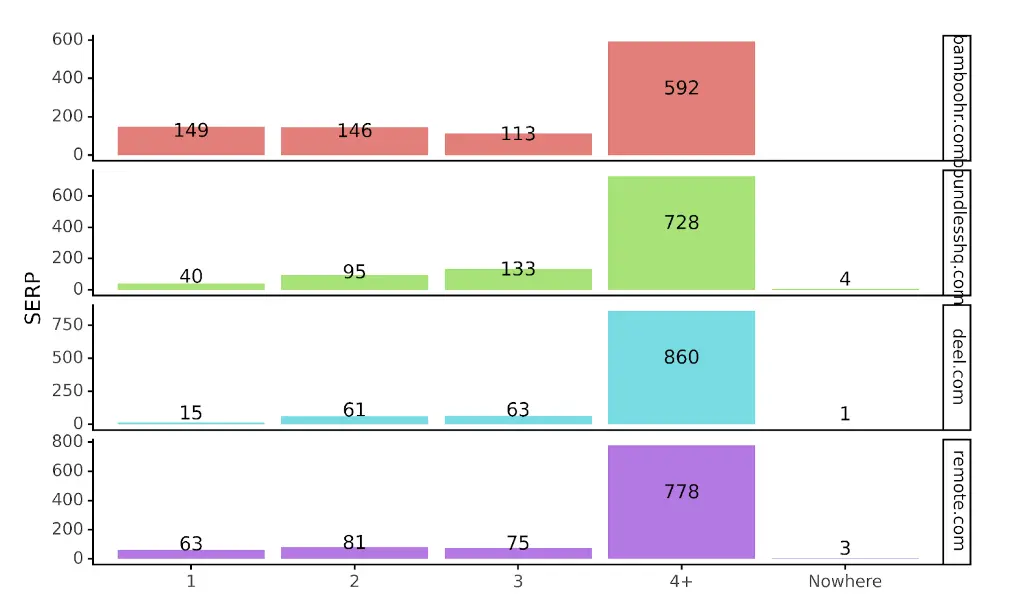
With the added context, we can see that deel is possibly underperforming on SERP 1s compared to other competitors. We can also see that Bamboo HR is leading followed by remote.com. In fact Bamboo is the only site with more SERP 1s than SERP 2s.
With the API not only can we distill the trends from the data, we have the actual data to see what SERP keywords are powering Bamboo’s visibility. In Python, that would be:
bamboo_serp_1s = mdk_enhanced_df.loc[mdk_enhanced_df[‘domain’] == ‘bamboohr.com’].copy()
The above takes the dataframe with the combined API data for the domains and filters for the domain that is bamboohr.com
display(bamboo_serp_1s)

This can then be exported to Excel for content planning purposes.
Other Domain Keyword Insights
The code so far concentrated on extracting the data from the Domain Keywords API and showed how just 1 column can generate insights on a single domain and multiple domains.
Just how many more insights could be generated from exploring the other columns and comparing competitor domains within the Domain Keywords endpoint. That’s before we start using other endpoints made available to us from the SERPSTAT API.
For example, which result types are appearing most? Are certain result types increasing over time that could help us understand where Google is trending? The code above which unpacked the result types column should help you get started.
The opinion of the guest post authors may not coincide with the opinion of the Serpstat editorial staff and specialists.
Found an error? Select it and press Ctrl + Enter to tell us
Discover More SEO Tools
Backlink Cheсker
Backlinks checking for any site. Increase the power of your backlink profile
API for SEO
Search big data and get results using SEO API
Don’t you have time to follow the news? No worries! Our editor will choose articles that will definitely help you with your work. Join our cozy community 🙂
By clicking the button, you agree to our privacy policy.
