Posted by
Rank Ranger
Rank Ranger’s new Marketing Dashboard is a tool for presenting data in an enhanced manner with style – your own unique style. Whether for internal or external communication, this white label marketing dashboard can be set to display organic, local and mobile rank tracking data as well as Google Analytics, Search Console and Social Media analytics (Facebook, Twitter, YouTube, LinkedIn, and Instagram), plus you can embed your own ancillary media and information.
The Marketing Dashboard finds its identity in its unique ability to provide a new level of data reporting communication that is combined with Rank Ranger’s commitment to comprehensive customization and ease of use.
Dashboard Customization
This white label dashboard combines advanced data reporting communication features with deep customization options that help deliver a reporting experience that can be comprehensively tailored per campaign, resulting in professionally polished and refined marketing dashboards.
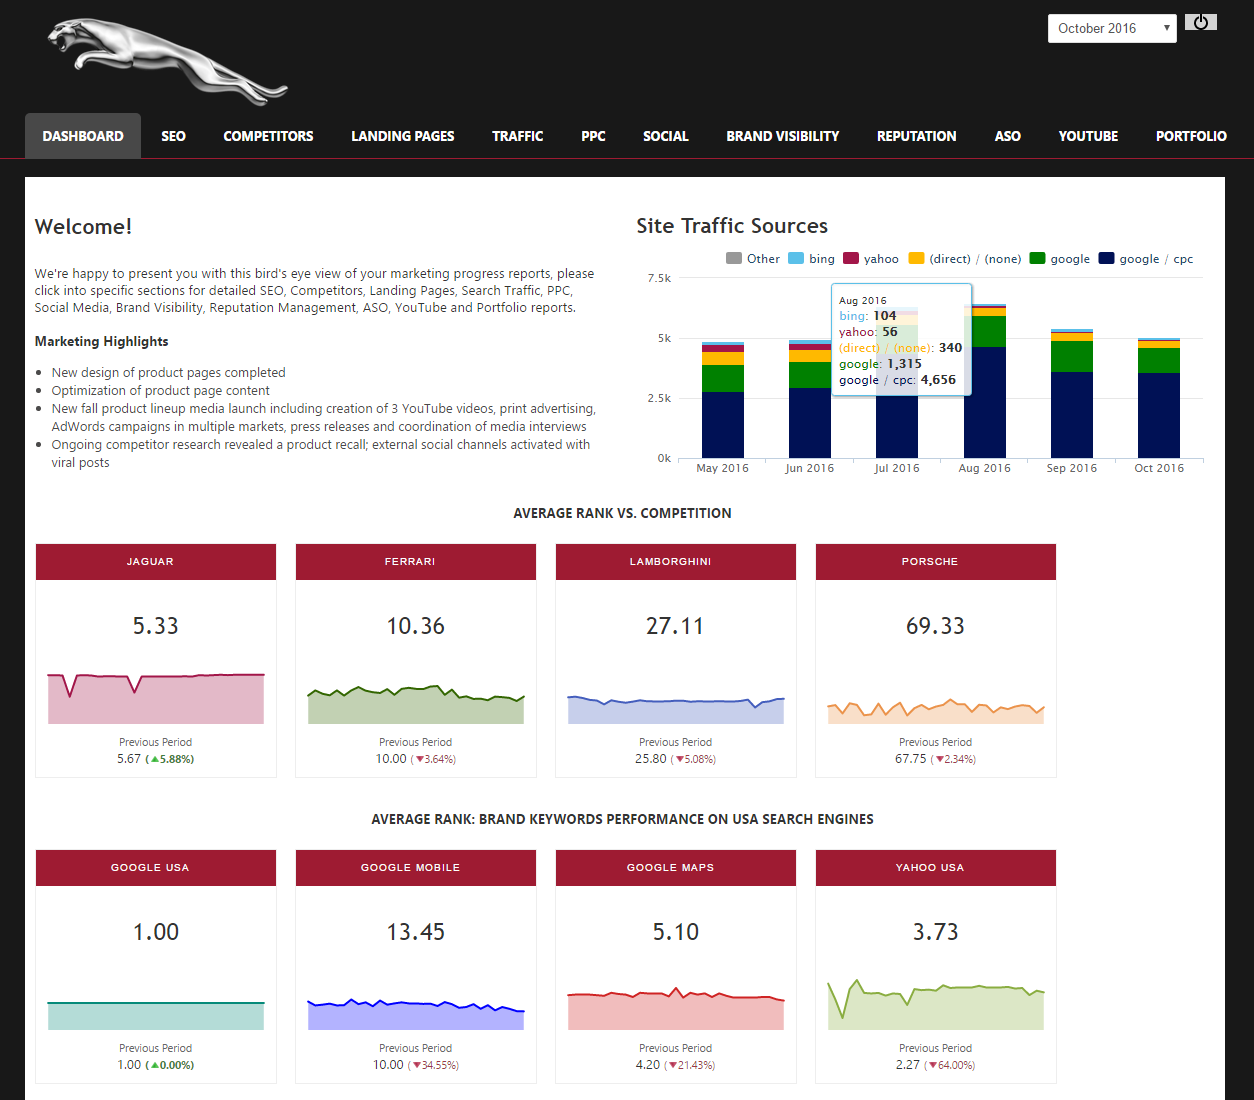
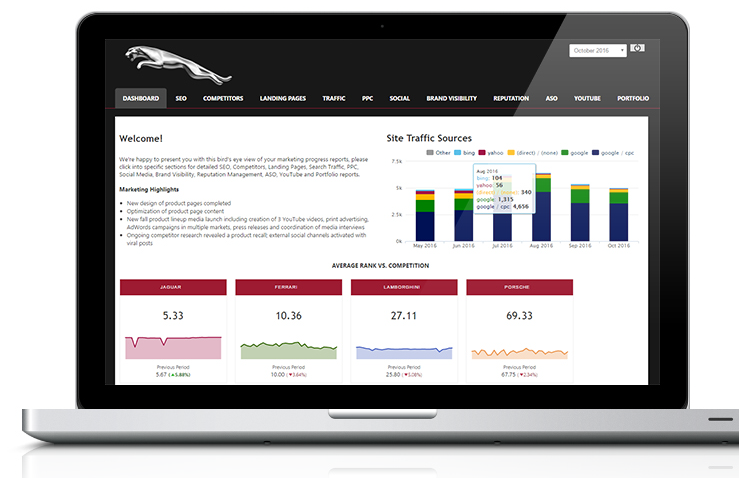
Fig. 1. Example of a Marketing Dashboard with category web pages each containing a variety of reports and graphs, and with a design that matches the brand’s site
Branding with CSS and HTML
Particularly pertinent for white label reporting to external clients, the customer’s logo can be displayed in the dashboard in addition to, or in place of, your own company logo via a button in the HTML settings. In Fig. 1. above, only the customer logo was chosen to be displayed, however, by adding a few lines for formatting to the CSS (style sheet) and clicking a button in the HTML screen both logos can easily be positioned in a professional layout as has been done in Fig. 2 below.
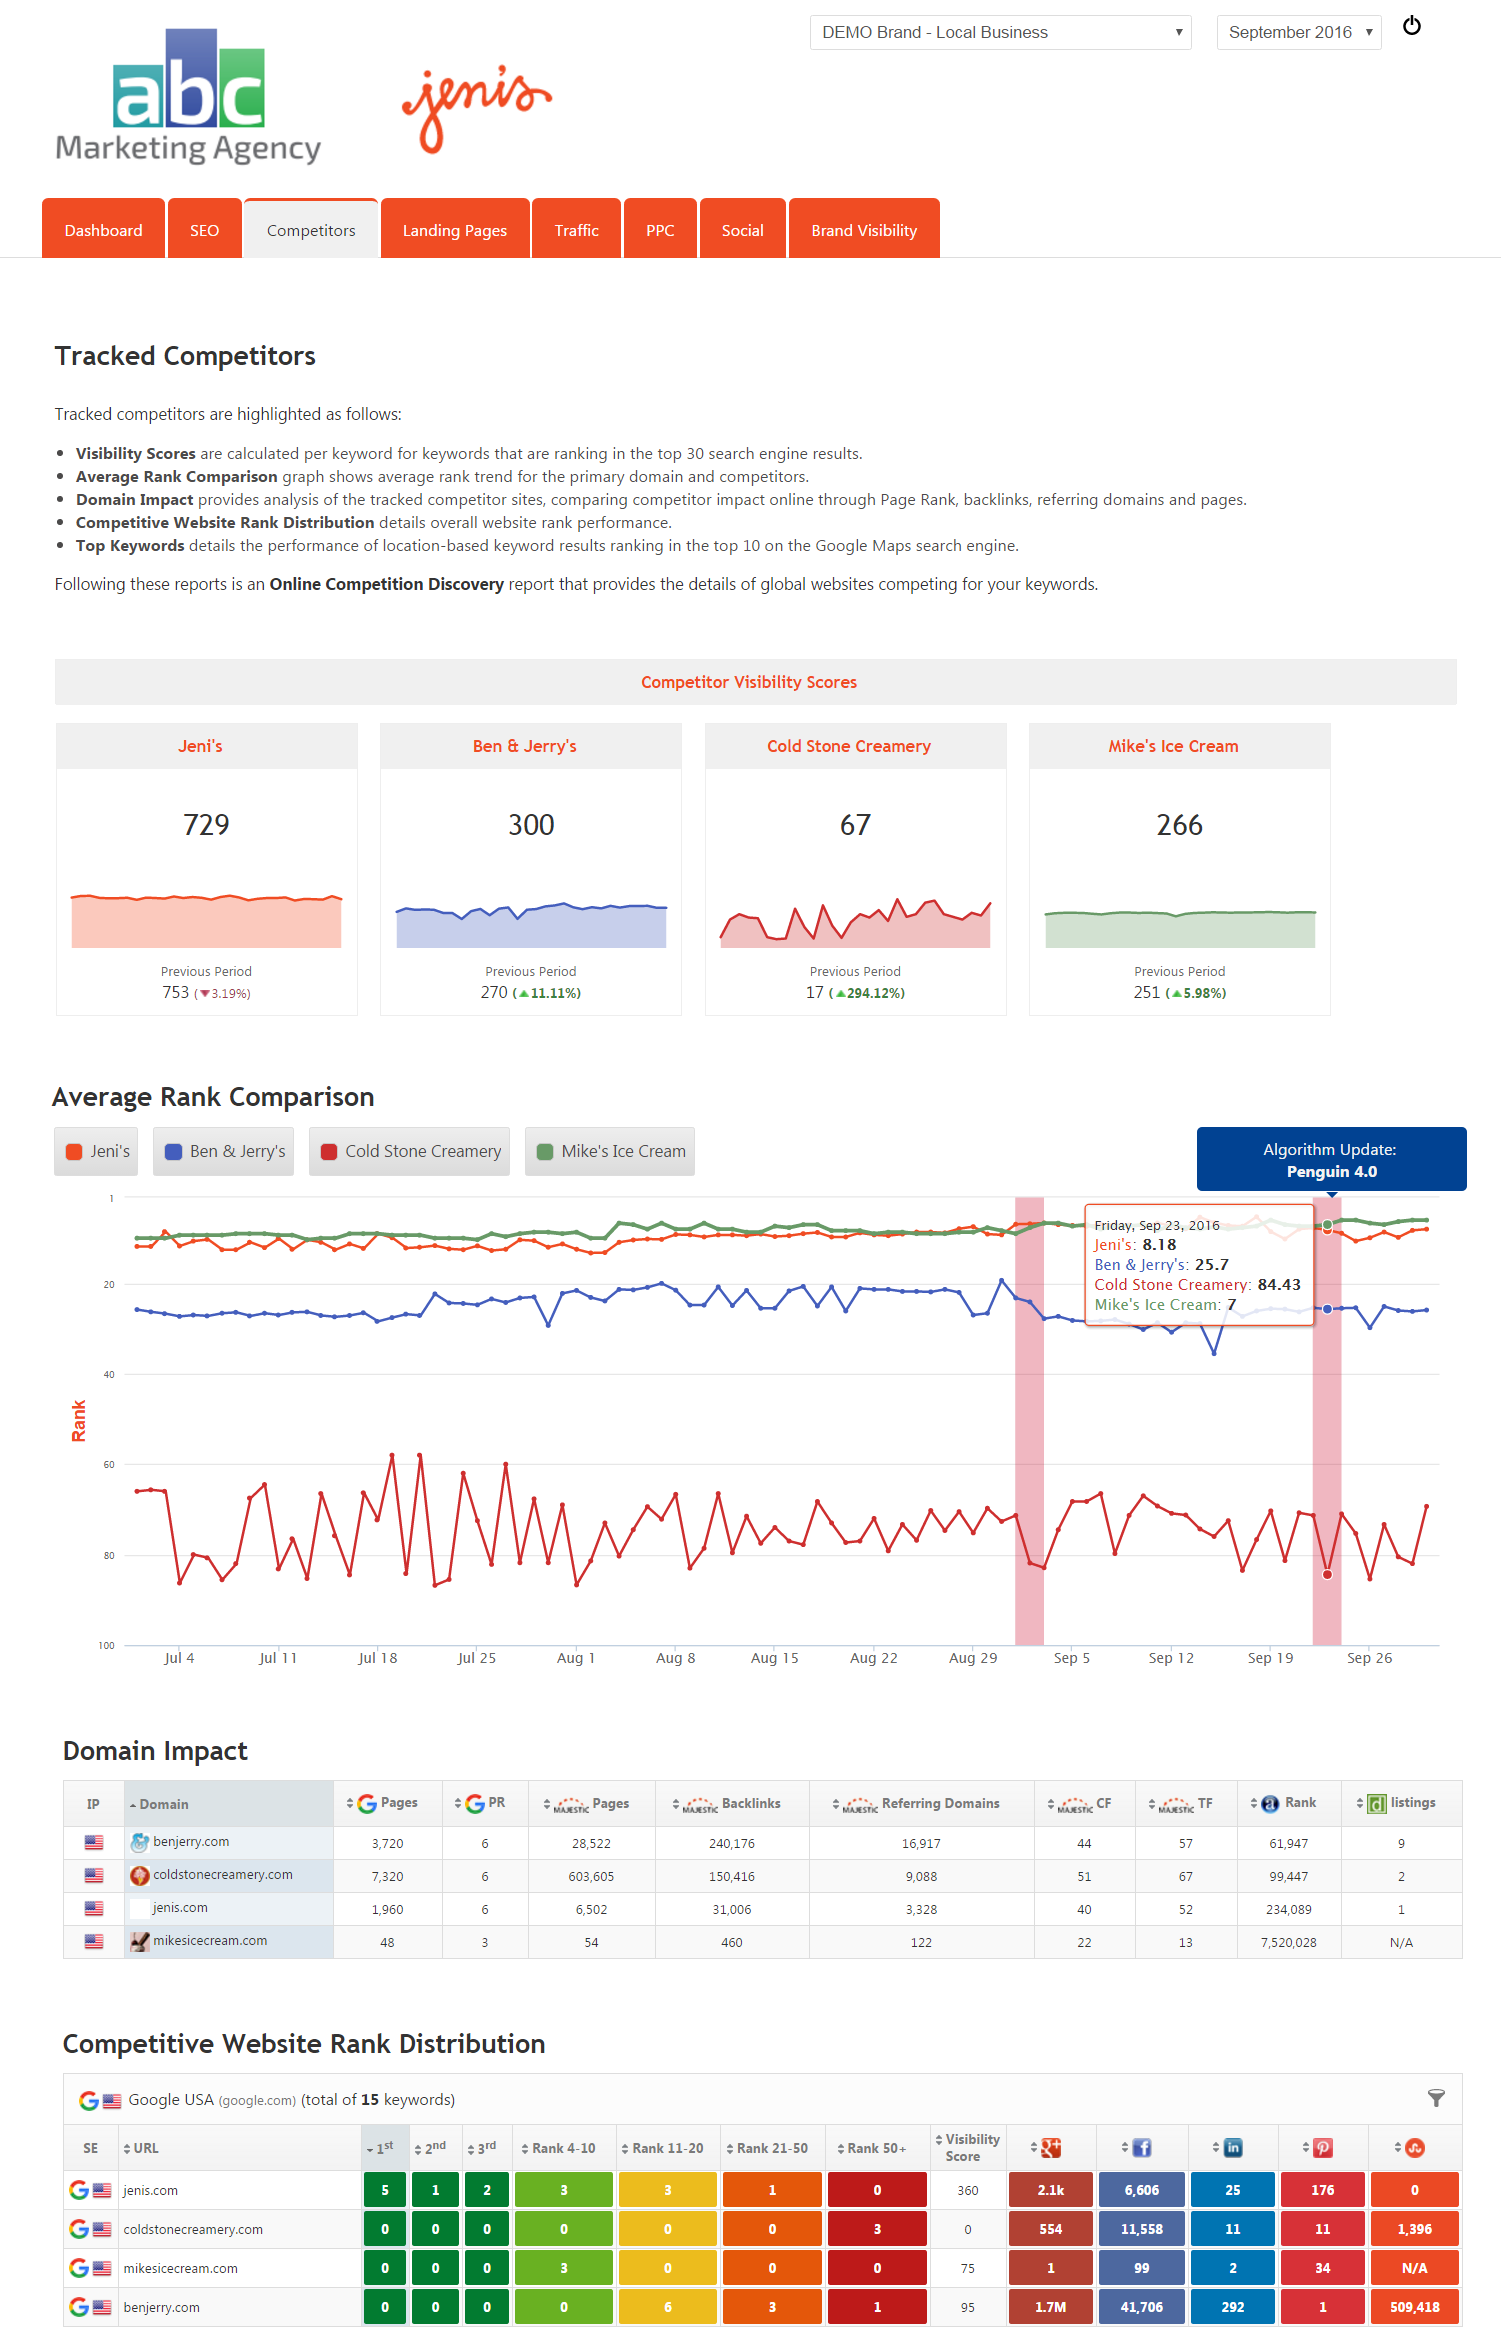
Fig. 2. Example of a Rank Ranger Marketing Dashboard branded for the client and displaying both the account and client logos
The Marketing Dashboard provides the ability to create a white labeled reporting hub that goes far beyond inserting logos and text formatting. Report creators using the dashboard can match the exact color scheme of theirs or their customer’s website via customized CSS settings, as illustrated in the difference in the designs of Figures 1 and 2 above. By employing this option, the report creator can design a marketing dashboard that truly appears to be an extension of their own or of their customer’s website.
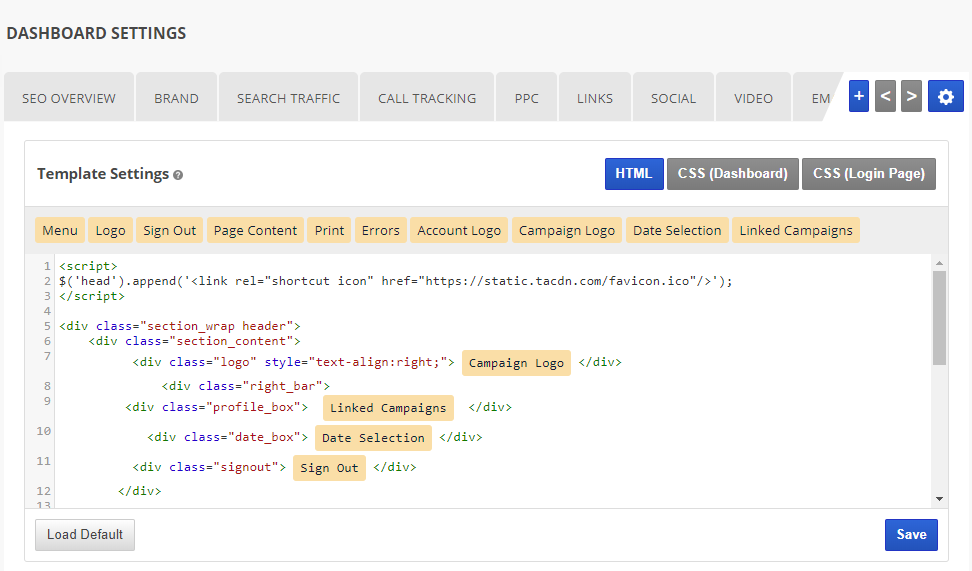
Fig. 3. Customize marketing dashboard design with HTML and CSS editor.
For those who don’t wish to be involved with CSS coding, a variety of CSS color schemes are built into the dashboard for quick selection.
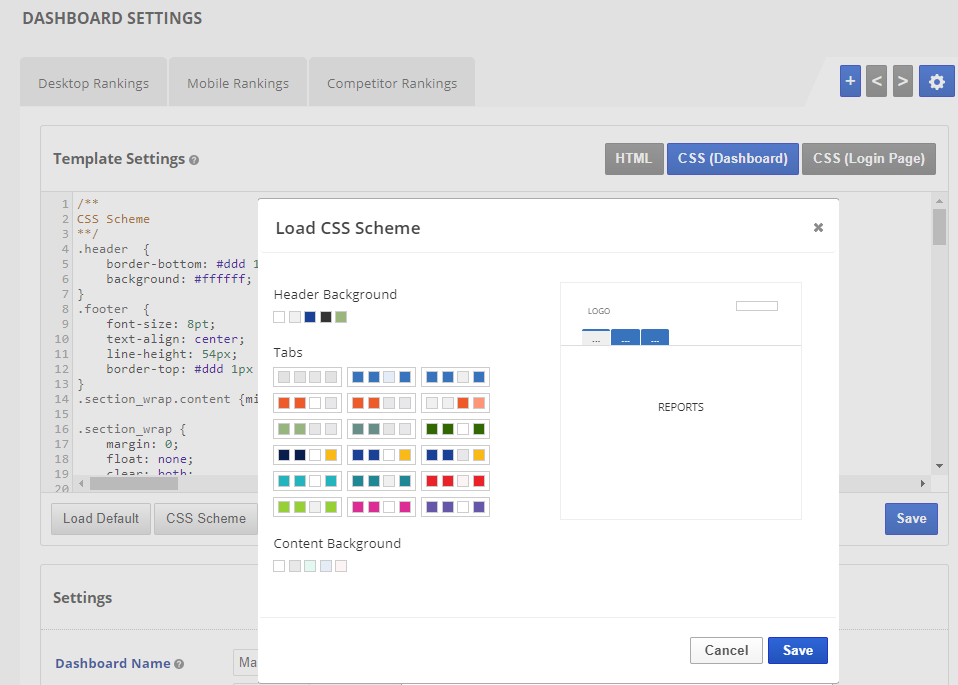
Fig. 4. CSS Scheme quick color selector
Custom Navigation Tabs and Layout
One the most powerful customization aspects of the Marketing Dashboard is that it enables marketers to segment data by category, location, industry, etc. through the creation of separate web pages that display as navigation menu tabs. Each page can be named based on the type of content it contains, which can include a variety of Rank Ranger reports and graphs customized for the specific data type, plus embedded content such as a YouTube video message from your company, Google sheets, forms and more via the dashboard’s text boxes. Pages can also be set to external links, for example, your company’s contact form, blog feed, etc.
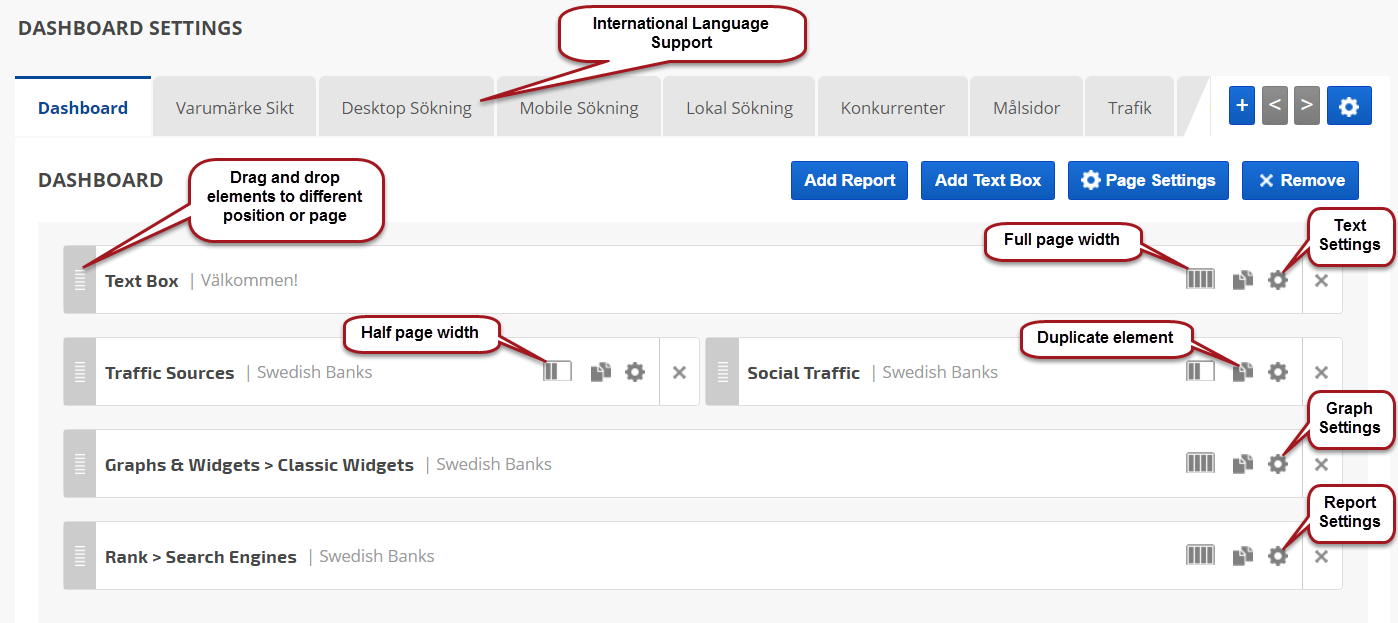
Fig. 5. Marketing Dashboard tools: drag and drop elements, size elements, international language support, access text box, graph & report settings
Page elements (i.e., reports, graphs, text boxes) can be dragged and dropped on the page or to a different page in the dashboard. Pages can also be dragged to different positions to adjust their menu display order. Additionally, elements on a page can be sized to either occupy full screen or half screen width (refer to Fig. 4) making it possible to place two elements side-by-side on a page. The result of the tab and layout customization options is that users may organize the elements within a dashboard to flow in a certain order and segmentation to create an optimal marketing reporting story for the viewer.
International Language Support
Page names and text boxes can be entered in the language of your choice. You may also choose from a list of available interface languages that determine report and graph labels.
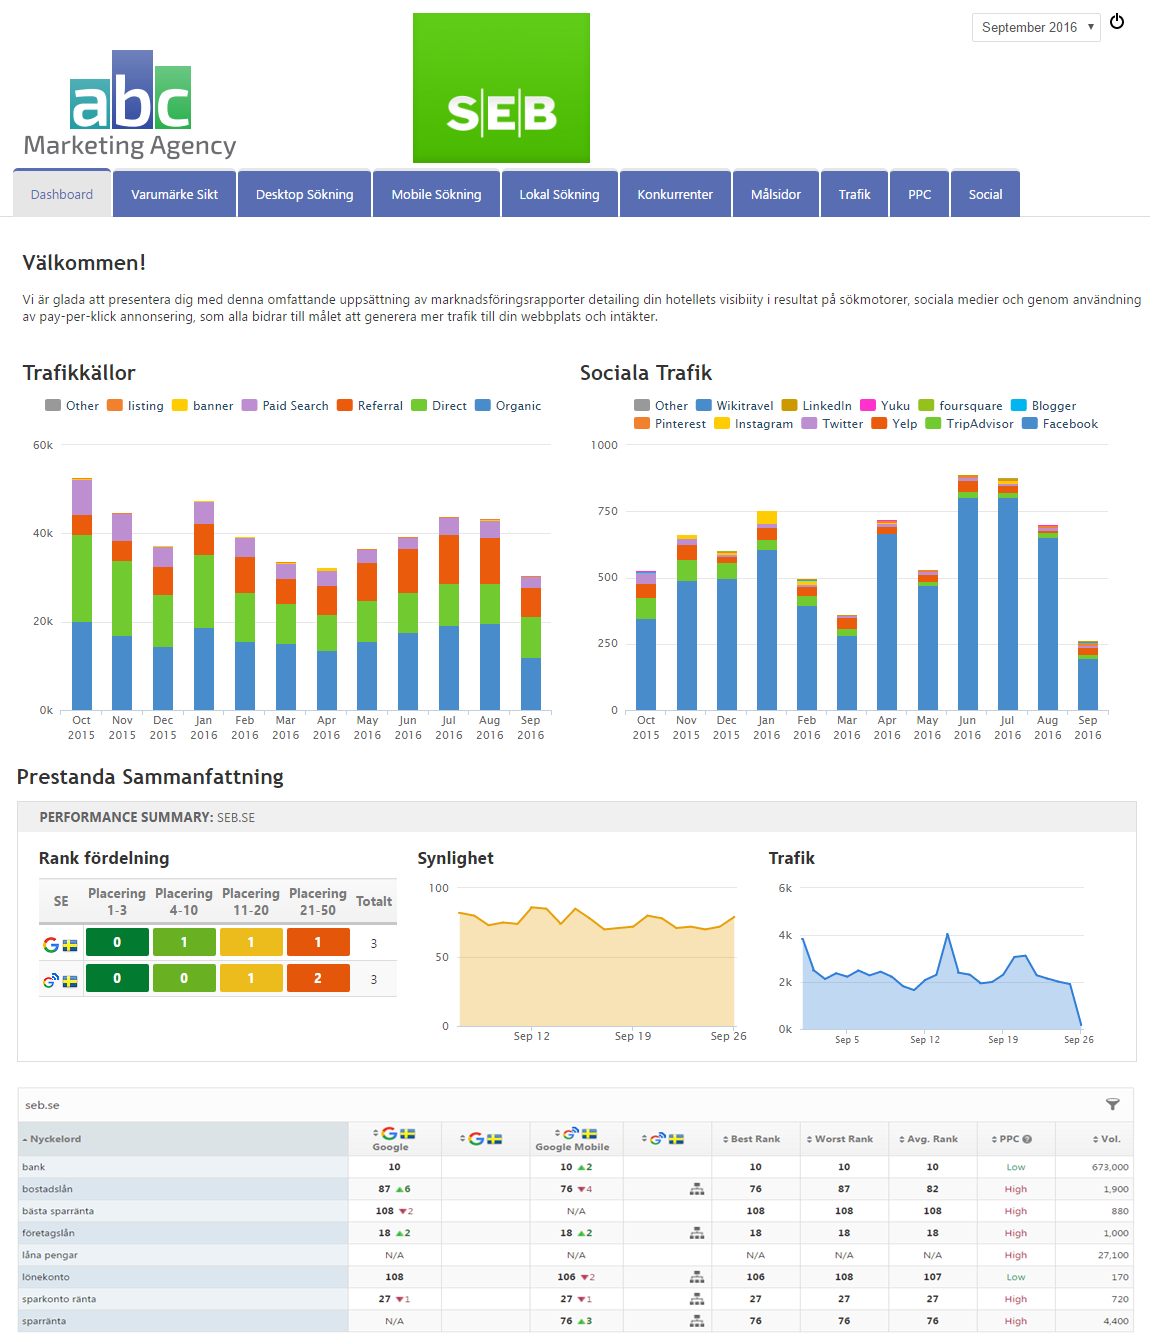
Fig. 6. Example of a Swedish Marketing Dashboard page based on the settings in Fig. 5. displays a text box with 2 graphs side-by-side beneath the text, followed by a performance summary widget and search engine rank report.
Enhanced Marketing Storytelling
The new Dashboard was born out of the idea that data reporting can lack a certain level of fun interaction and overall communication. In the interest of creating the more appealing marketing story delivery format, we focused on building a tool that bridges the communication gap between a report and its viewer. We have striven to create a communication dynamic that allows a viewer to fully absorb information in a comprehensive and meaningful manner. As a result, the Marketing Dashboard presents a new way of thinking about the communicative abilities of data dashboards.
Interactive KPI Reporting
Designed to take data reporting communication to a new level of dynamic interaction, the Marketing Dashboard displays active data allowing the viewer to interact by hovering over search metrics in graphs for more detail, clicking to change the sort of tabular data, viewing a video, completing a form and more. We believe that engaging the viewer in this manner improves the ability of absorbing a report’s content in more a comprehensive capacity, thereby increasing the impact of any given report.
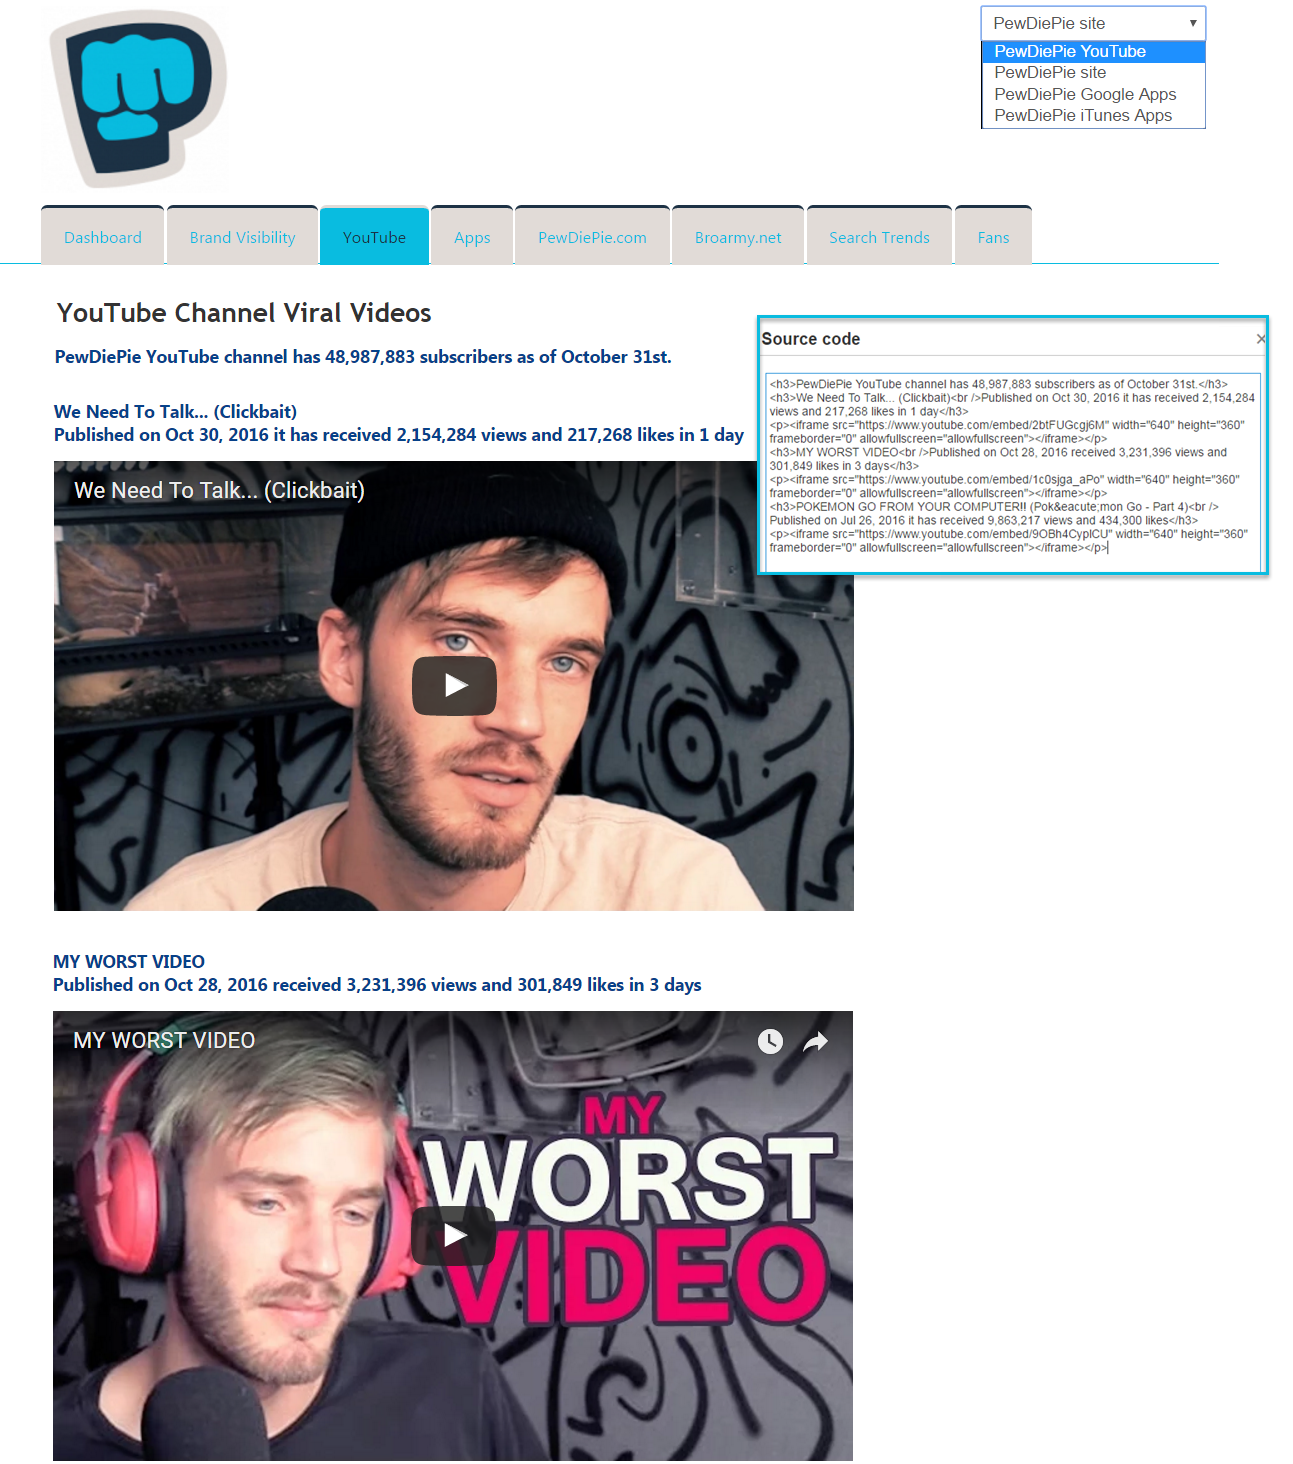
Fig. 7. Example of YouTube videos embedded in a Marketing Dashboard page
Text Boxes and Scheduled Messages
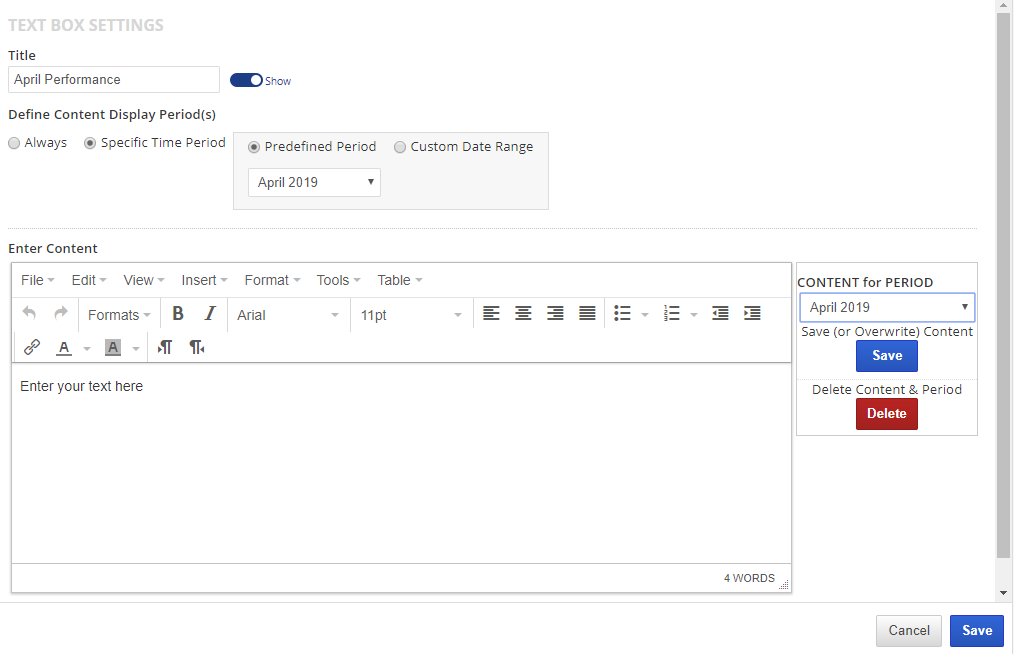
Resolving the potential for miscommunication when numbers don’t tell the full story, enhanced text box functionality bridges the gap between the creator of a report and its viewer. This feature enables messages to be static or scheduled based on custom time periods.
Text boxes can be inserted wherever the need arises to explain the content of a report or to simply share a message in text, image or video format, and they can also be used to include interactive content such as links, videos, forms, surveys, event registration and more. From the viewer’s perspective the inclusion of personalized content within their marketing KPI dashboard presents the potential to better understand complex data reporting, as any data or media within the dashboard can be qualified using a variety of communication methods.
Marketing Dashboard Templates
The Marketing Dashboard Template feature provides users with the opportunity to save their custom layout (style & HTML), dashboard settings and pages with all report and text box settings, and apply them to another campaign for easy replication. Multiple templates can be created for a variety of client types, for example, local business, small/medium online business, enterprise clients, e-commerce, brand-reputation management, social media focus, link building, etc.
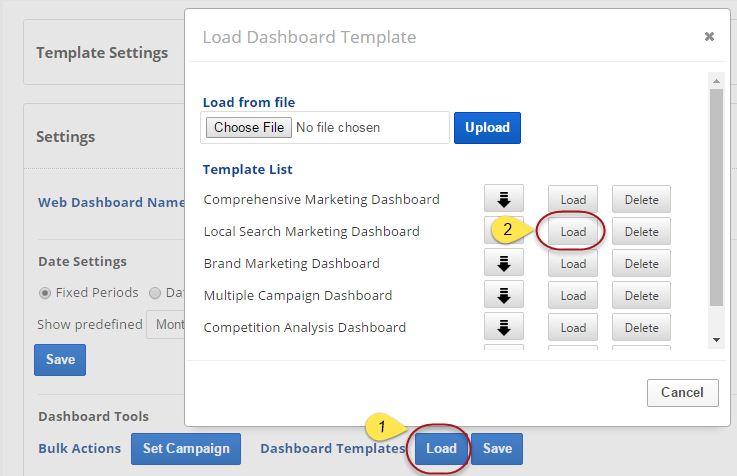
Fig. 8. Loading a Marketing Dashboard template
Using self-created templates or pre-designed templates available in our Marketing Dashboard Template Library, loading a template takes seconds. Once a template is loaded and campaign data applied, any desired changes to logo, text, reports or color scheme can be accomplished in a fraction of the time it took to create the original template. And that revised template can be saved and downloaded for offline storage.
Multiple Dashboards with Single Sign-On
A versatile Link To Profile feature enables a single sign-on dashboard for clients with multiple campaigns each requiring their own marketing dashboard. This is a great solution for agencies that provide marketing reporting for:
- Businesses with many locations that want individual dashboards for each location, plus a corporate Portfolio Performance summary report (e.g., regional, national and international hotel chains, real estate firms, law firms, car dealerships, franchises, etc.).
- Companies with multiple web properties that want rank tracking of organic and mobile for their website plus mobile apps in Google Play and iTunes stores and their YouTube channel, and the ability to view all individual property dashboards with one login.
- E-commerce companies that have separate language-based websites with a need to view detailed individual site dashboards plus a company-wide performance summary dashboard.
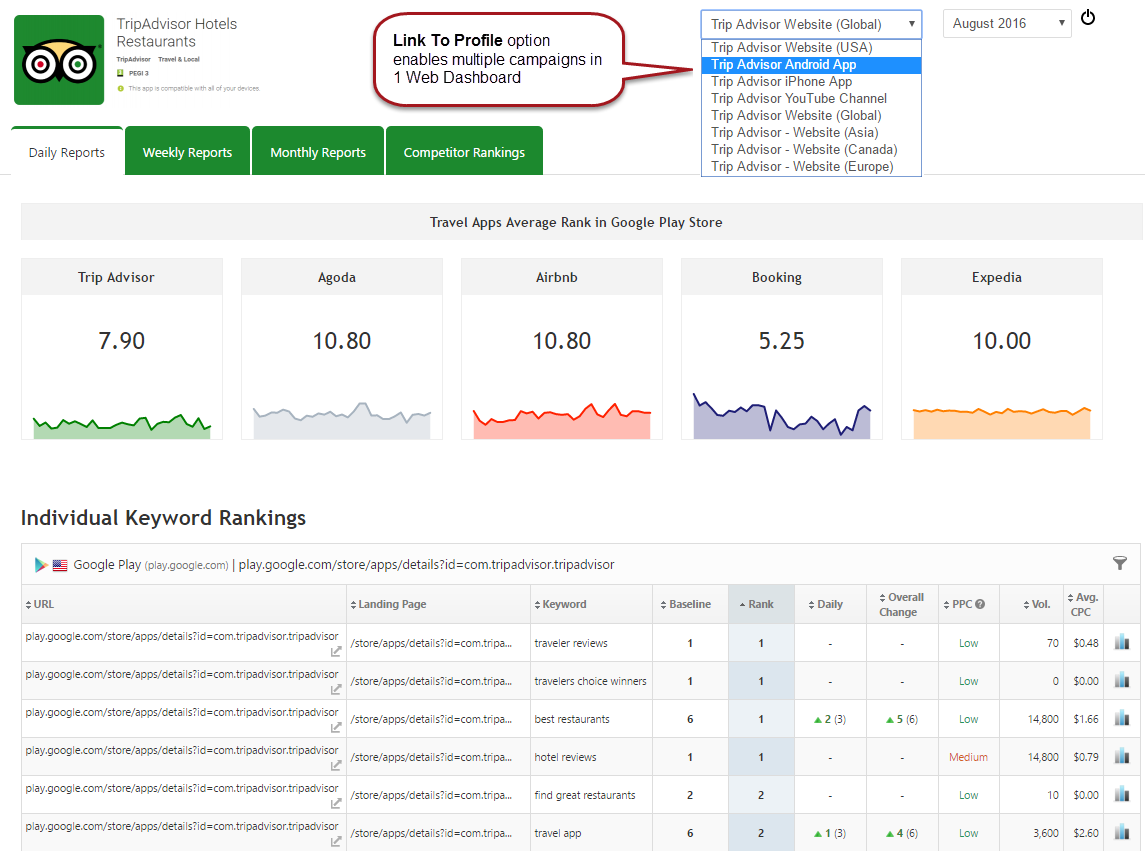
Fig. 9. Marketing Dashboard displaying multiple dashboards with a single sign-on
100% White Label Dashboard
With the premium custom domain service add-on marketers can create Marketing Dashboards that use their own domain instead of our white label reports domain.
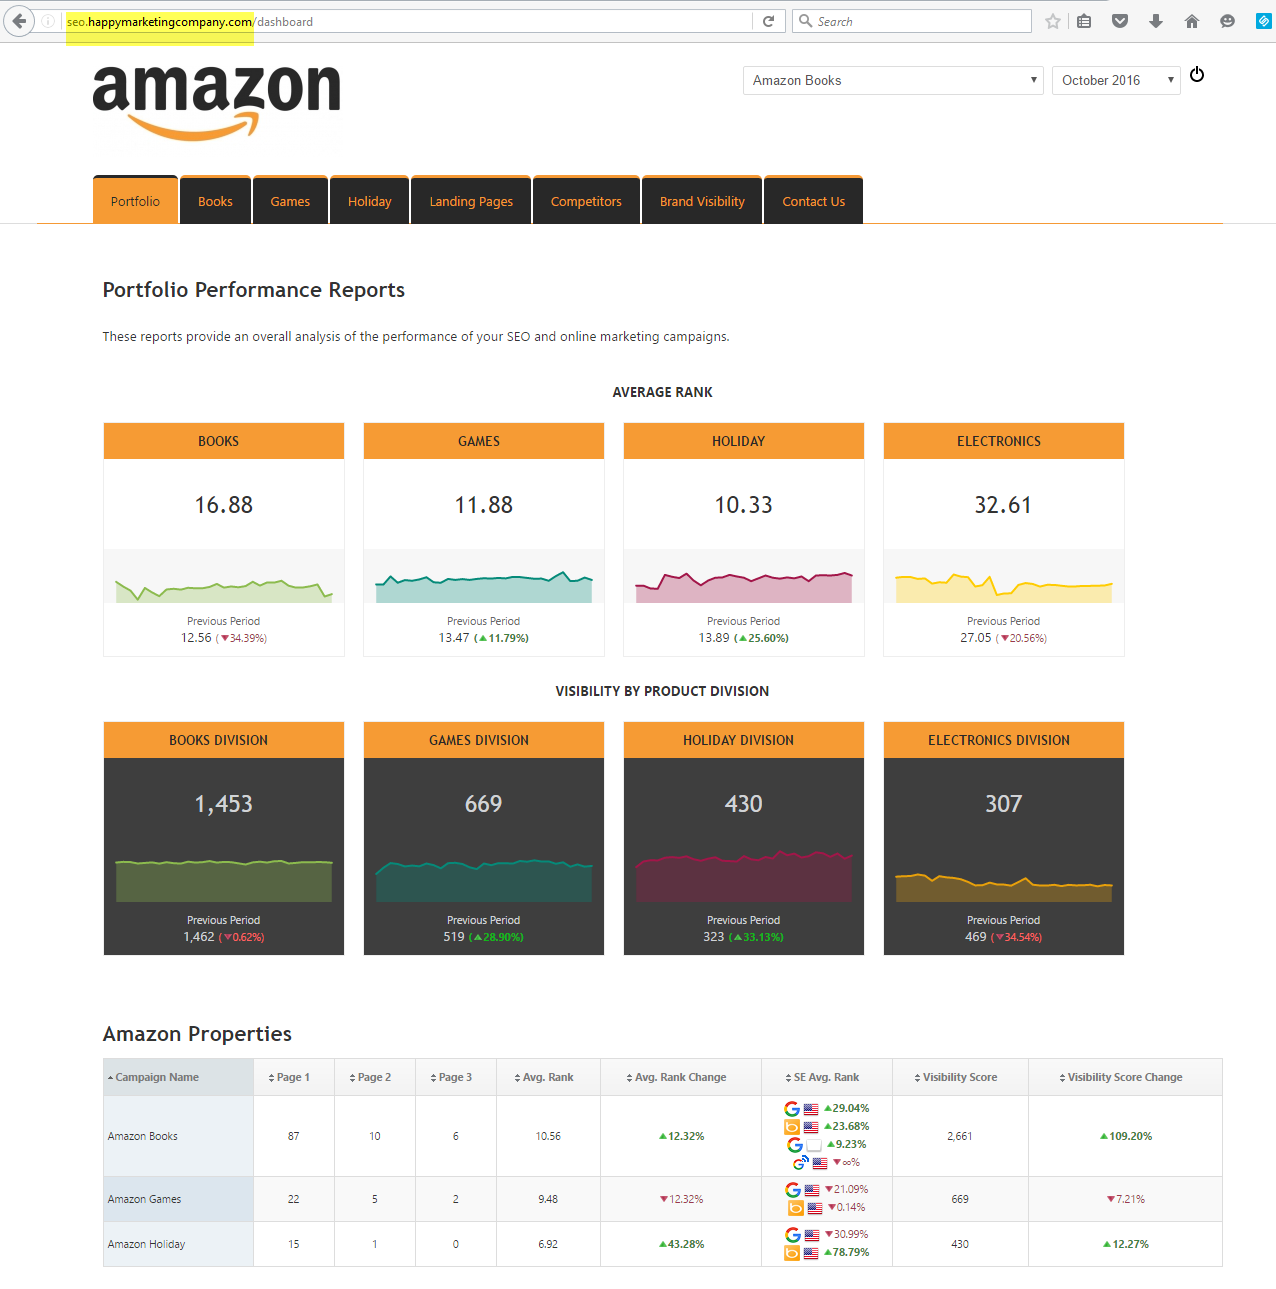
Fig. 10. An example of a Marketing Dashboard employing the custom domain capability
The Future in Marketing Dashboard Reporting has Arrived
With the release of Rank Ranger’s Marketing Dashboard, digital marketing reporting can shift from a one-dimensional and one-sided conversation to an entirely new story concept in custom report delivery and an improved level of communication. Embedding custom content from across the spectrum, introducing interactive elements, and integrating a truly branded look and feel are important data reporting additions. However, perhaps no other communicative factor is more important than inserting your own voice within your marketing reporting.
Tell Your Success Story with Interactive Marketing Dashboards
Start driving the conversation in an entirely personal and prolifically communicative manner that sets your ability to effectively communicate apart – that’s what this new Marketing Dashboard was created to help you do… and with style.
Customer Appreciation Benefits
Rank Ranger customers can click the person icon in the upper right toolbar and select Add New Package then scroll through the package list to discover your special customer loyalty marketing dashboard pricing. Please follow the upgrade package instructions or contact our service team for information on the best way to upgrade your custom package with Marketing Dashboards.
New Customers
You can get started here by choosing a Free Trial Reporting Platform + Dashboards package or a Stand-alone Dashboards plan without rank tracking that allows you to create reports only with third party integrated data.

