The implementation of a CRM system can radically change the approach to managing interaction with customers, but it is a long process, and the business owner may have questions such as “Will the system pay off?”, “And when will it pay off?”, “But when will our company go on break-even level after implementation?”.
It’s great when doubts arise, prompting critical thinking about the return on investment.
To answer these questions, there is an indicator of ROI (Return on Investment).
ROI is a ratio that measures the profitability of an investment by comparing the profit or loss to its cost. It helps estimate the potential return on investments in things like buying stocks, businesses, implementing systems, etc. ROI is usually expressed as a percentage and can be calculated using a specific formula.
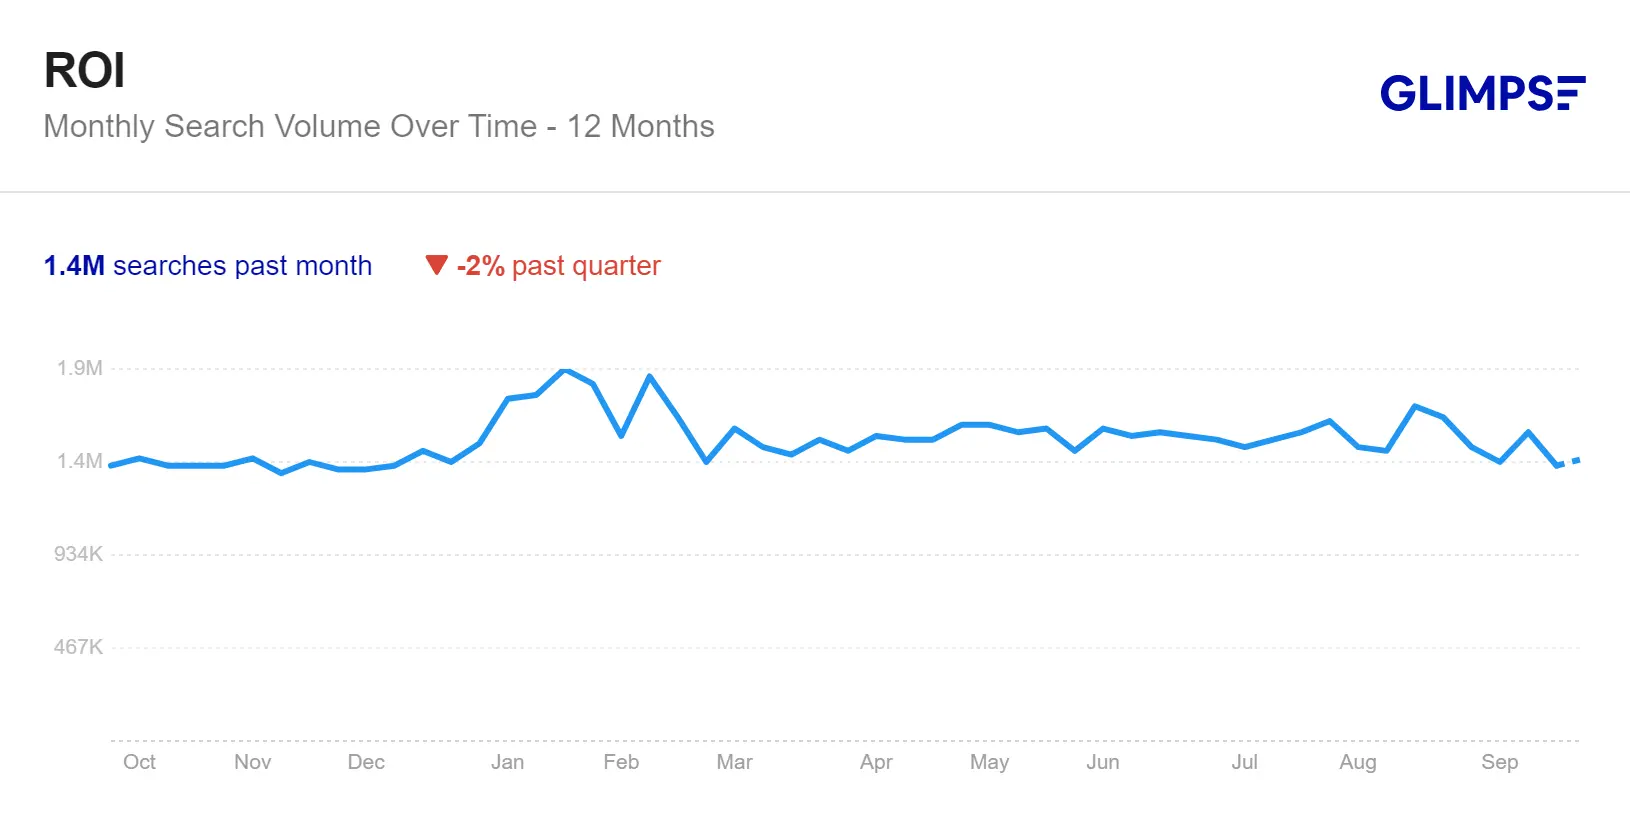
Users are looking for ROI every day, so let’s dive deeper into this topic.
ROI search relevance statistics for the last 12 months
In this article, we’ll look at 3 metrics to calculate the profitability and payback of a CRM implementation to help you make an informed decision for your business.
After the calculation, we will have answers to these questions:
- Will the system pay off?
- When will it pay off?
- When will the company break even after implementation?
What initial data is needed to calculate these indicators
As an example of the calculations, we used our client company ‘X’ and the following data:
The calculation period was 5 years.
Costs — we forecast costs for each year, that is, in the first year we invest in CRM.
Earnings — in year 1 they are zero, because we invested, each subsequent year we contribute our projected earnings.
The discount rate is an indicator that reflects the percentage by which money loses its value from year to year.
The formula for calculating the discount rate (DR):

Find the future value (FV)
Future value is the amount of money you expect to receive or have in the future. For example, if a company invested $40,500 and expects to receive $313,140 in 5 years, then FV = 313,140.
Find the present value (PV)
Present value is the amount of money you have right now. In our example, it is $40,500, that is, PV = 40,500.
Define the number of periods (n)
This is the number of years (or other periods) that your money will grow. In our example, it is 5 years, i.e. n = 5.
Let’s calculate the discount rate:
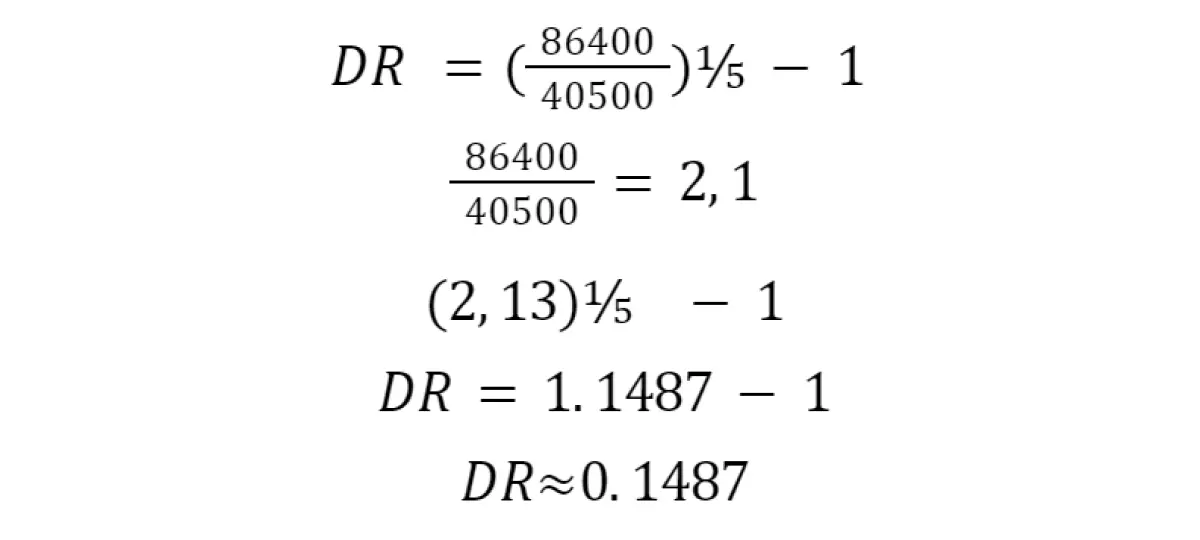
If expressed as a percentage, the discount rate (DR) for company “X” will be approximately 14.87%.
We collect all the data in a table:

Let’s calculate NPV, IRR, and ROI
IRR—internal rate of return
The IRR value shows what percentage of profit you will get from your invested money.
The IRR calculation assumes that NPV (net reduced income) = 0.
When calculating the IRR indicator, we are looking for such an internal percentage that makes our expenses and the income received equal. This means that for this percentage of income, we earn as much as we spend on the project.
When the NPV (net presentable income) is zero, it means that the project or investment is profitable as a whole, because there is an exact compensation of all costs.
IRR formula:
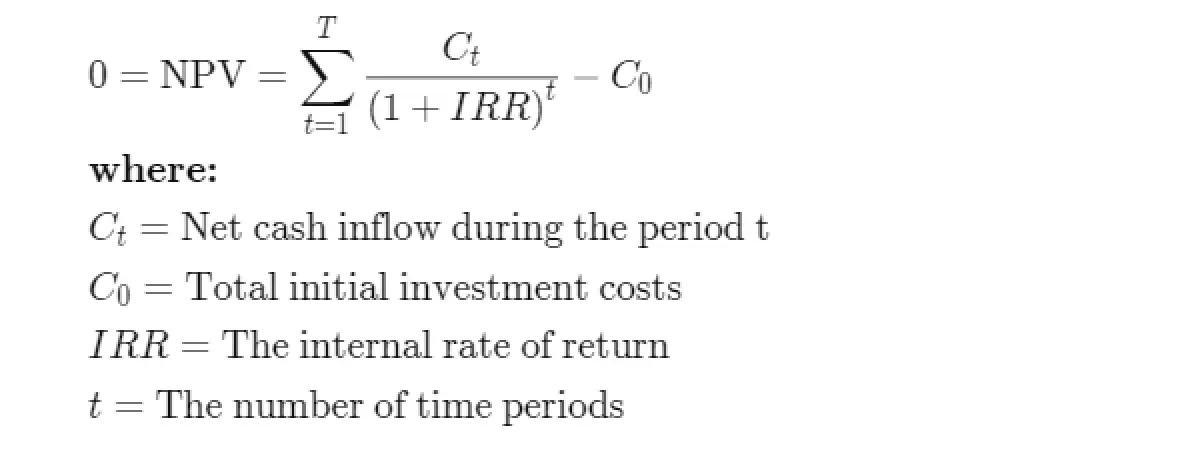
- When calculating the IRR, we take into account the conditional value of NPV = 0
- Excel also has an IRR calculation function. We recommend using it.
Calculation of IRR (Internal Rate of Return)

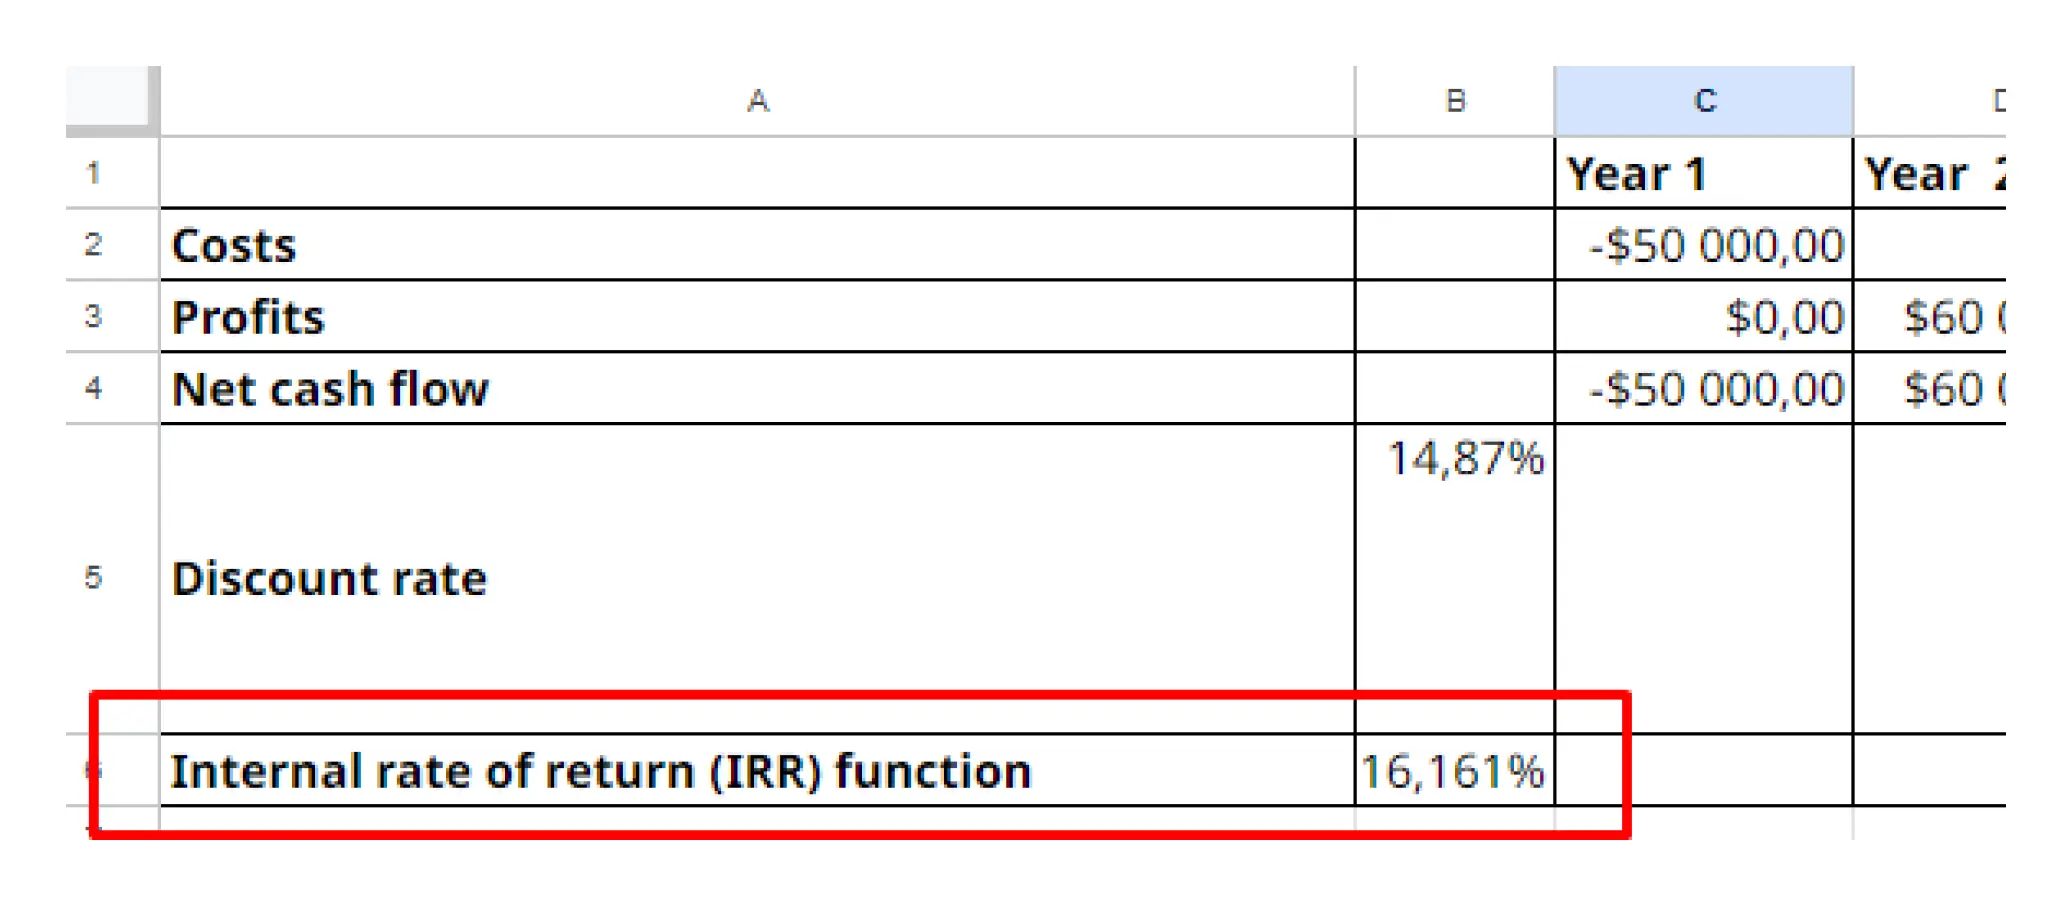
What we did here:
We made:
- costs
- earnings
- net cash flow
- discount rate
And calculated the IRR in Excel by selecting the IRR function:
IRR = (B4:G4)*B5,where
B4:G4 is the range of net cash flow;
B5 — discount rate.
IRR = 16.61%
The IRR must be higher than the discount rate, then the project can be considered profitable.
The higher the IRR, the more profitable the project.
NPV — Net Present Value
This is the difference between the value of cash inflows and cash outflows in the company.
NPV is used in capital planning and investment planning to analyze the profitability of a planned investment or project.
What is important to know about NPV when calculating ROI:
Projects with a positive NPV are worth implementing, while projects with a negative NPV are not.
The standard NPV formula:
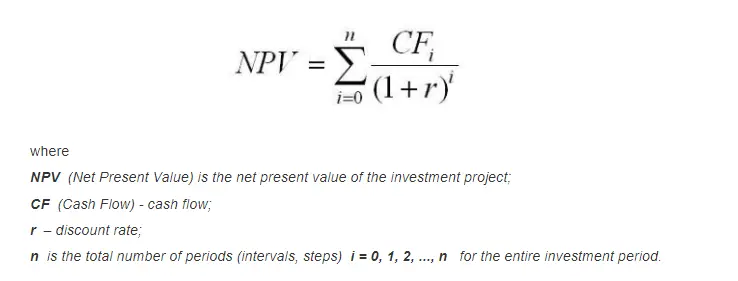
Simplified NPV formula:
N P V=Today’s value of expected cash flows – Today’s value of invested money
Excel also has an NPV function that you can use to calculate net present value.
We recommend using Excel for calculation.
For the correct calculation, we need to calculate the discount factor.
A discount factor is an indicator used to reduce or “discount” future amounts to their present value.
For example, using a discount factor allows you to estimate how much a future sum of money or income stream is worth today.

How we did it:
In the empty cell of the discount factor, enter the following data:
=1/(1+B1^B4) – Enter, where
B1 – discount rate (press F4 so that we can extend this formula for each year)
B4 – year;
The next step is to calculate the discounted costs:
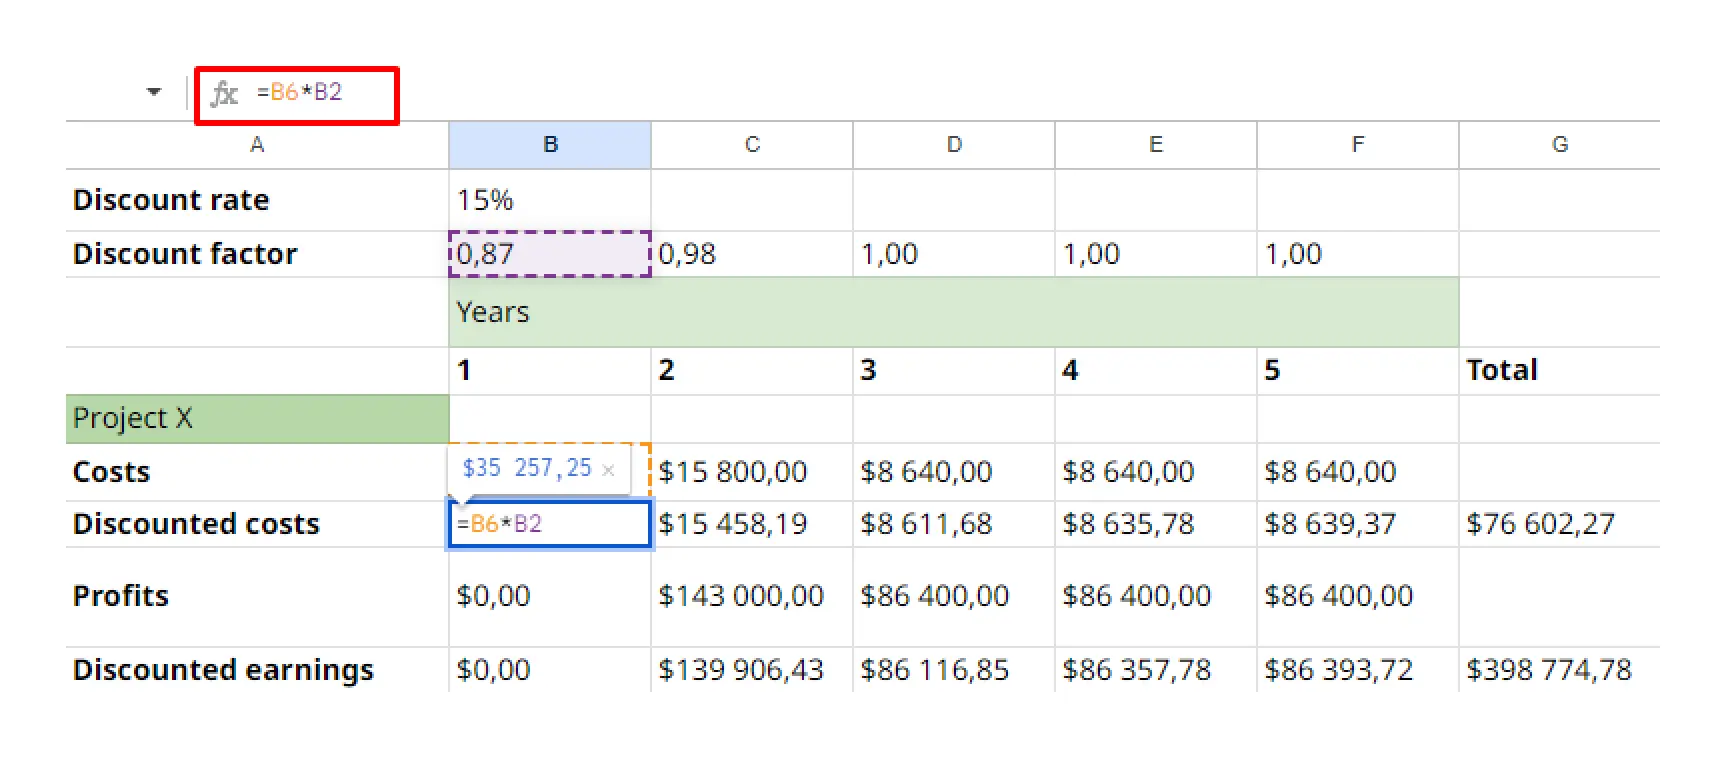
We extend calculations for all years.
We calculate discounted earnings in the same way:
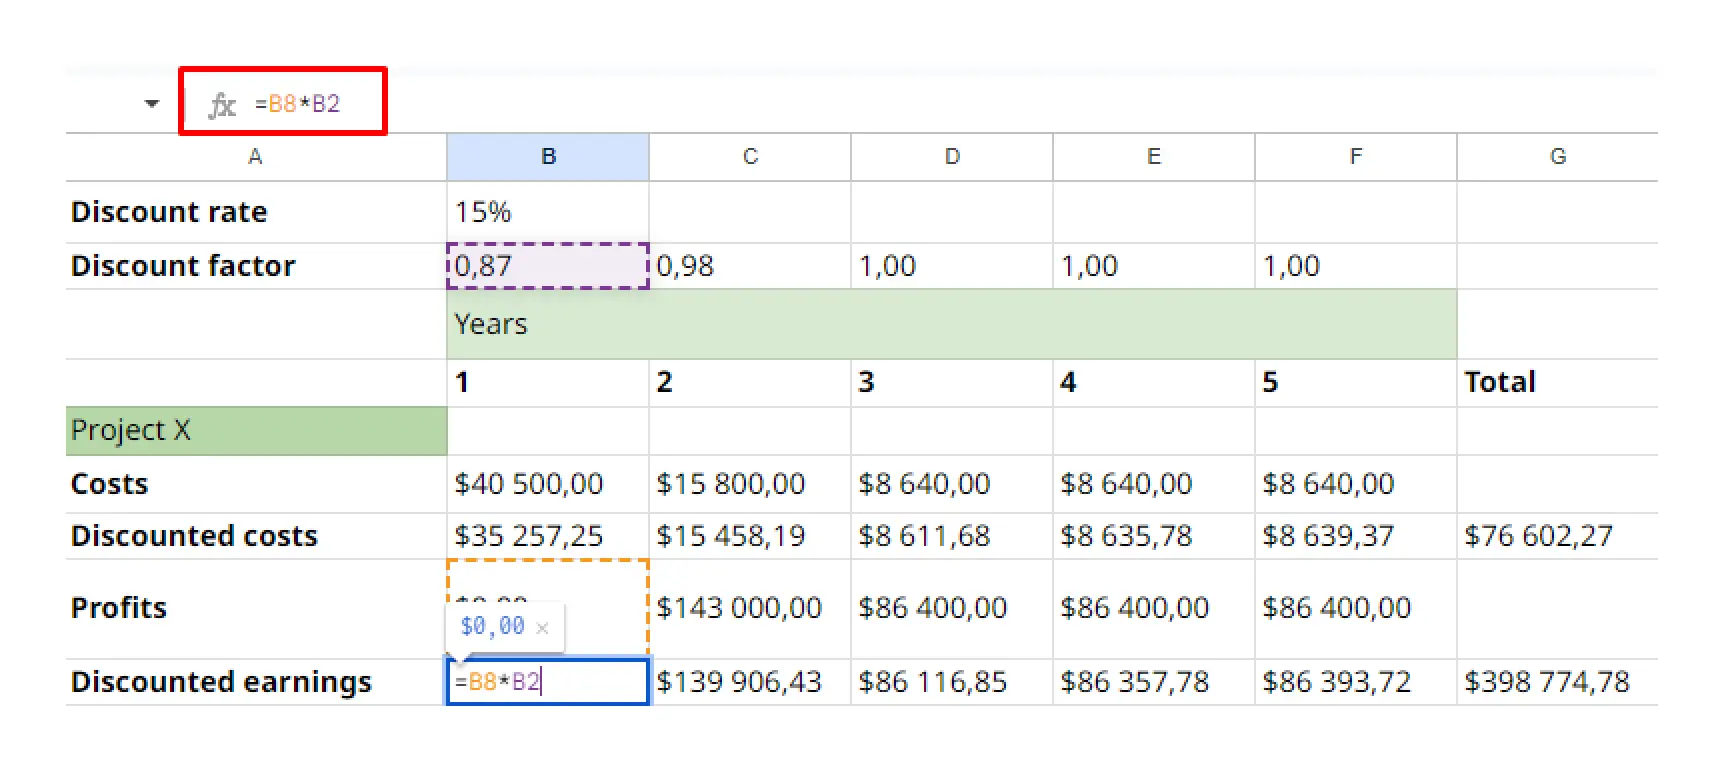
The TOTAL column is the sum of the calculations via the SUM function.
We calculate NPV using a simplified formula:

NPV for this project for Company “X” = $322,172.50
That is, for company “X”, the investment in the CRM system is worth implementing because the NPV has a positive number.
We calculate the ROI
ROI-Return on Investment.
What this means:
ROI (Return on Investment) is a percentage that shows how effective your investment or investment of money is.
If your ROI calculation is positive, then your investment is profitable, if it is negative, it is not worth investing!

We calculated as follows:
ROI = Amount of discount earnings – Amount of discount costs/Amount of discount costs
ROI = 398,774.78–76,602.27/76,602.27 = 4.205
We convert it into percentage = 420.5%
For company “X”, the ROI from the implementation of CRM is positive.
The investment is profitable.
After these calculations, we will calculate for which year the implementation of CRM will reach the break-even level and when it will pay off.
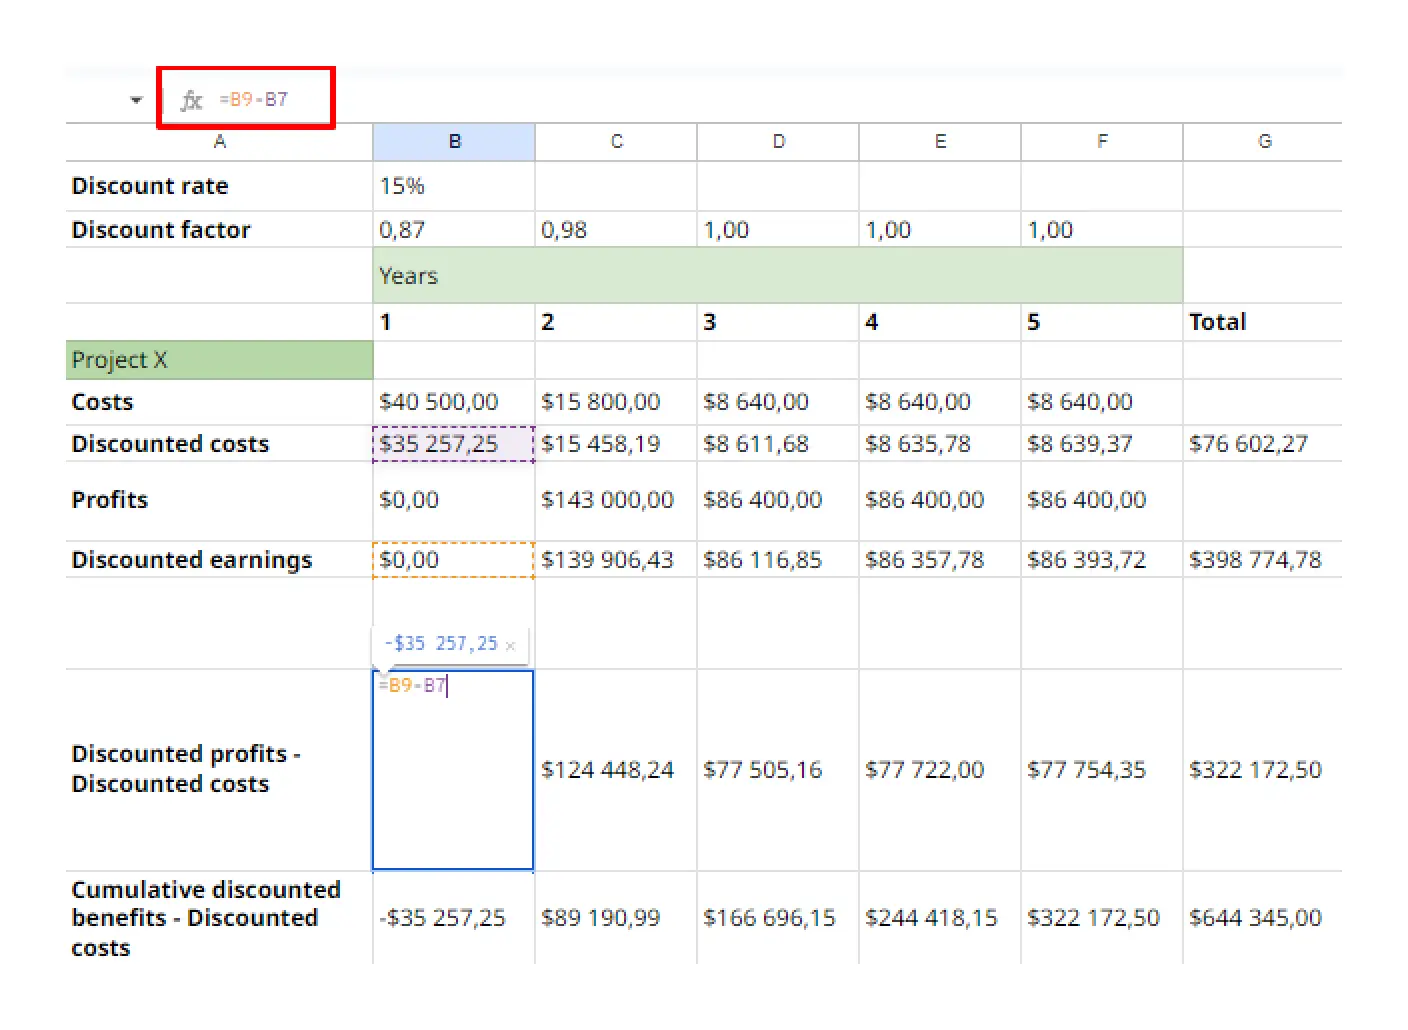
The break-even level is calculated as follows:
Discounted earnings – Discounted costs
From the table, we can see that company “X” will break even in the second year.
When the investment will pay off:
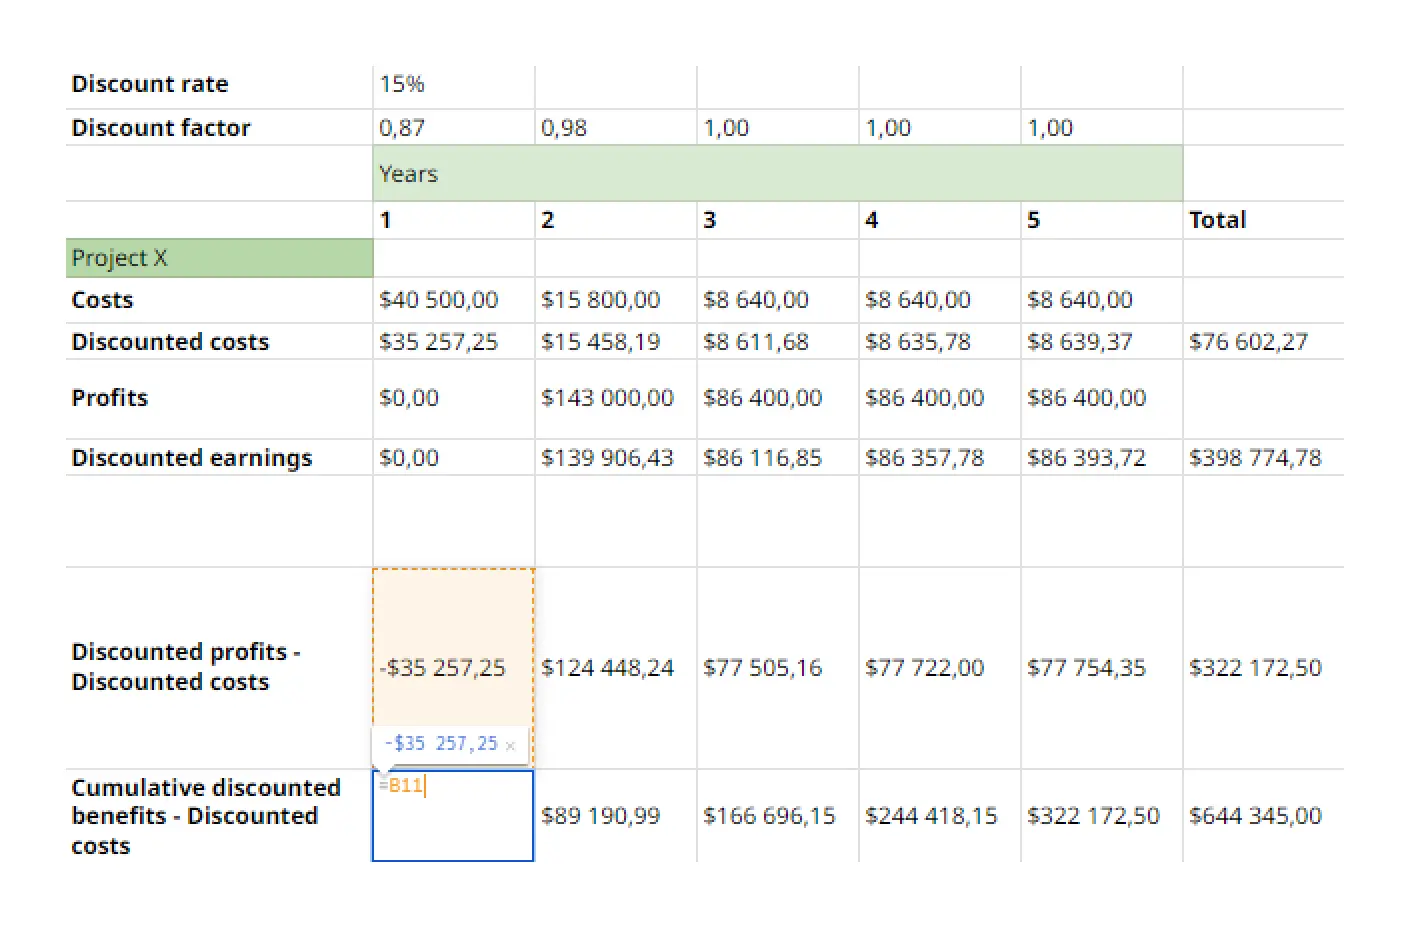
We calculate as follows:
We draw the first cell from the discounted earnings — discounted expenses.
Furthermore, we calculate the second by the formula:
B12 (1 cell sum of discounted earnings — costs)—C11 (2 cells of discounted earnings — costs)
In the following years, we will extend the formula.
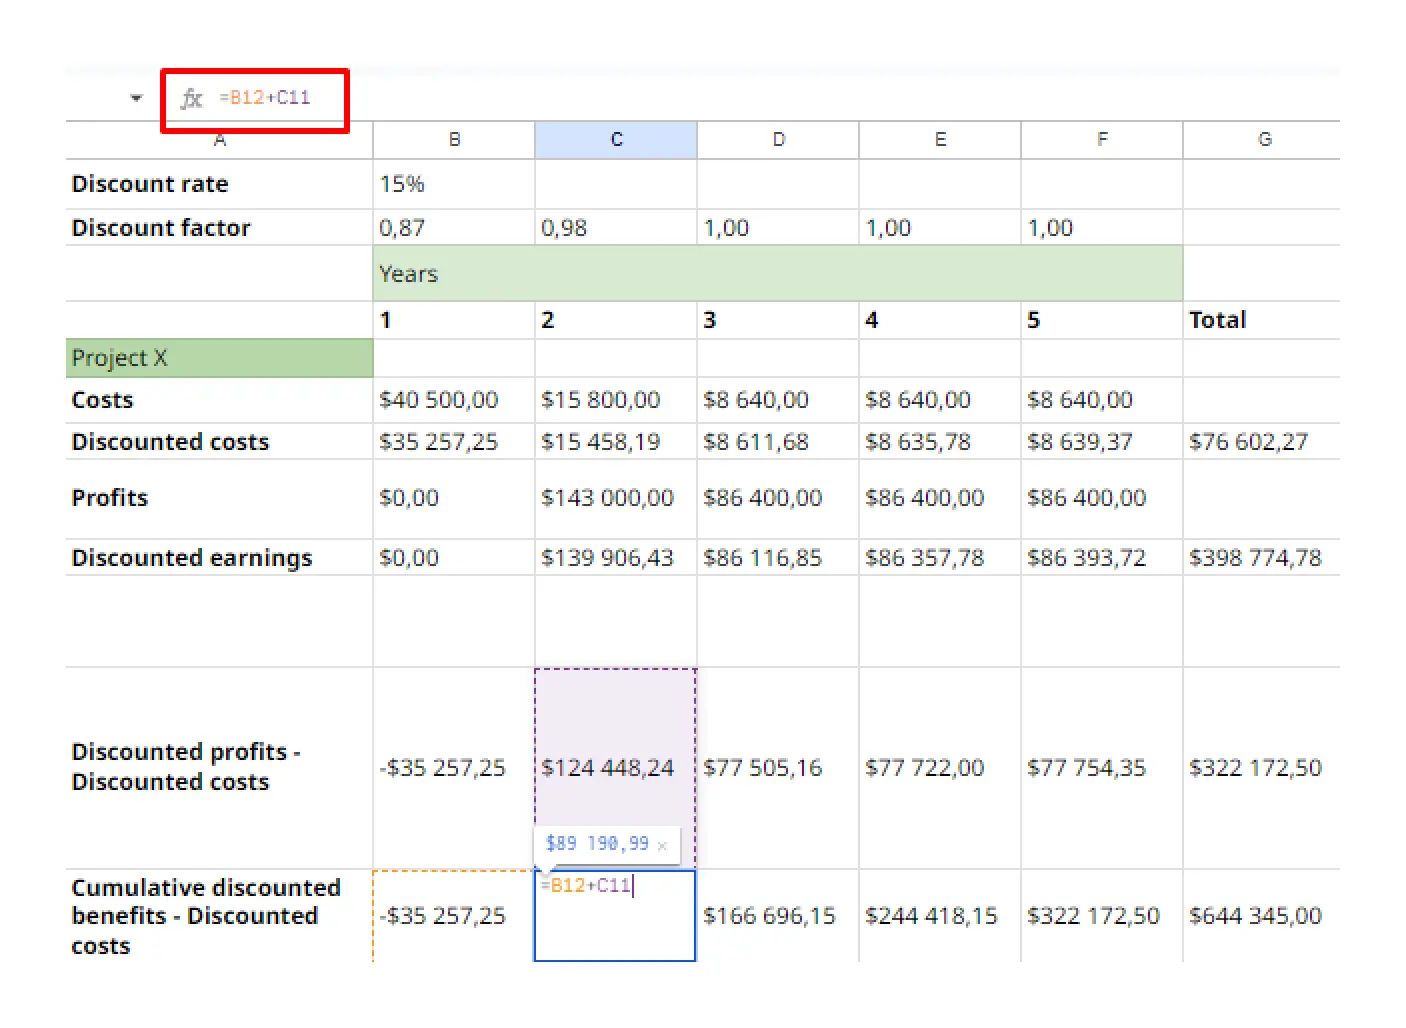
And we get that company “X” will pay back its investment in 2 years.
After calculating all the values, at the output we get the following values in Excel:
IRR

NPV, ROI
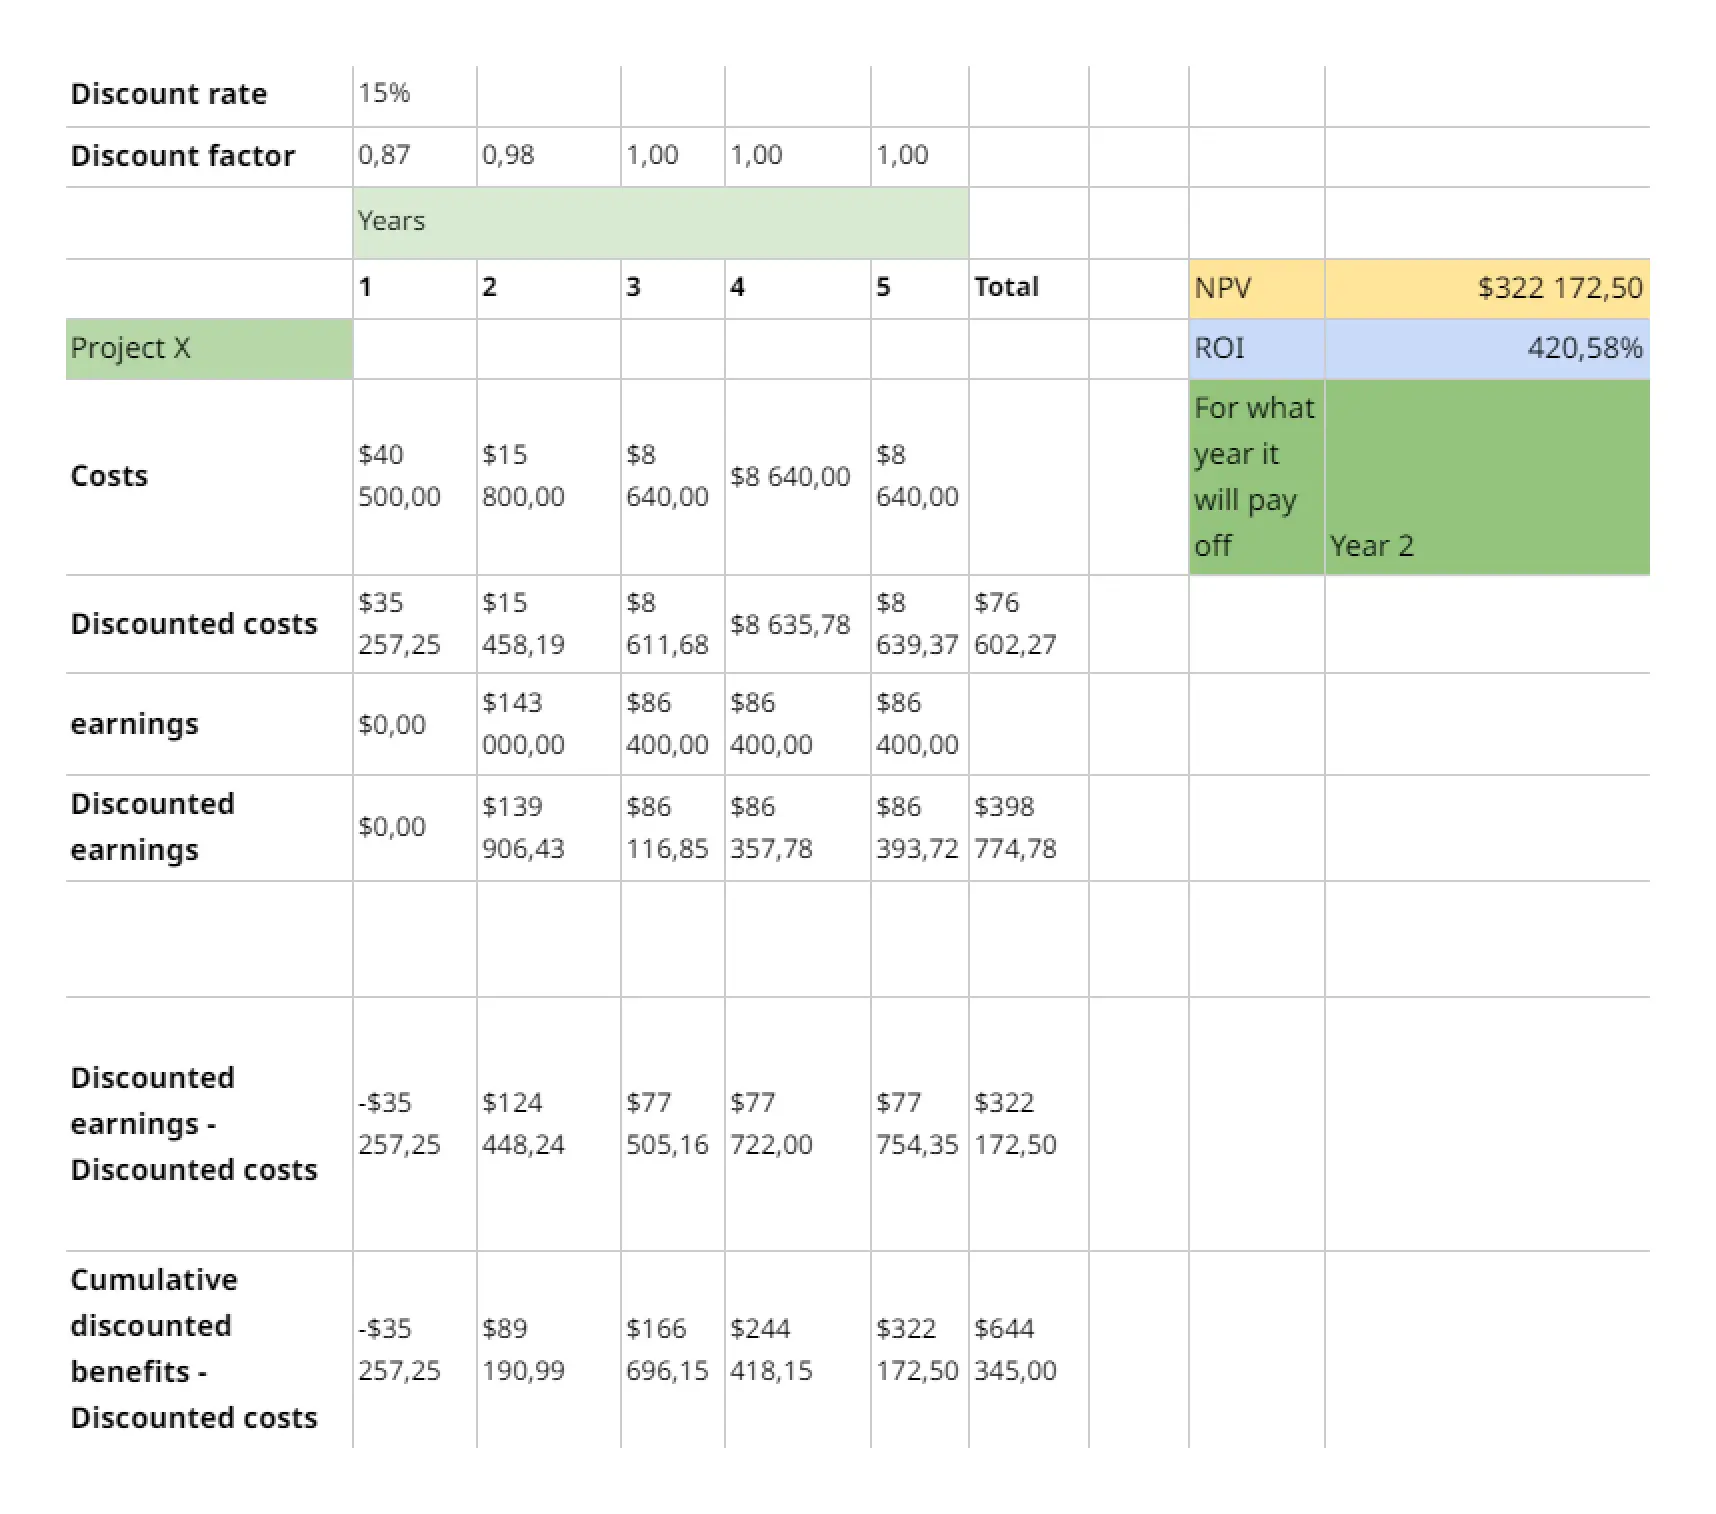
How to check if your calculations are correct
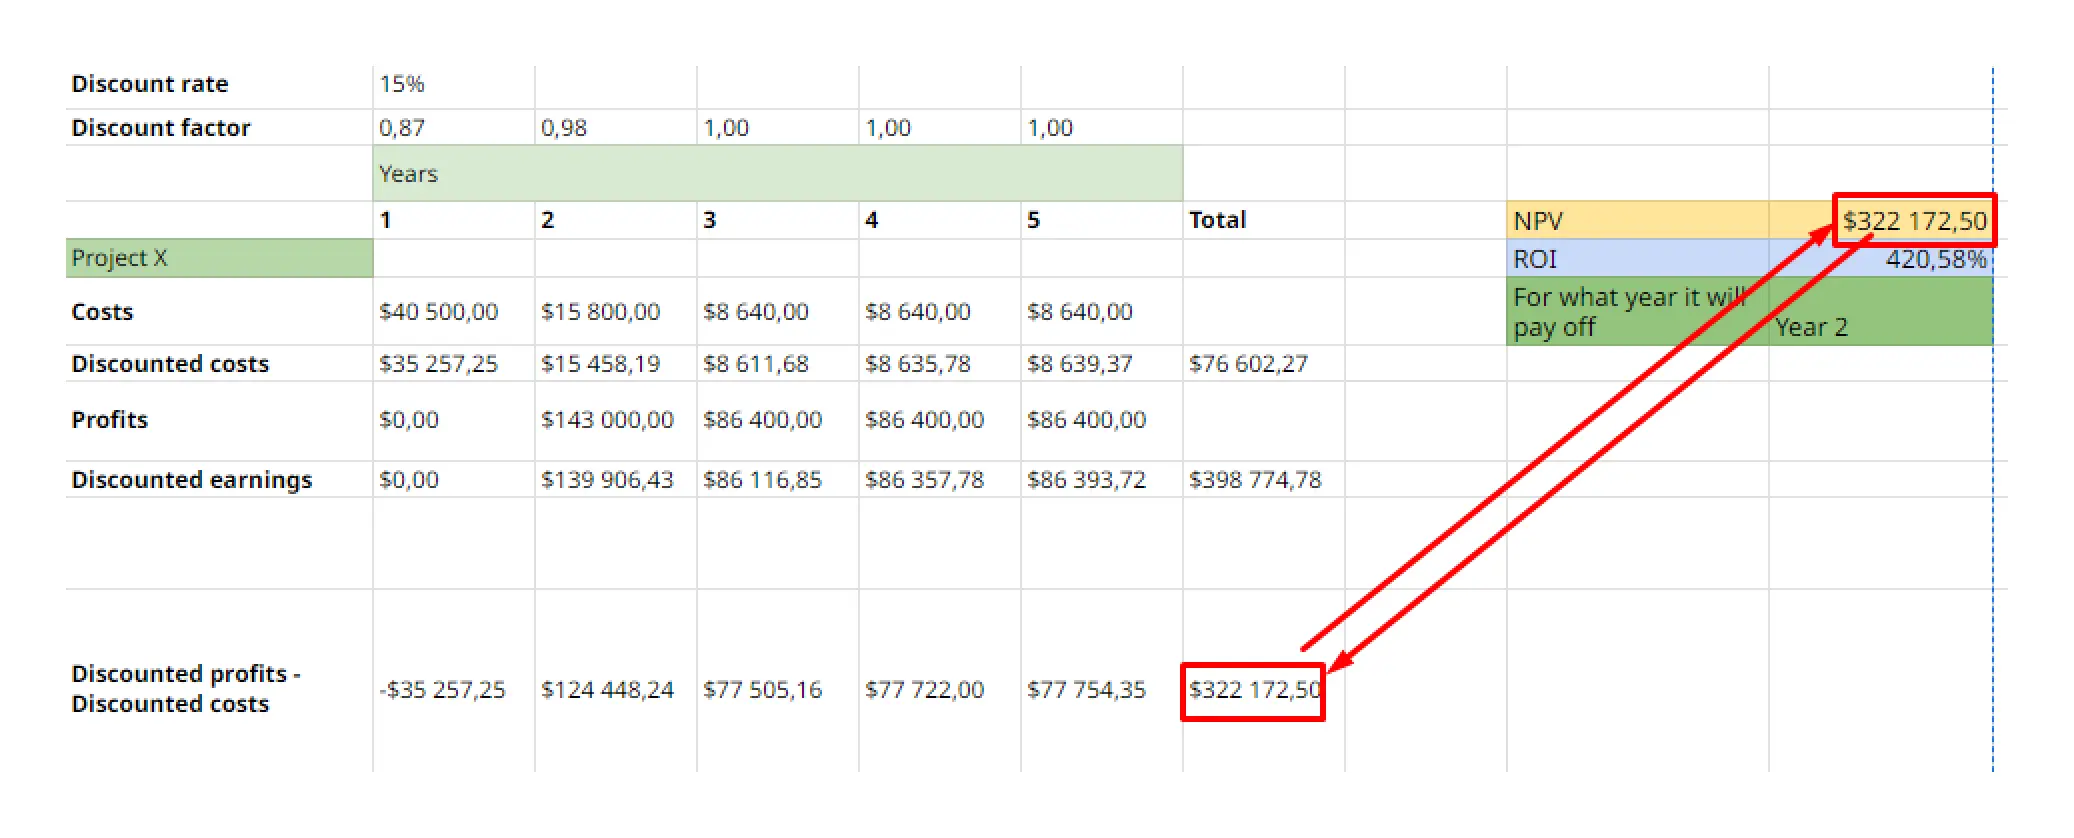
When you calculate the total amount over 5 years of the difference between discounted earnings and costs — this amount should match the NPV figure.
Conclusion
Having made the calculations above, Company “X” can safely implement CRM and be assured that the invested money will return to the company, or that CRM will pay for itself. We make this conclusion because:
Company “X” invested $40,500 in the CRM system in the 1st year, and spent the next 4 years on technical support. At the same time, earnings were higher than expenses every year.
With the following initial company data:

Calculated DR (discount rate), IRR, NPV, ROI and got the following results:
- ROI (Return on Investment) : 420,58%
- NPV (Net Present Value) : $322 172,50
- IRR (Internal Rate of Return) : 16,161%
We conclude that for the company “X” the investment in the implementation of CRM is fully profitable.
The company will break even in 2 years and the investment will be fully repaid in 2 years.
Before making calculations, you should take into account all the factors and data specific to your company in order to make the most accurate calculations and make an informed decision.
Collect all the raw data for the calculation carefully and in detail, and only then start calculating.
If you have two offers from the company for similar investments, you can calculate both projects, compare indicators, and decide which project is more profitable for you.
Be sure to try to calculate the future project using these examples!
