Search Engine Optimization (SEO) takes a lot of time, concentration, and dedication. Some tasks demand regular attention, such as backlink analysis, keyword research, conducting site audits, and monitoring your rankings.
Luckily, you don’t have to do these SEO tasks completely manually, thanks to the power of SEO automation.
SEO automation is the process of leveraging tools to assist you with your SEO tasks by automatically handling them for you. All you have to do is regularly review the findings of these SEO tools, and resolve issues as and when they occur.
A whole host of SEO tasks can be automated, including site audits, competitor monitoring, internal link analysis, and even content creation. These tasks can be automated using SEO tools like Semrush, Google Search Console, and Google Analytics 4.
Read on to learn how you can free up time and focus on more essential tasks through the power of SEO automation.
How Automation Can Transform Your SEO
SEO is a long-term endeavor and never a once-off thing.
There are certain aspects of SEO that you need to check daily, weekly, monthly, and annually.
Given how rhythmic these checks can be, you’d be foolish not to introduce some automation into your SEO to-do list.
By using SEO tools to carry out routine tasks, you save yourself (and your company) tons of time, money, and resources. Why should you spend hours checking your website for issues when an SEO tool can do the job for you?
For example, you could use Semrush’s Site Audit tool to crawl your site and find broken internal links.
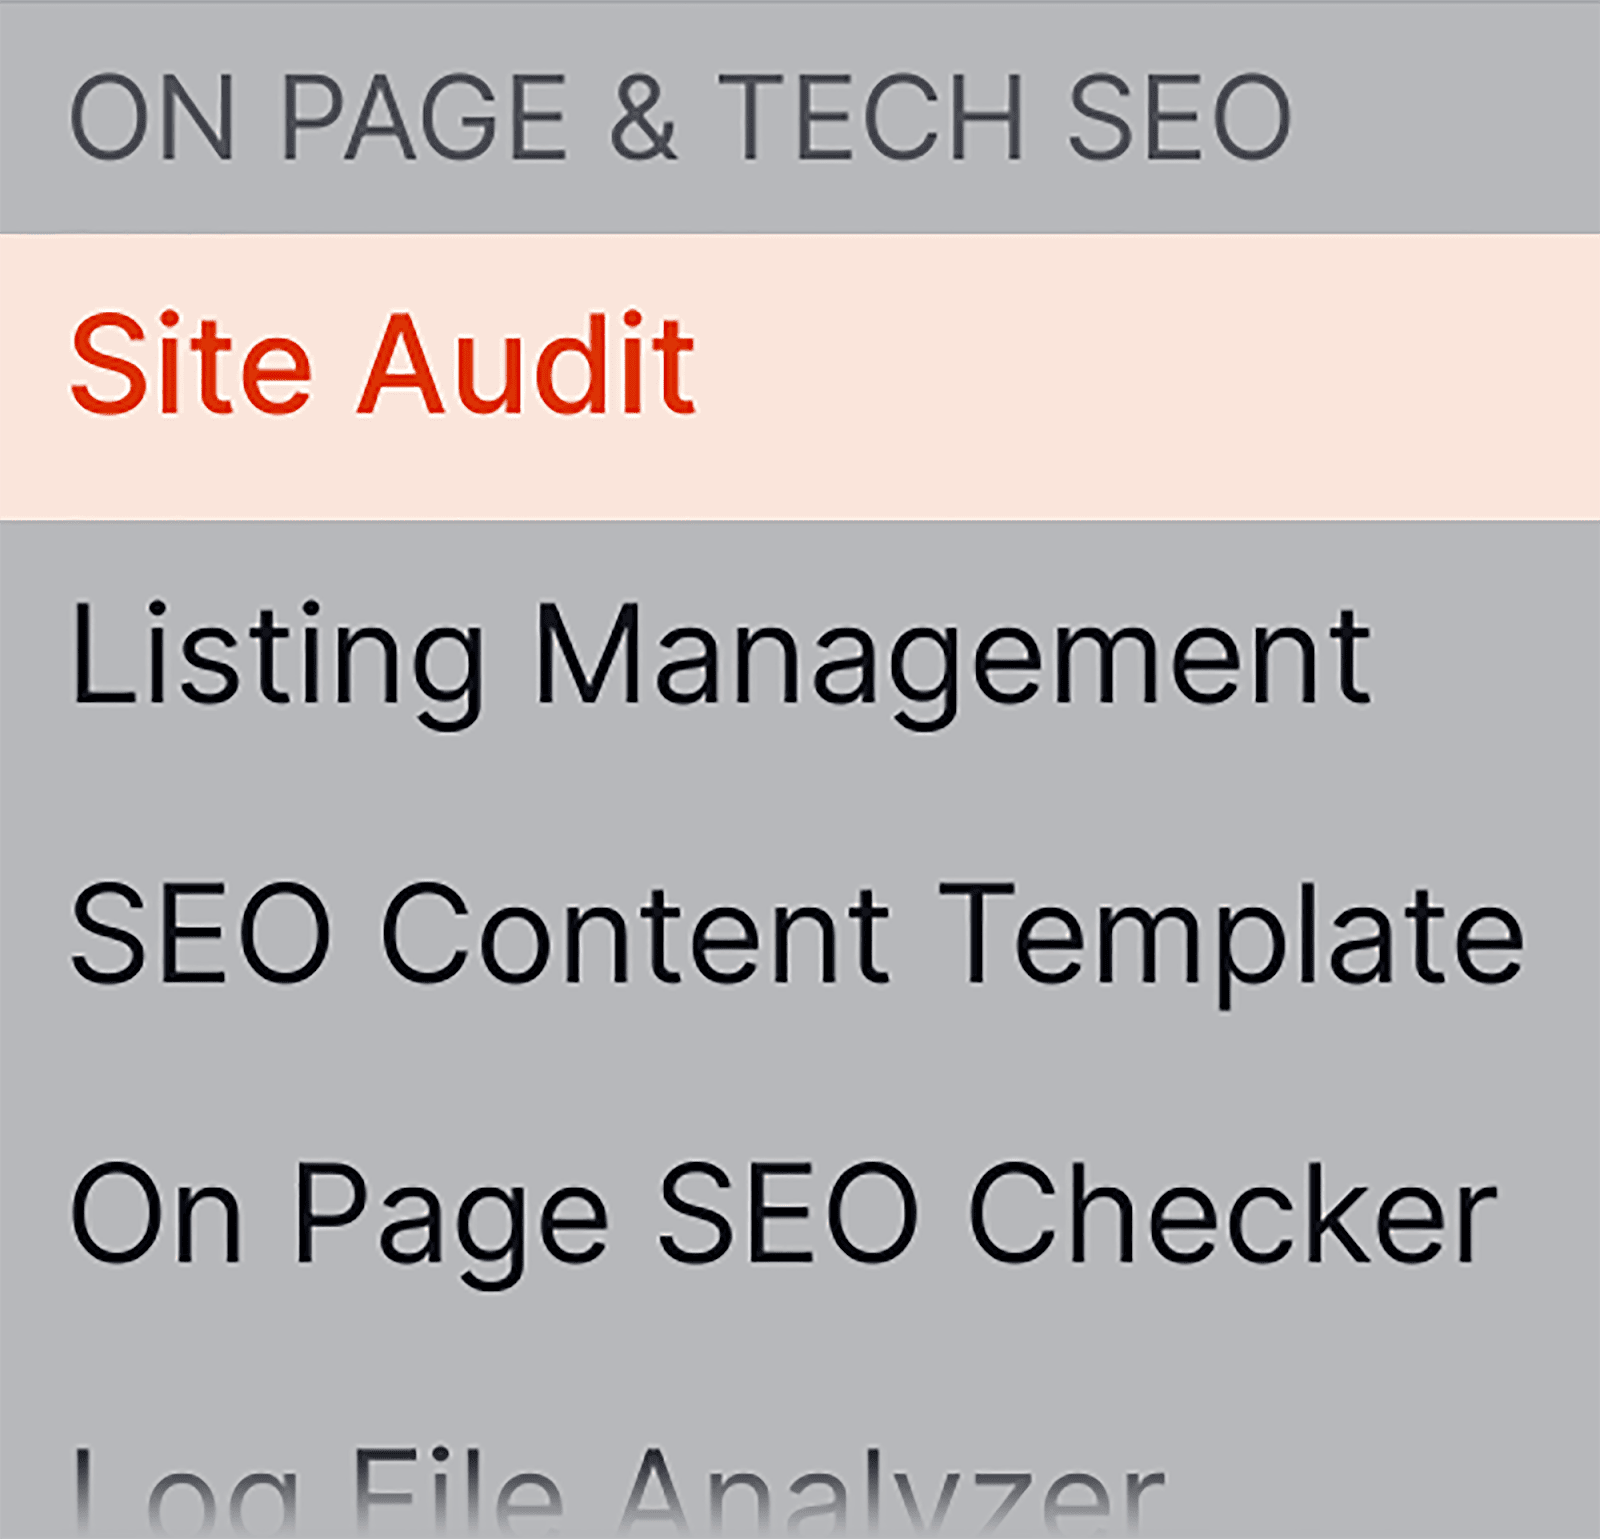
To do this, click on “Site Audit” in the menu on the left.
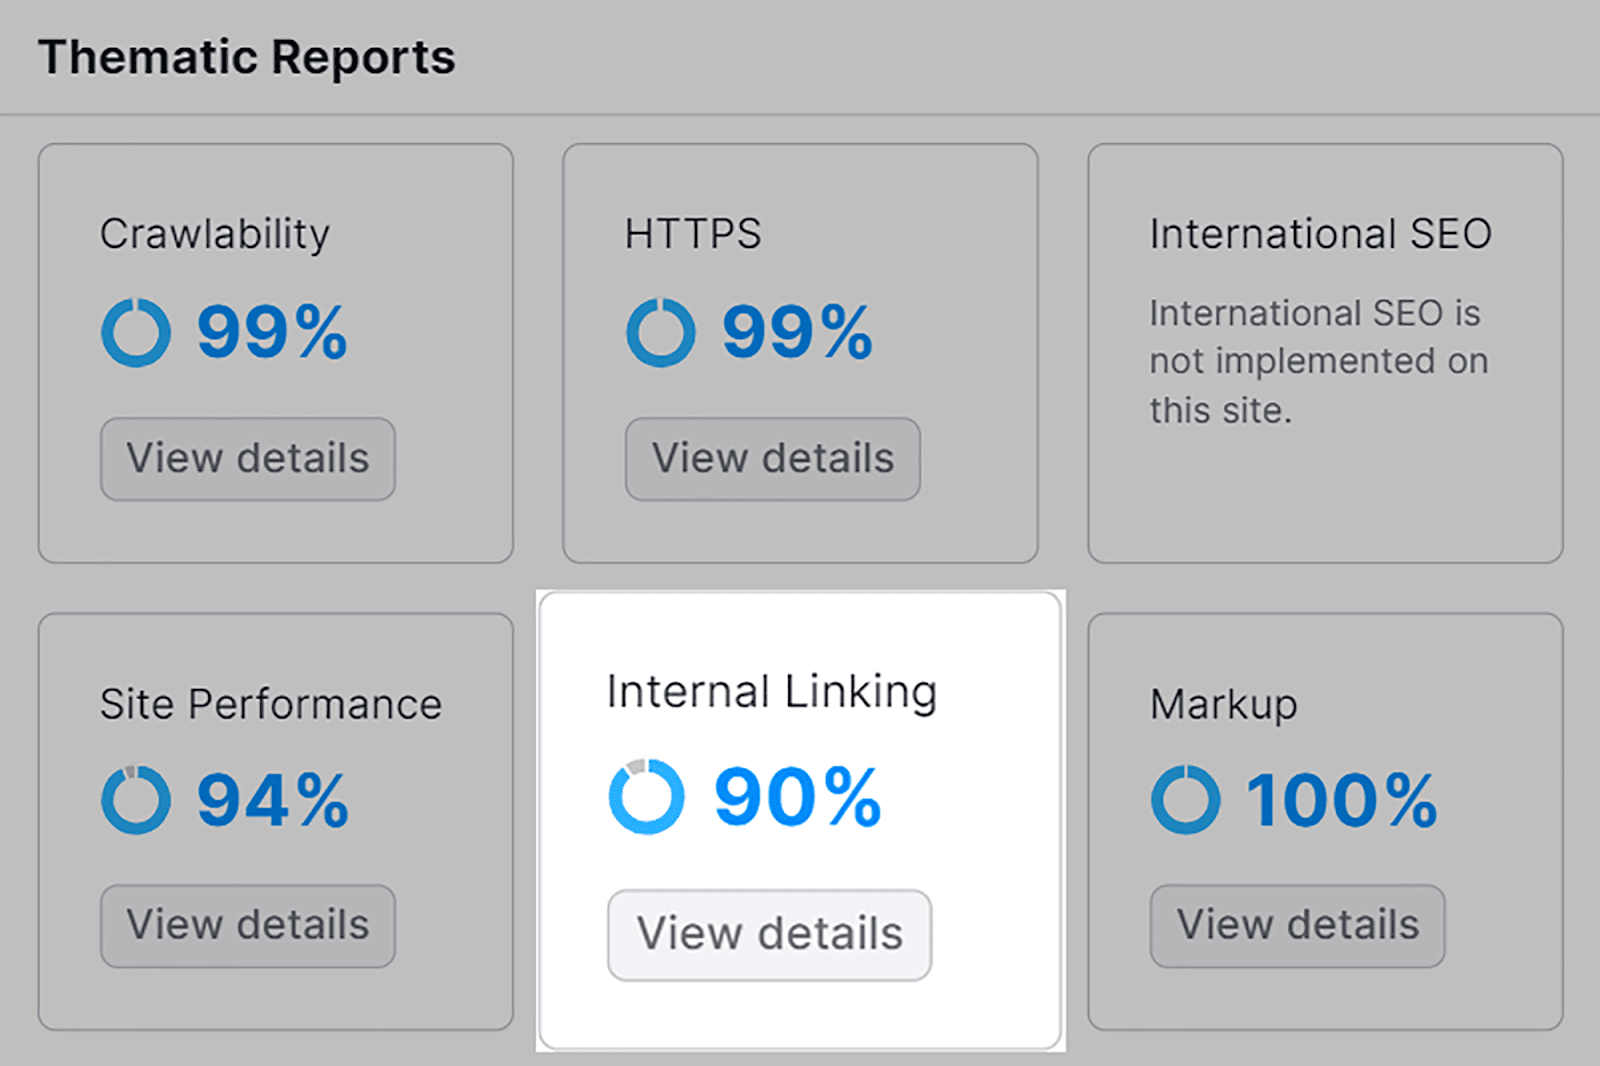
Next, on the Overview page, click “View details” under “Internal Linking”:
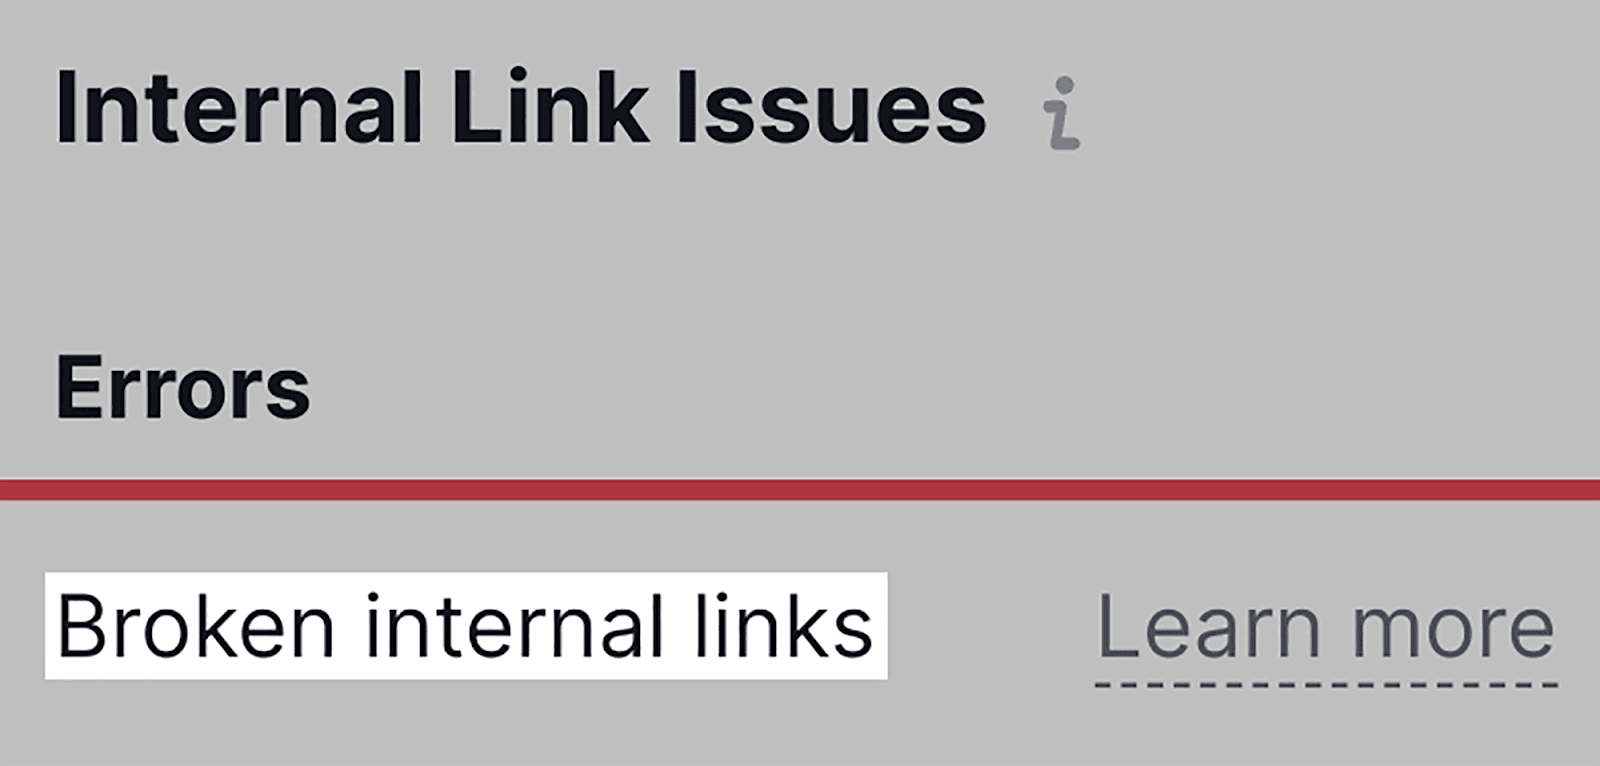
If there are any broken internal links, you’ll be able to view them under “Internal Link Issues” “Errors”:
Semrush’s Site Audit tool is massively helpful and saves you a ton of time.
Instead of going through your entire domain manually to check for broken links, you can use the tool to do the vast majority of the work for you — i.e., actually finding the issues that you need to fix.
SEO Tasks That Can Be Fully Automated
In this section, I’ll list all of the SEO tasks you can automate and the tools you can use for each of them. I’ll also briefly explain how to use each tool for the required task.
1. Backlink analysis
Let’s start with an SEO task that is universally important: backlinks. Considered to be the currency of SEO, backlinks are important in helping your site grow.
Without quality backlinks pointing toward your site, you’ll struggle to climb the search engine results pages (SERPs) and cement your reputation as a credible source of information.
By “reputation” I mean how trustworthy your site is in the eyes of Google and other search engines.
If your site has a lot of toxic backlinks (i.e., backlinks from questionable or spammy websites) your reputation could be severely hampered.
So, how do you keep on top of your backlinks, both credible and toxic? By performing a backlink audit at least once per month.
However, instead of going through all your backlinks and judging their worth manually, you can use Semrush’s Backlink Audit tool to check up on them for you.
The tool will crawl your website and collect data on all the backlinks pointing to your site.
Once you connect your site to Semrush, you can go into the Backlink Audit tool whenever you want to check in on the overall health of your backlink profile.
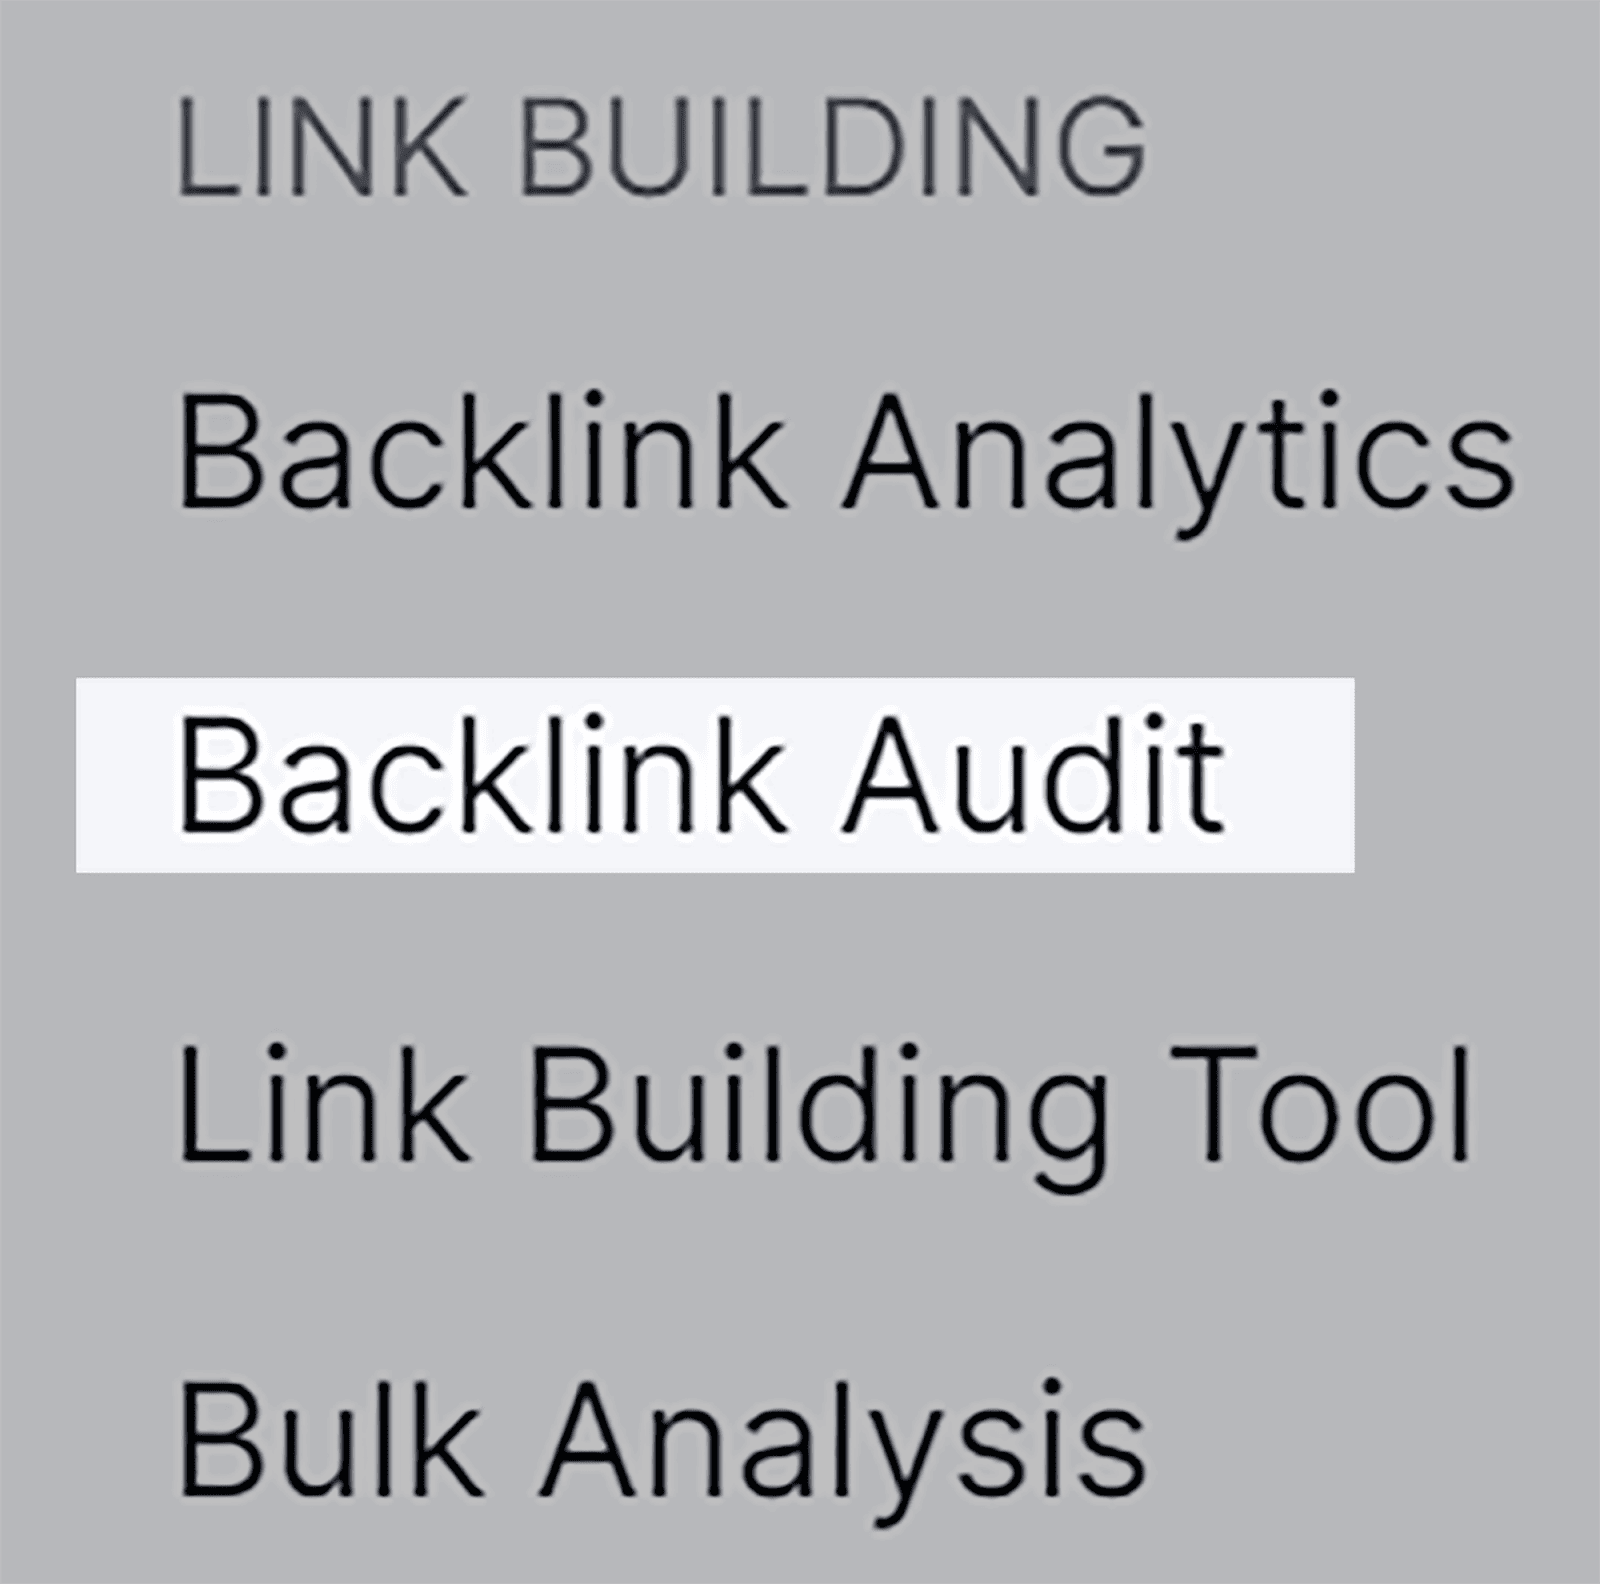
Here’s how to use the tool. Click on “Backlink Audit” found under the Link Building section:
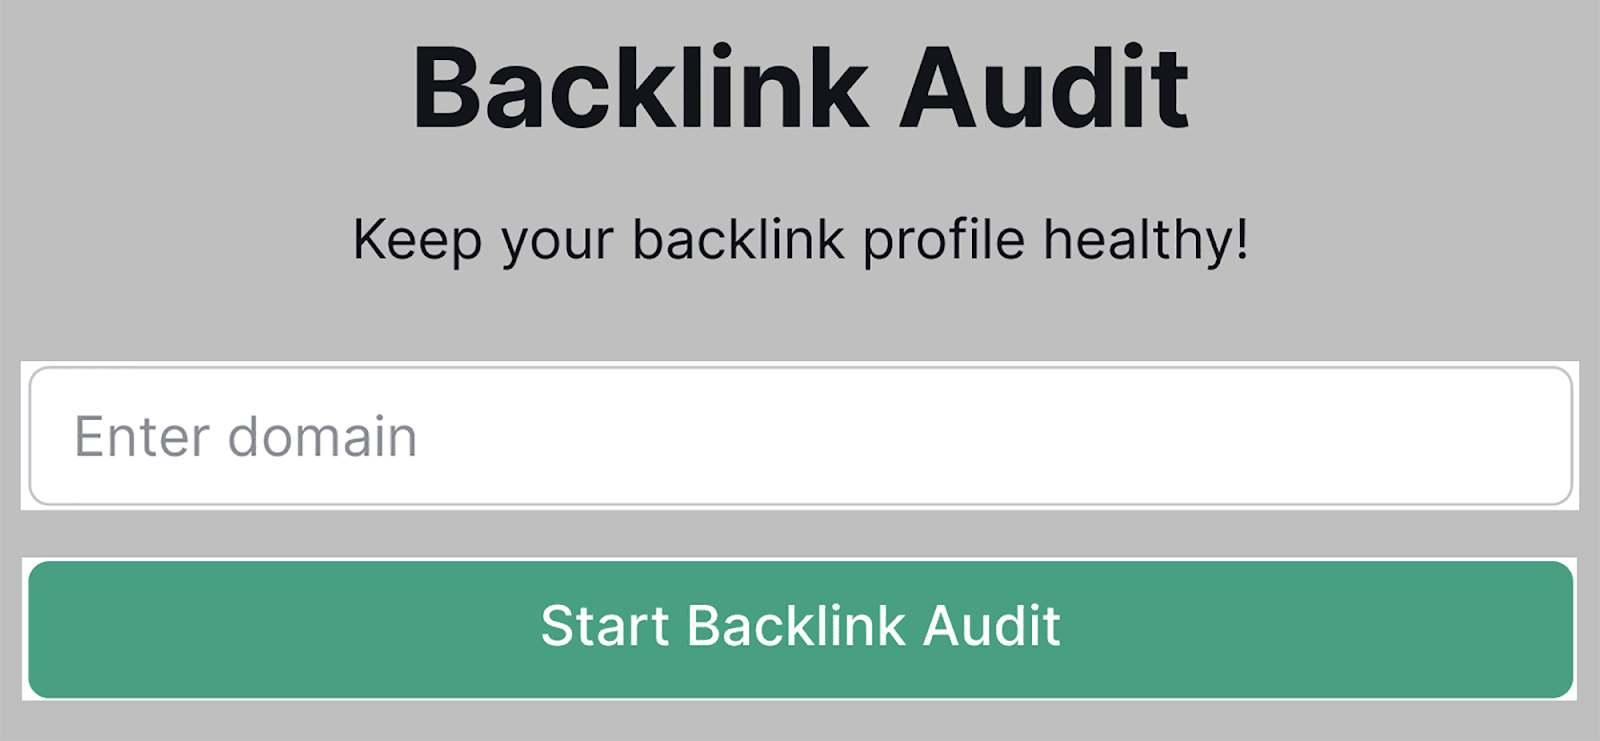
Next, type in your domain and hit “Start Backlink Audit”:
On the Overview page, you’ll see the Overall Toxicity Score which will give you a brief glimpse into how your backlink profile is looking:
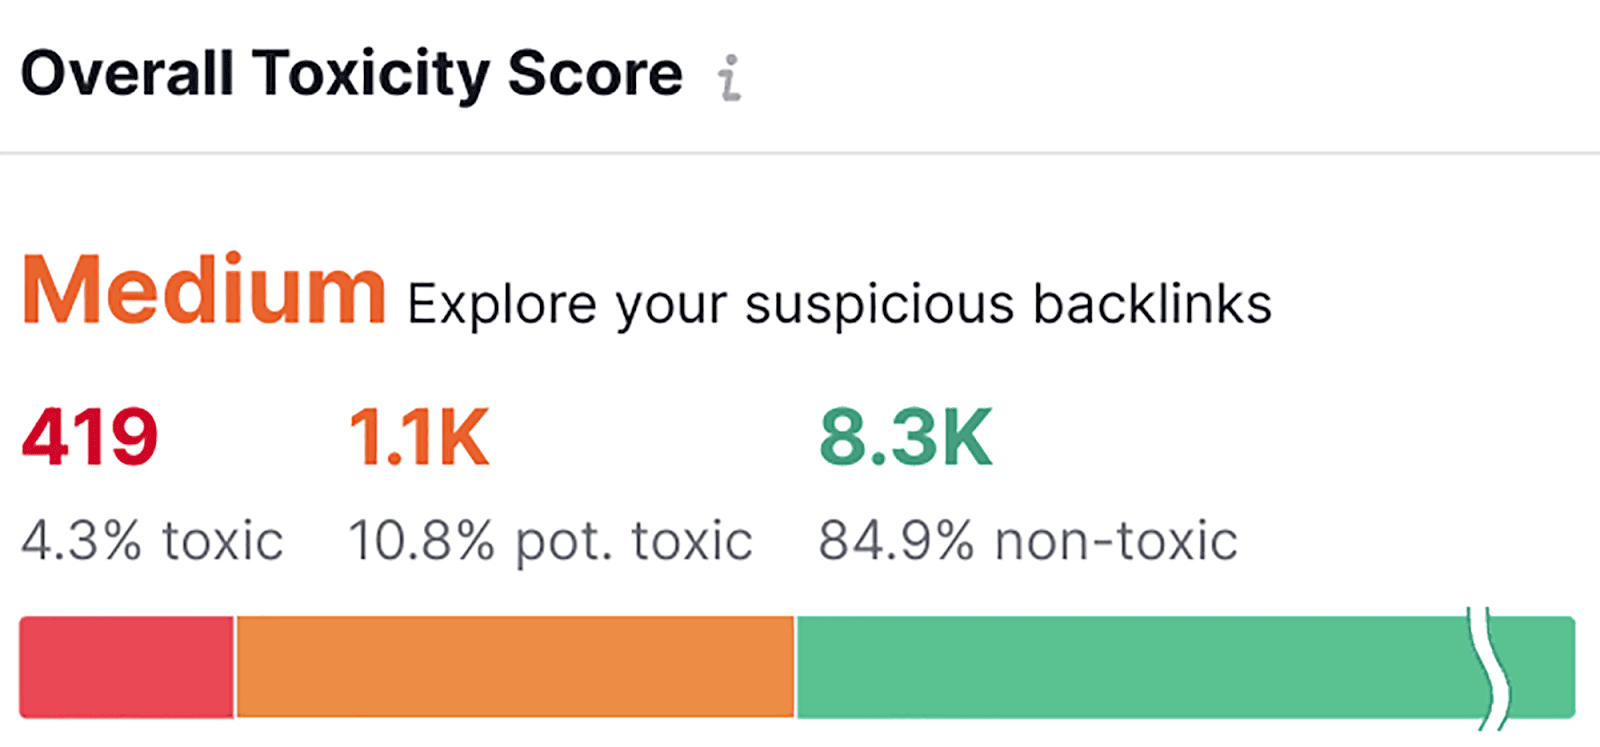
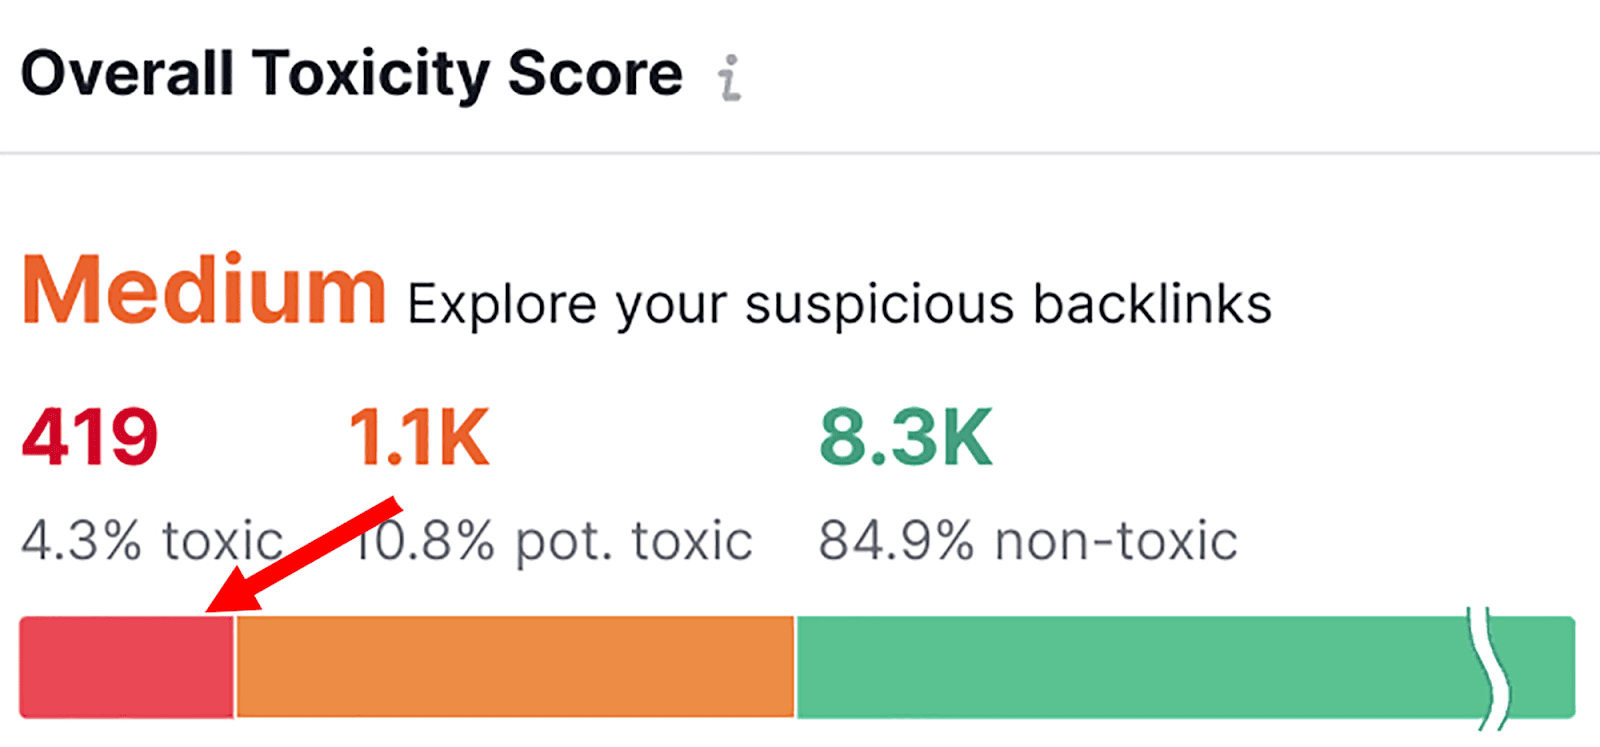
As you can see, the majority of my links aren’t toxic. If you click on the “toxic” section of the bar:
You’ll be given a list of your most toxic links, ordered by default from highest Toxicity Score (TS) to lowest:
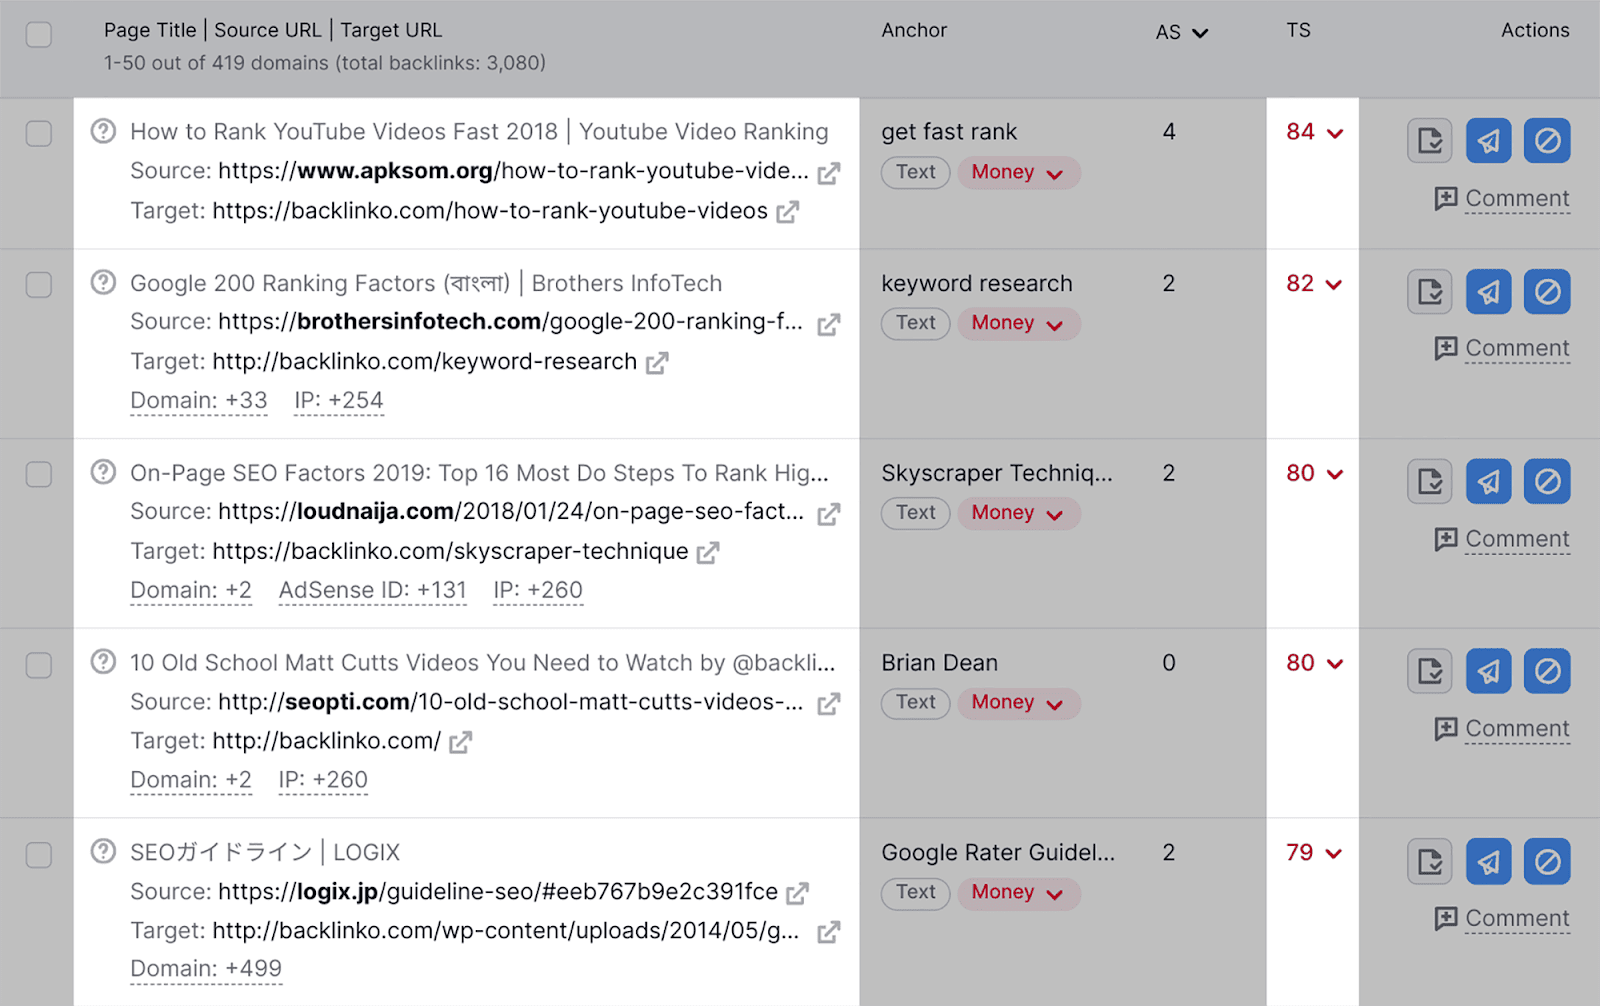
If you’ve got toxic backlinks, I’d recommend visiting the site to see whether or not they’re worth keeping.
If they’re not worth keeping, you can add them to the disavow list by selecting the button on the right:

Once you’ve added the toxic links to the Disavow list you can download the list as a .txt file.
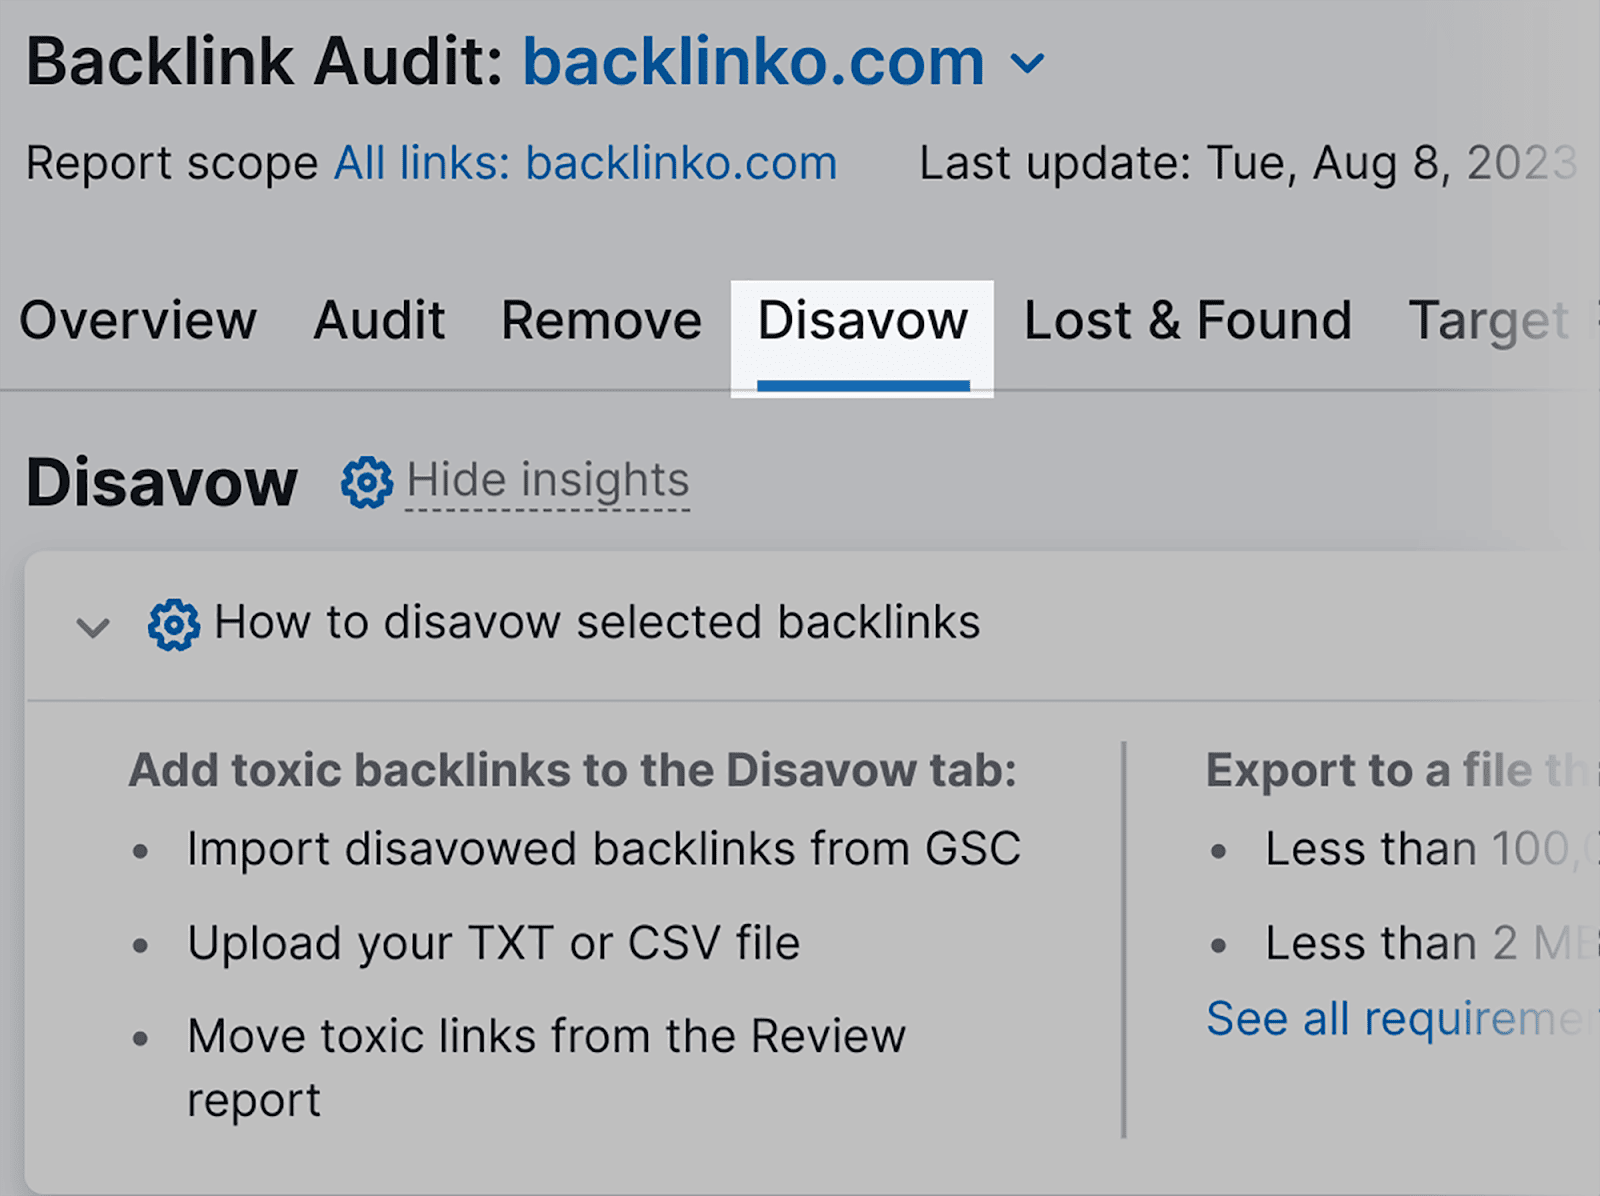
You can find your disavow list by clicking the Disavow tab:
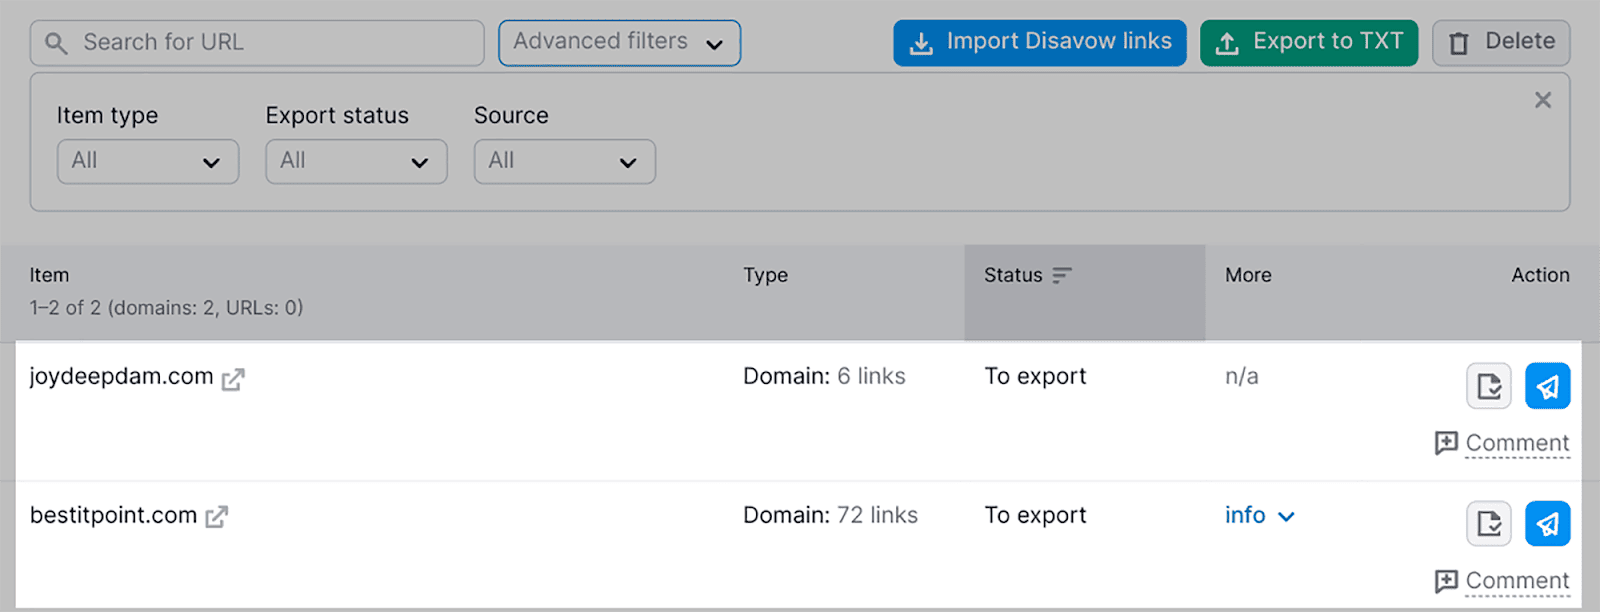
Scroll down, and you’ll find a list of all the links you’ve selected to disavow:
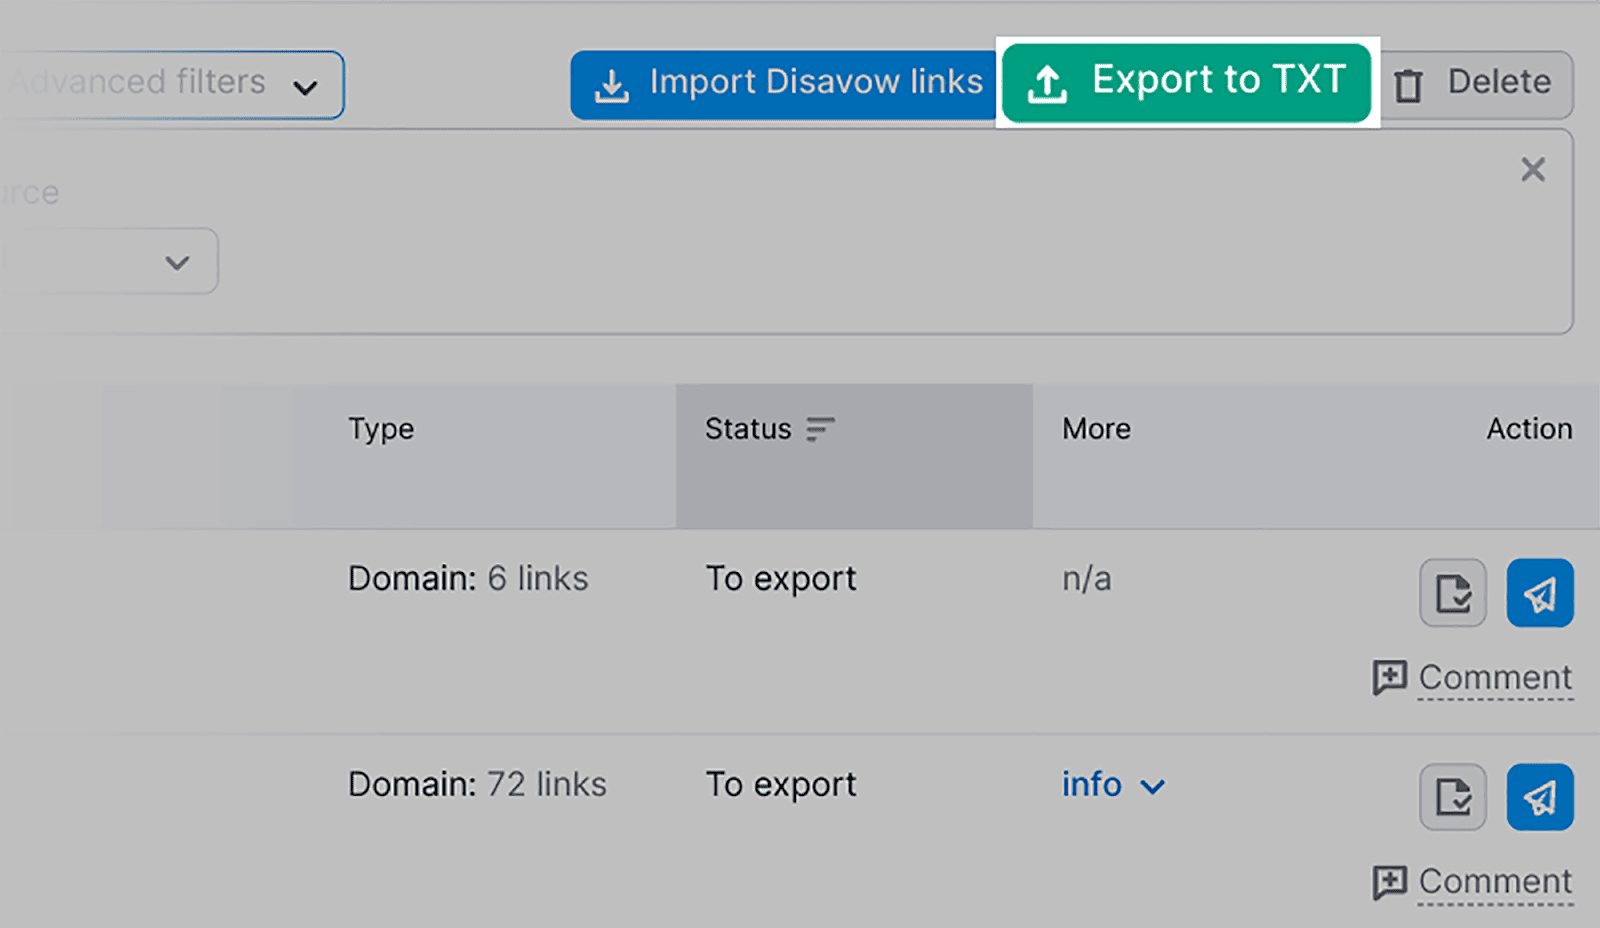
To convert this list to a TXT file, select the “Export to TXT” button at the top right of the table:
This file can then be uploaded to the Disavow Tool in Google Search Console. This will inform Google to ignore these links.
Having taken care of the toxic links through the Disavow list, let’s delve into how you can monitor your backlink profile for changes.
Semrush’s Backlink Analytics tool automates the process of managing your backlinks.
It can track:
- New backlinks
- Backlinks you’ve lost
- Your Nofollow and Dofollow links
- Sponsored and UGC links
This automated monitoring ensures that you stay updated without having to manually search for these changes.
Here’s how to use the Backlink Analytics tool to view new backlinks.
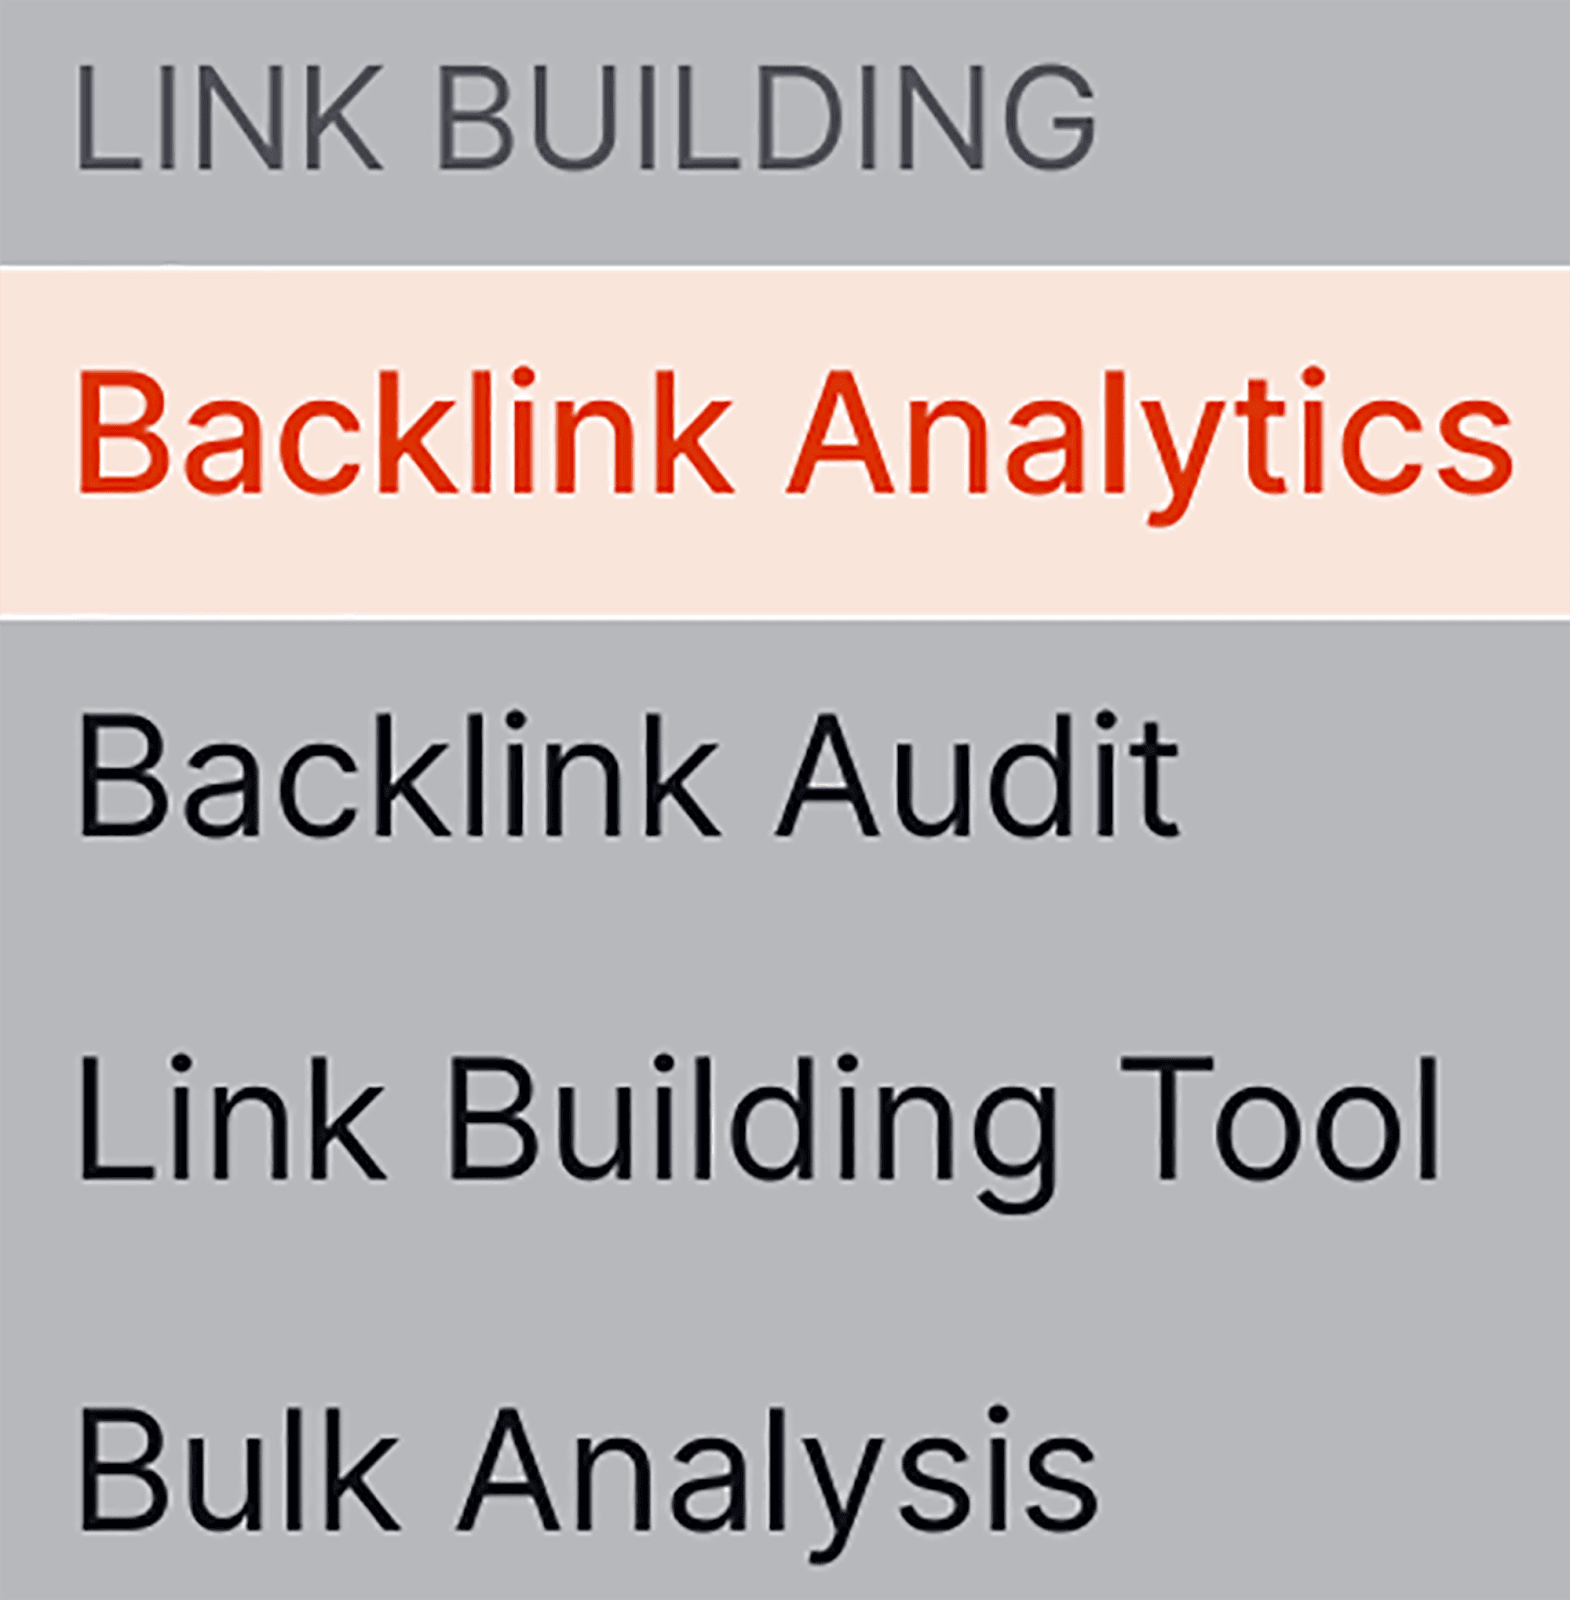
Click on “Backlink Analytics” in the main menu:
And then type in your domain:
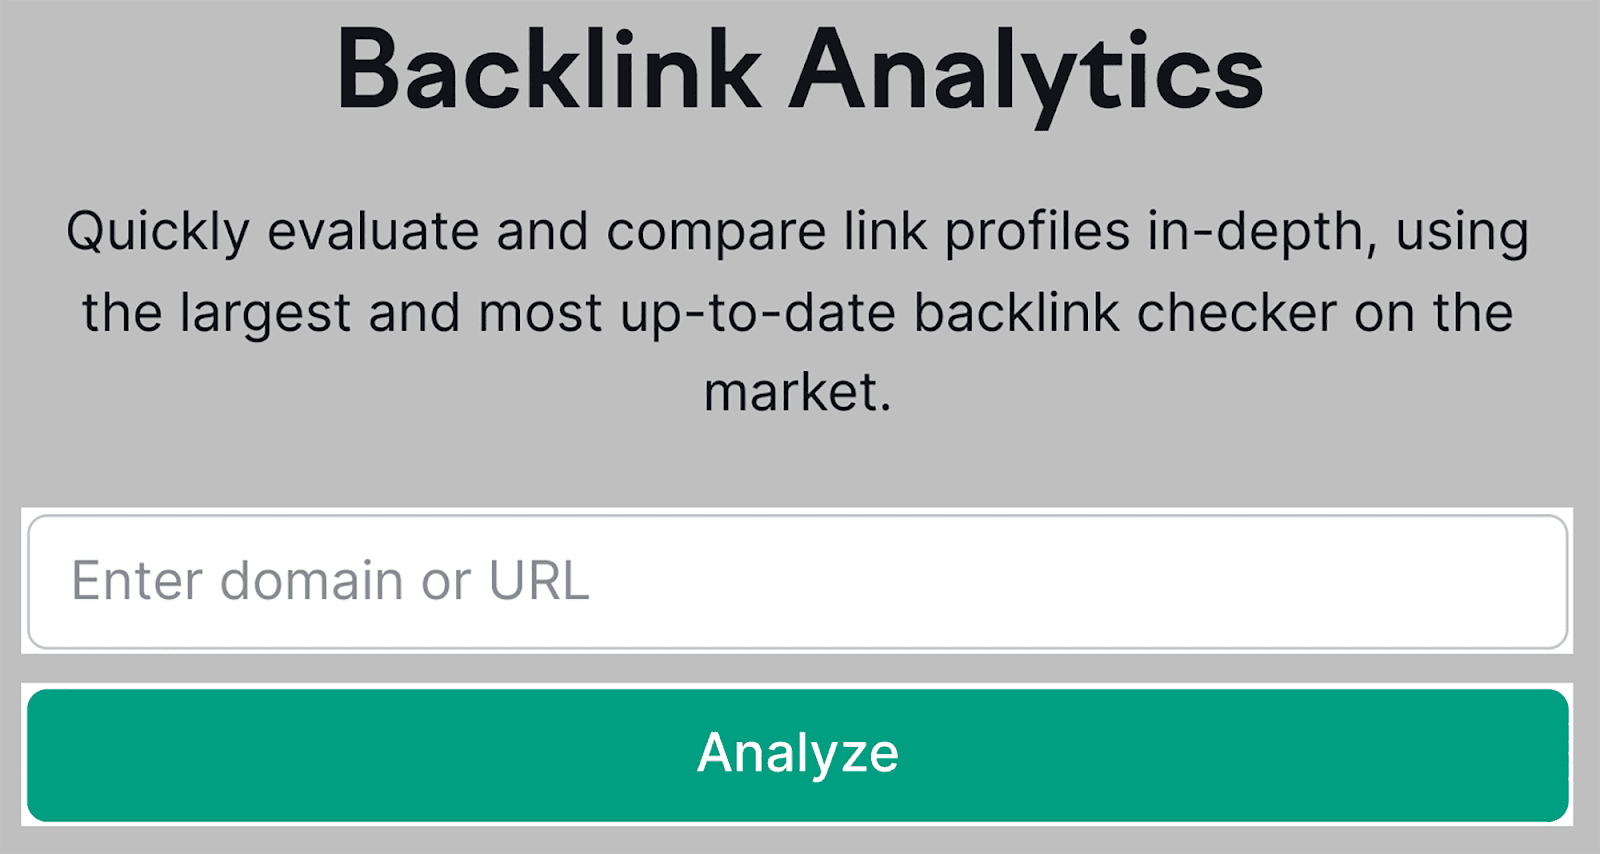
After you click “Analyze”, you’ll land on the main Backlink Analytics dashboard:
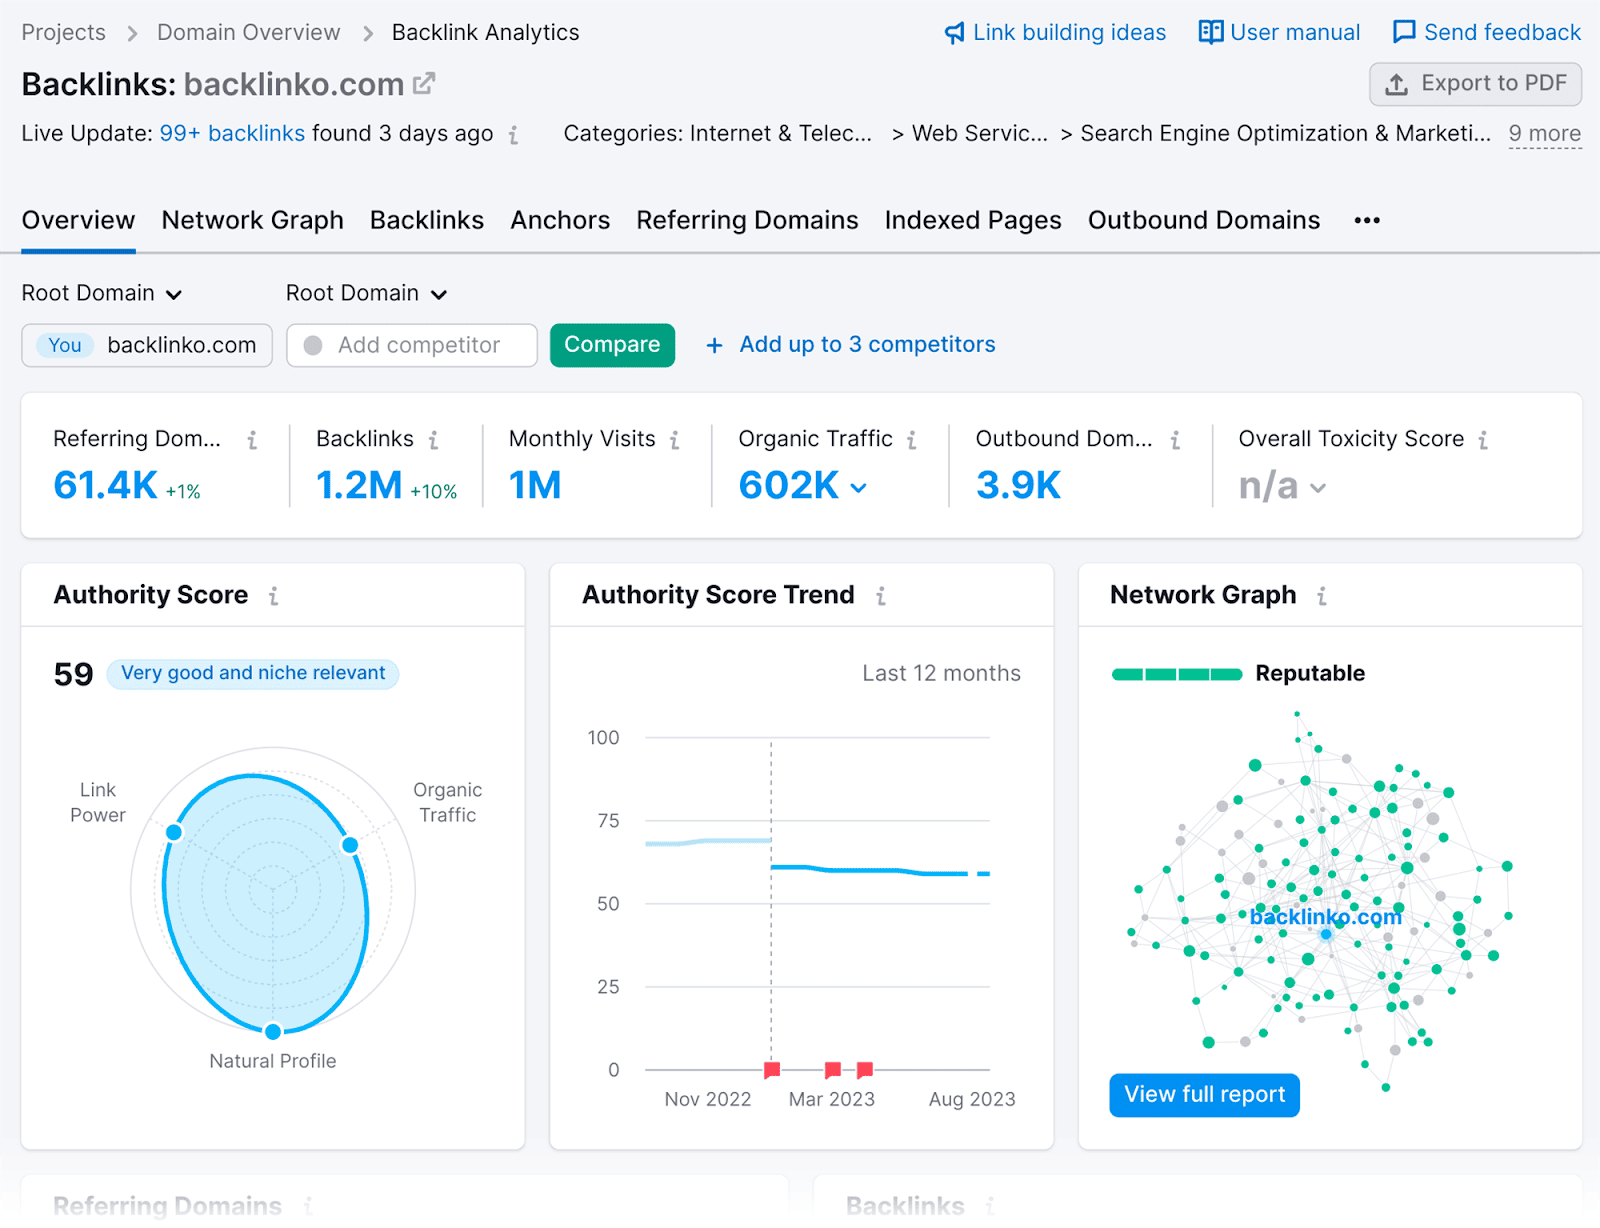
Click on the “Backlinks” tab:
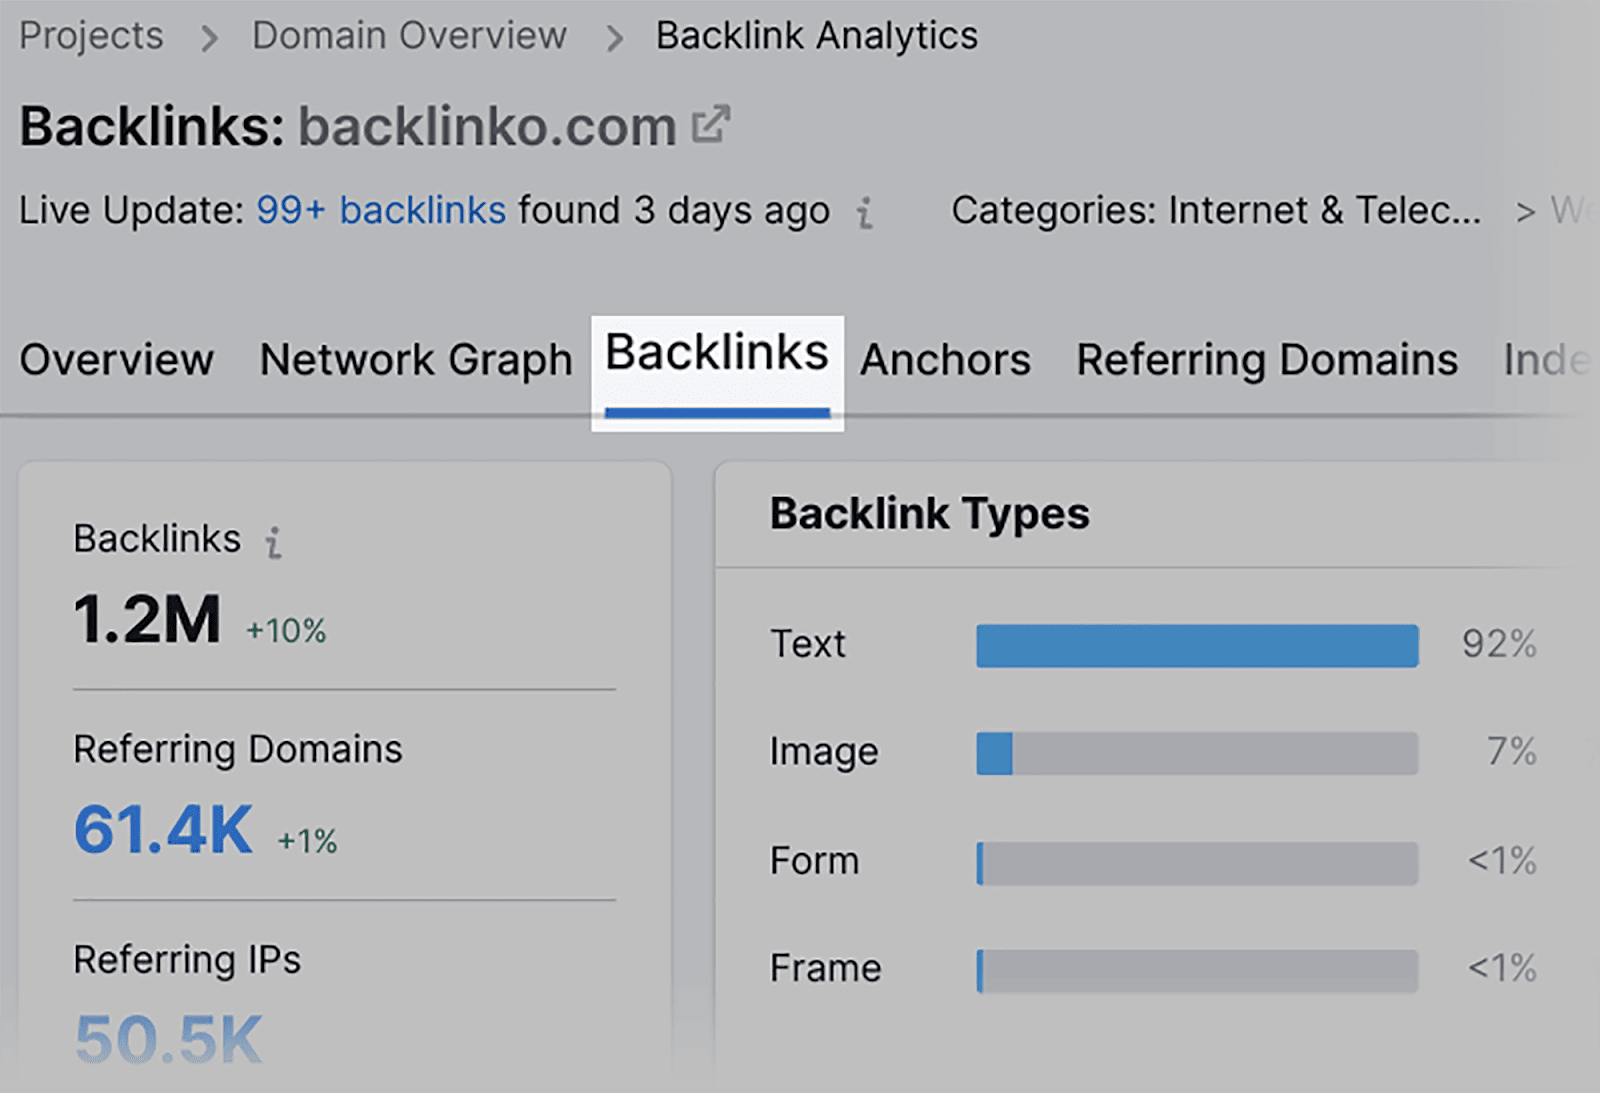
…and you’ll see a list of your backlinks.
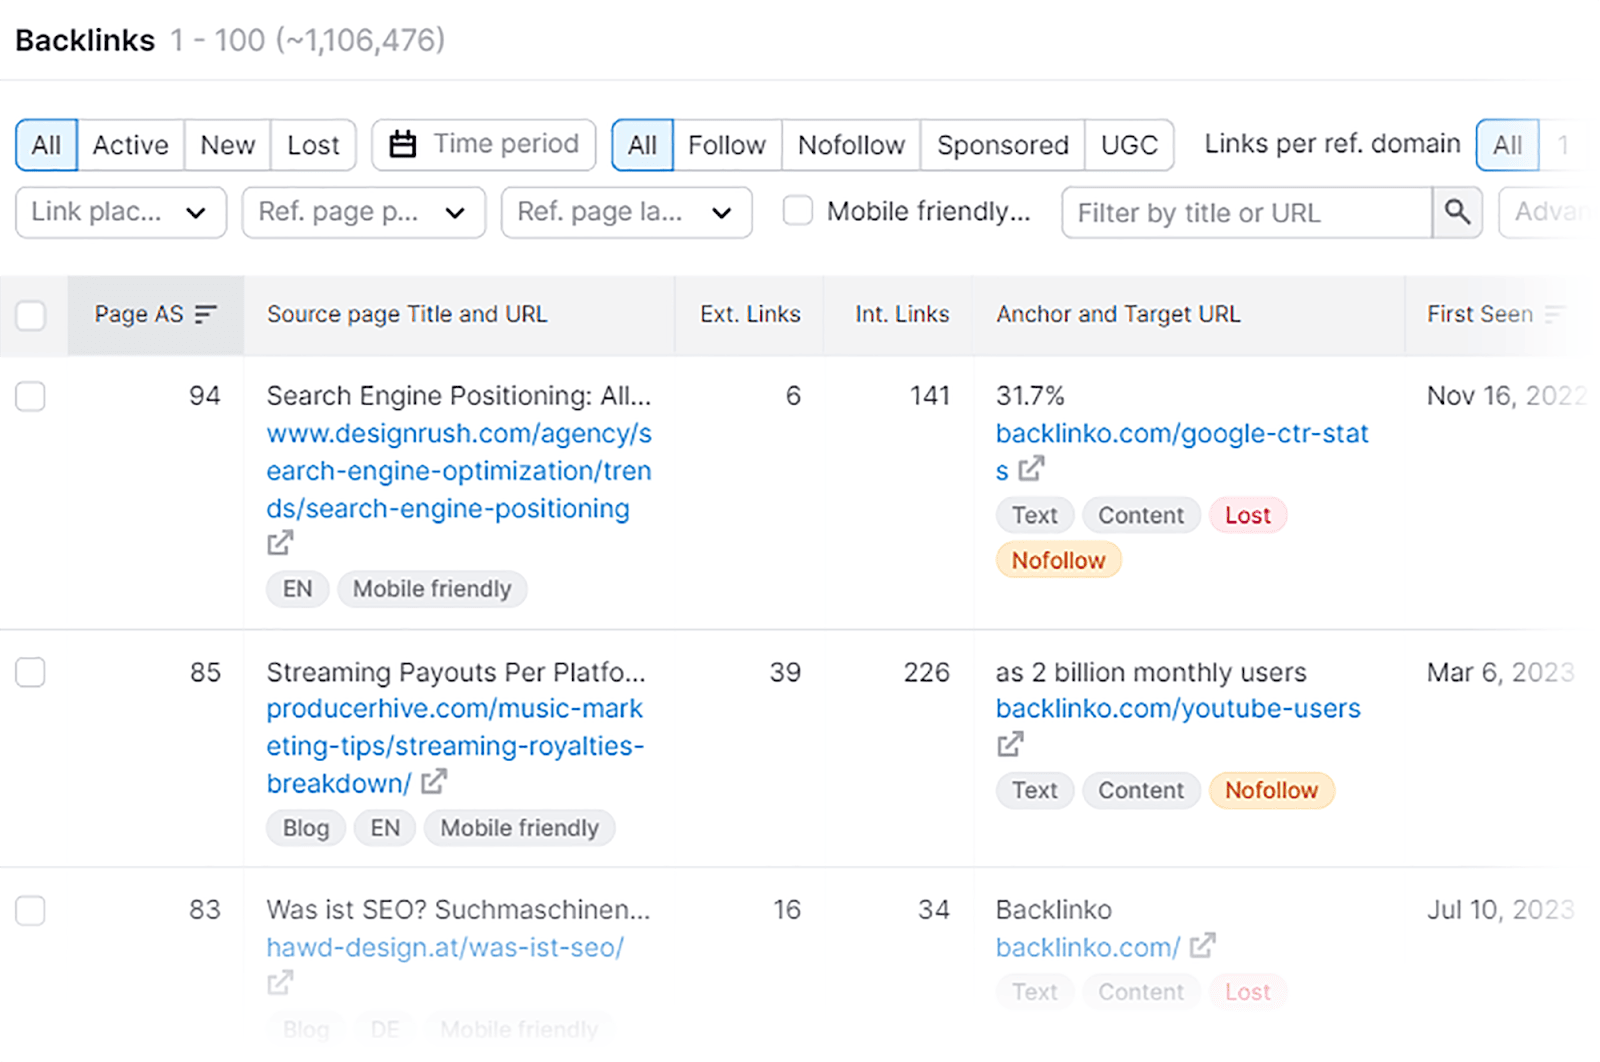
To review all the backlinks you’ve recently gained, click on the “New” tab:
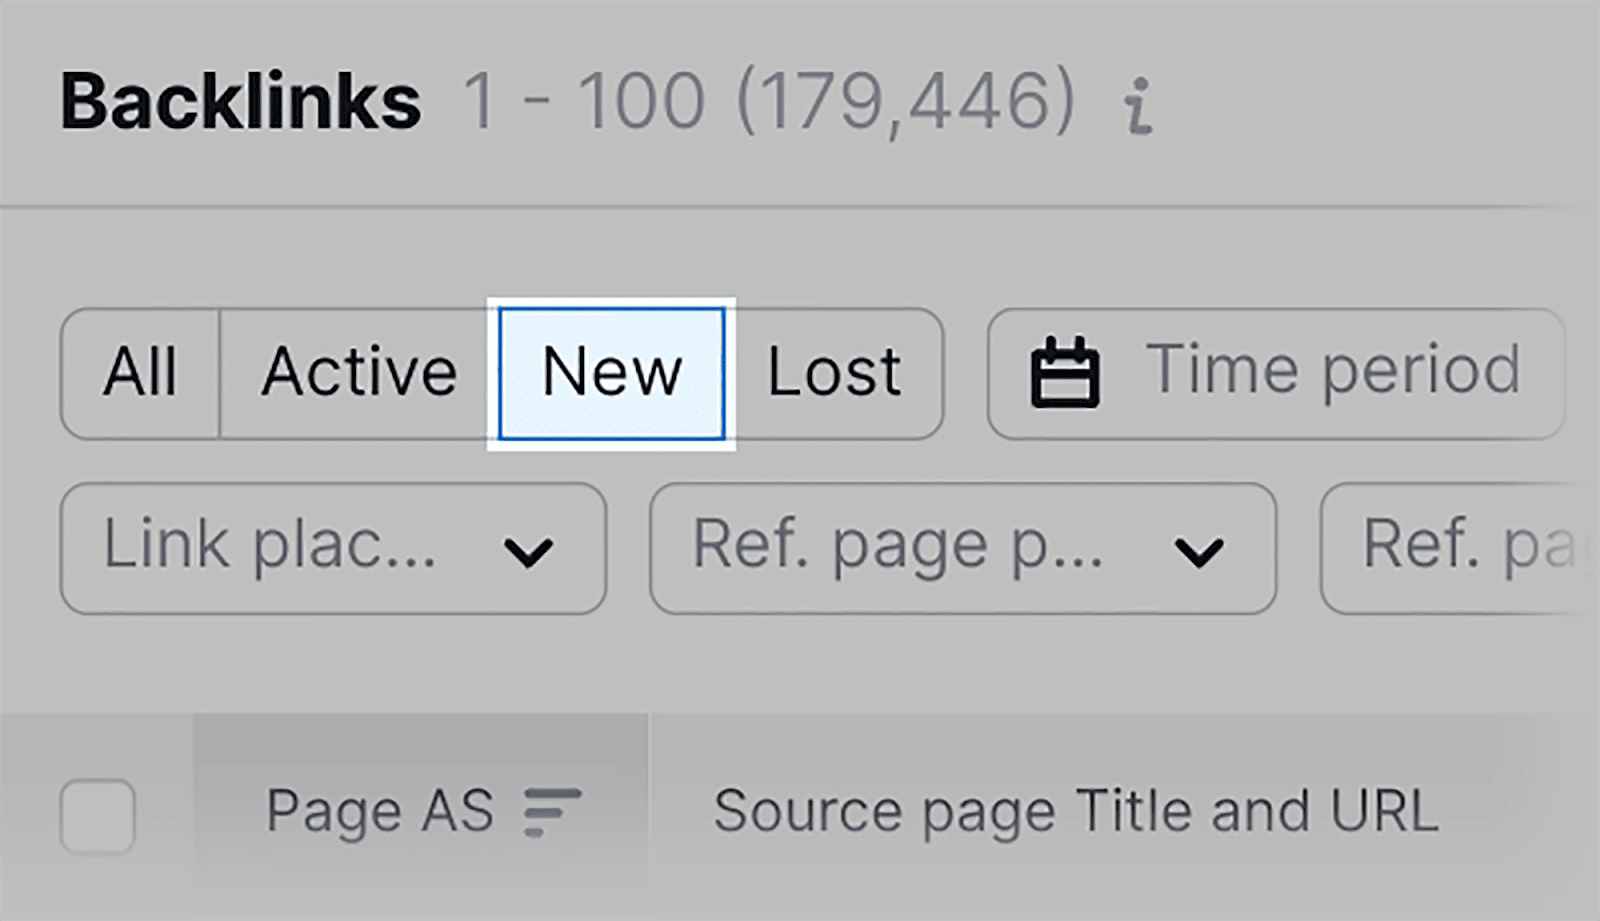
You’ll be presented with a list of your newly acquired links. On top of that, you’ll also be able to view which page is earning the backlink, the Page Authority Score of the referring domain, and the anchor text.
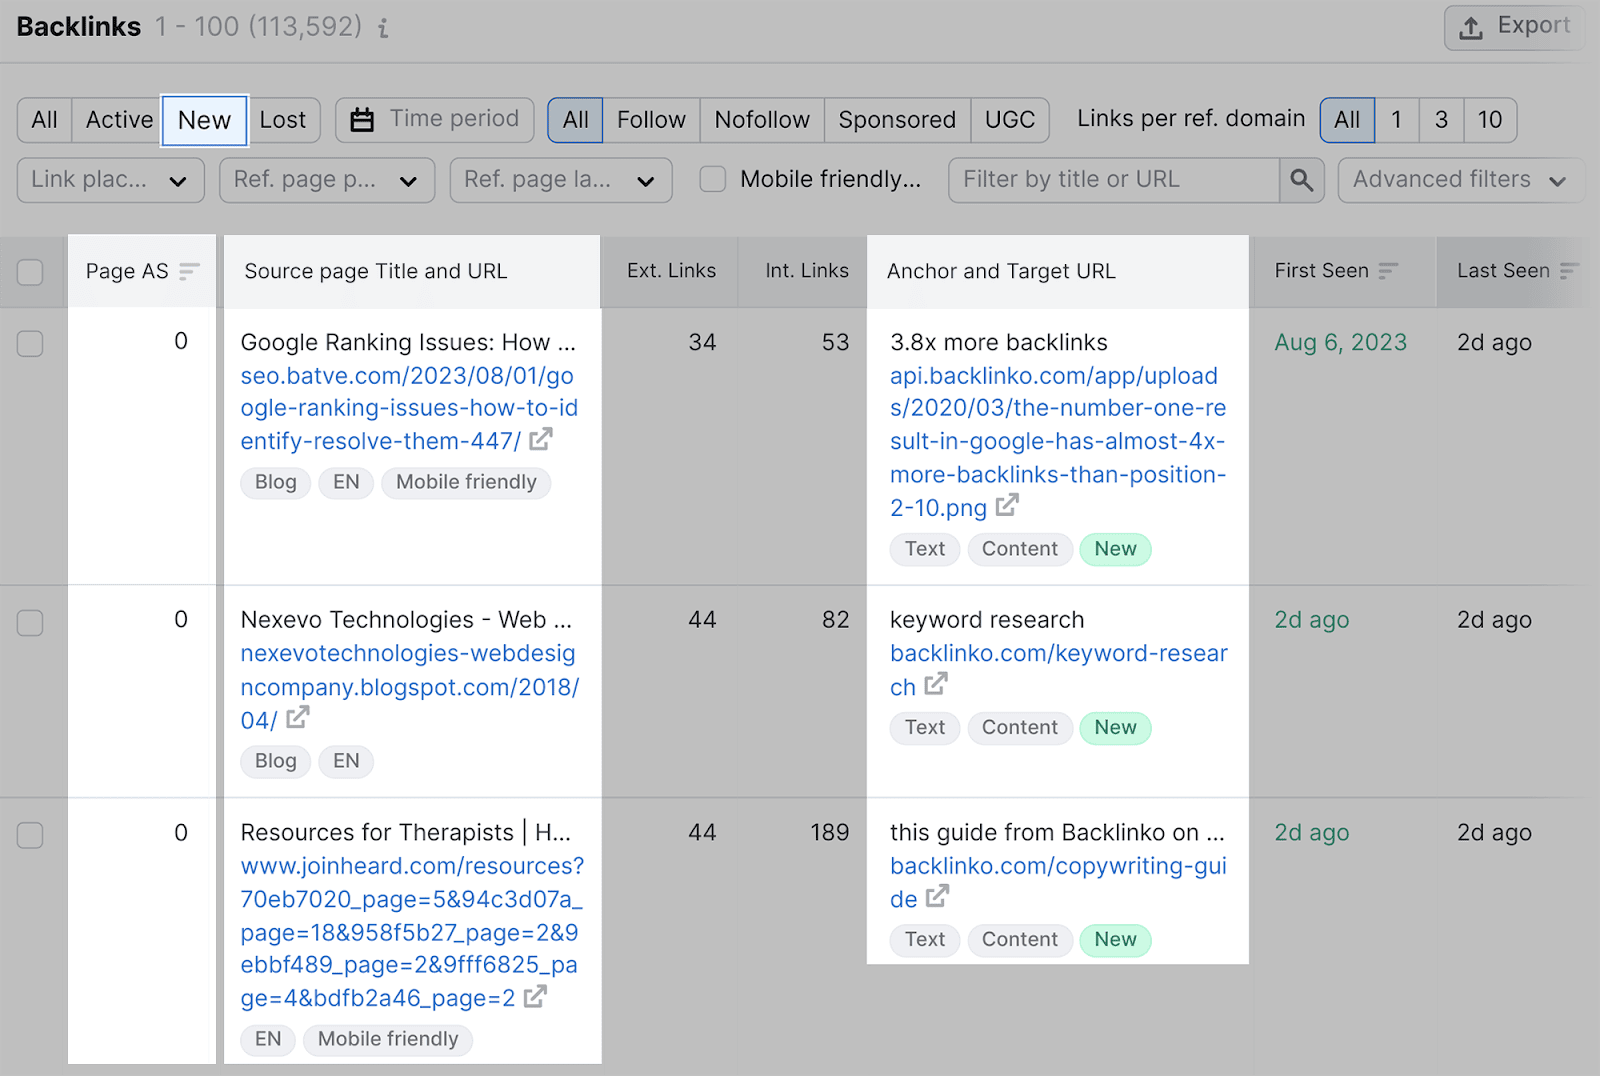
If you want to review your Dofollow & Nofollow links, as well as Sponsored or UGC attributes, simply click on any of the filter options:

To further automate your backlink analysis, you can use Semrush’s Backlink Gap tool.
This can be used to find the backlinks your competitors currently have but you don’t.
Instead of manually searching for websites that link to your competitors, the Backlink Gap tool provides you with a list of domains where you could potentially gain backlinks.
Plus, the Backlink Gap tool allows you to analyze several competitors simultaneously.
To use this tool, head over to “Backlink Gap” found under Competitive Research:
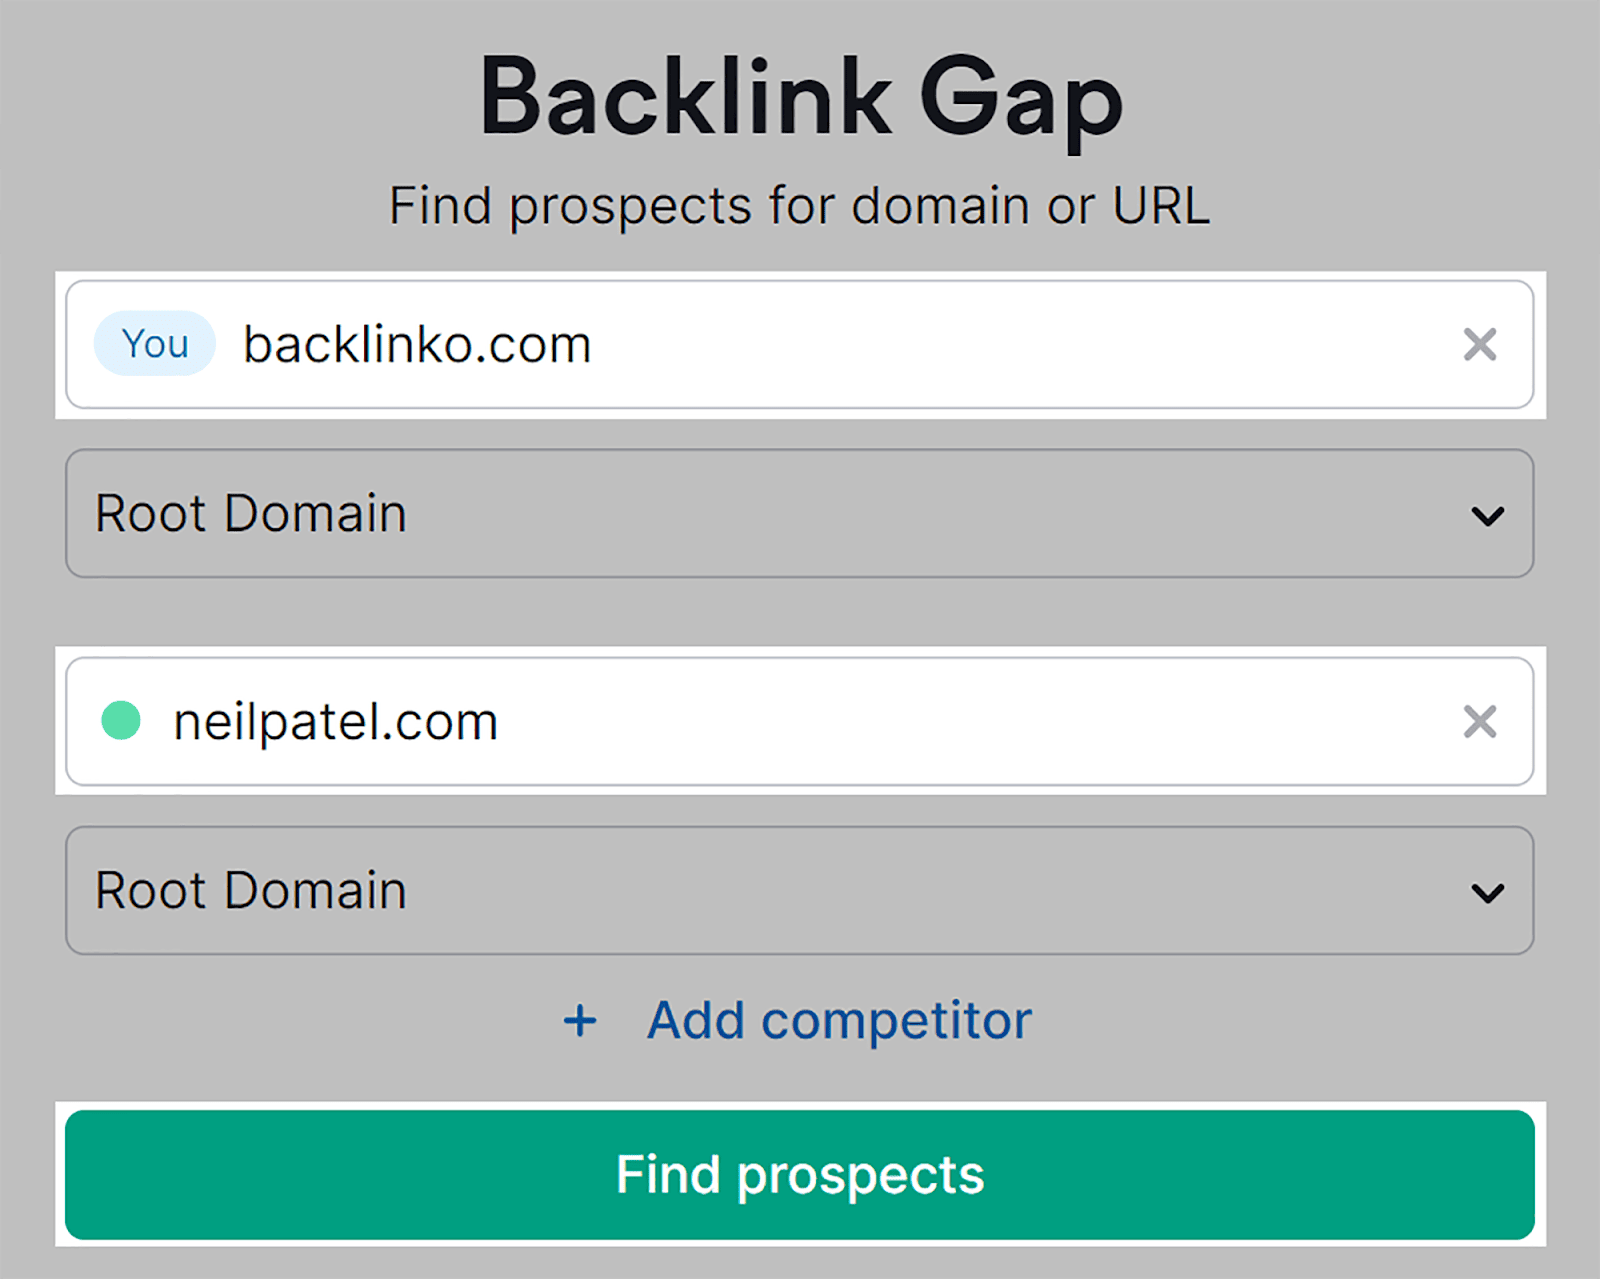
Next, add your domain as well as your top competitors and then hit the “Find prospects” button:
You’ll then be shown a list of backlinks that you don’t have, but your competitors do:
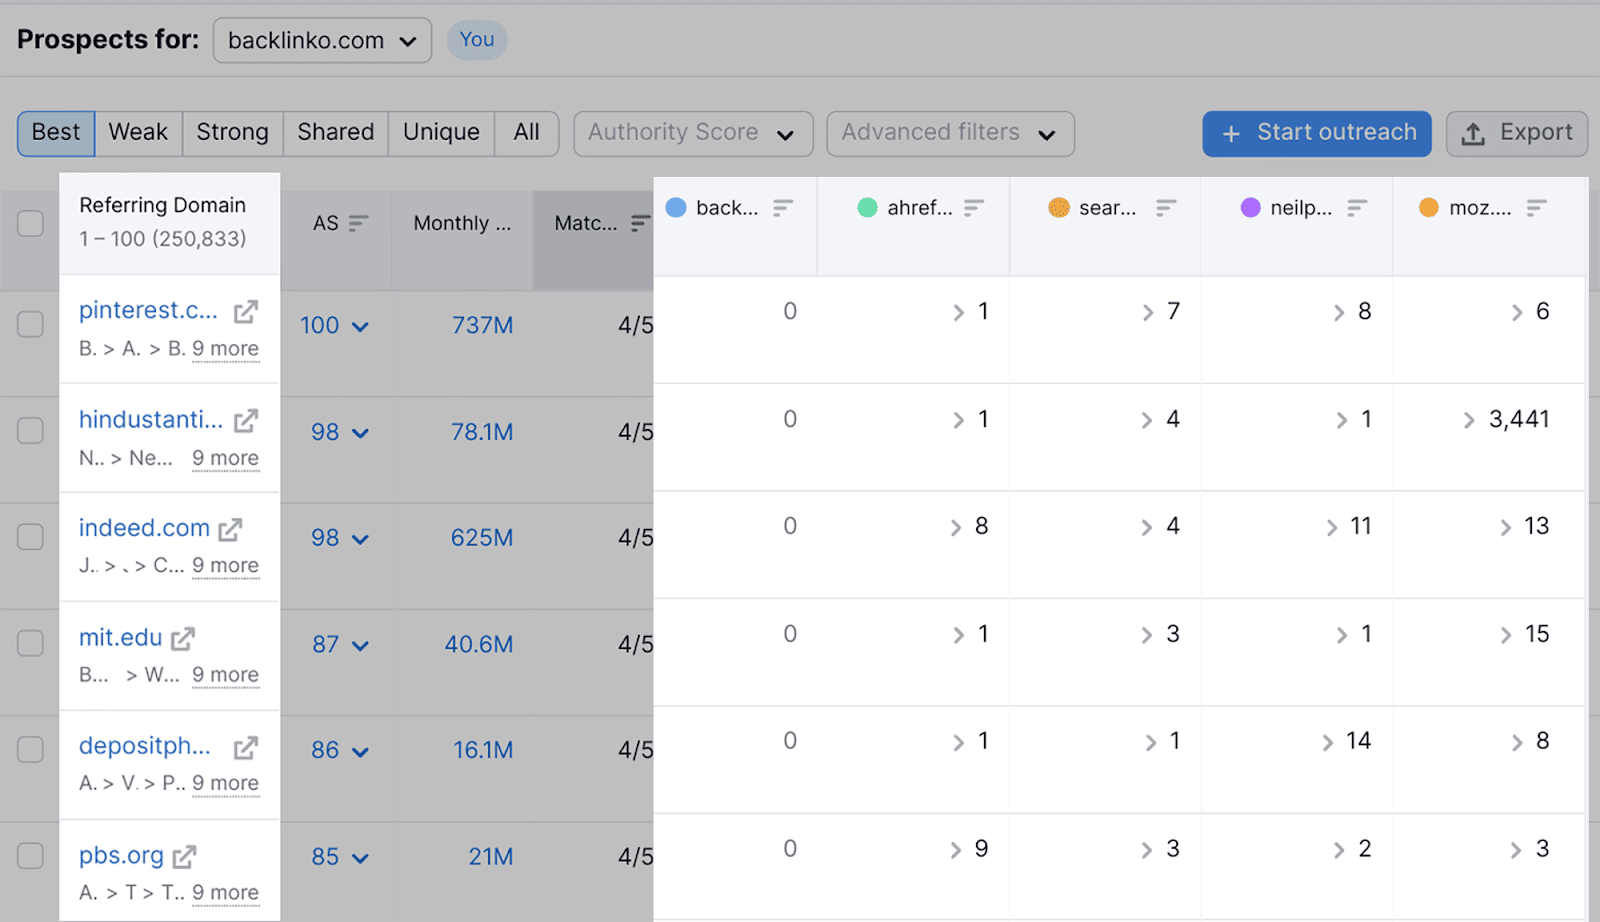
You can also view the Authority Score (AS) and monthly visits of each of the referring domains:
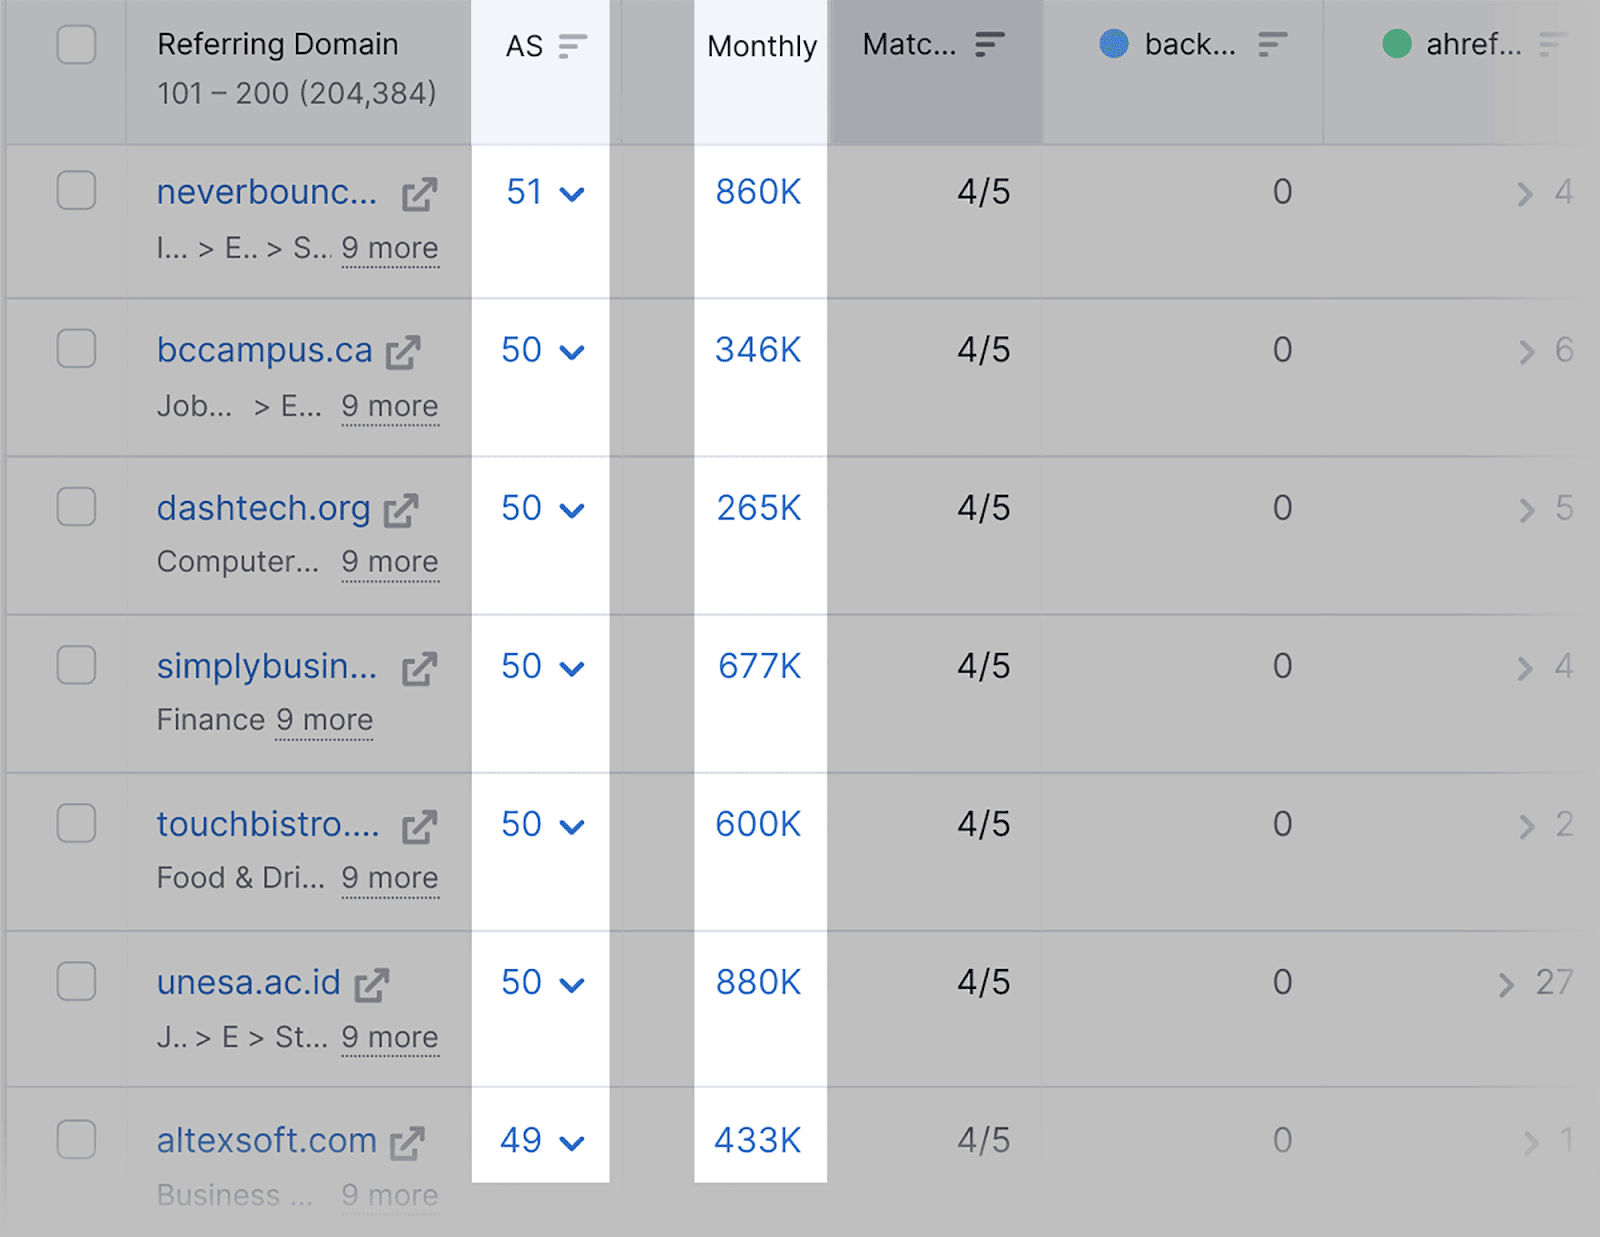
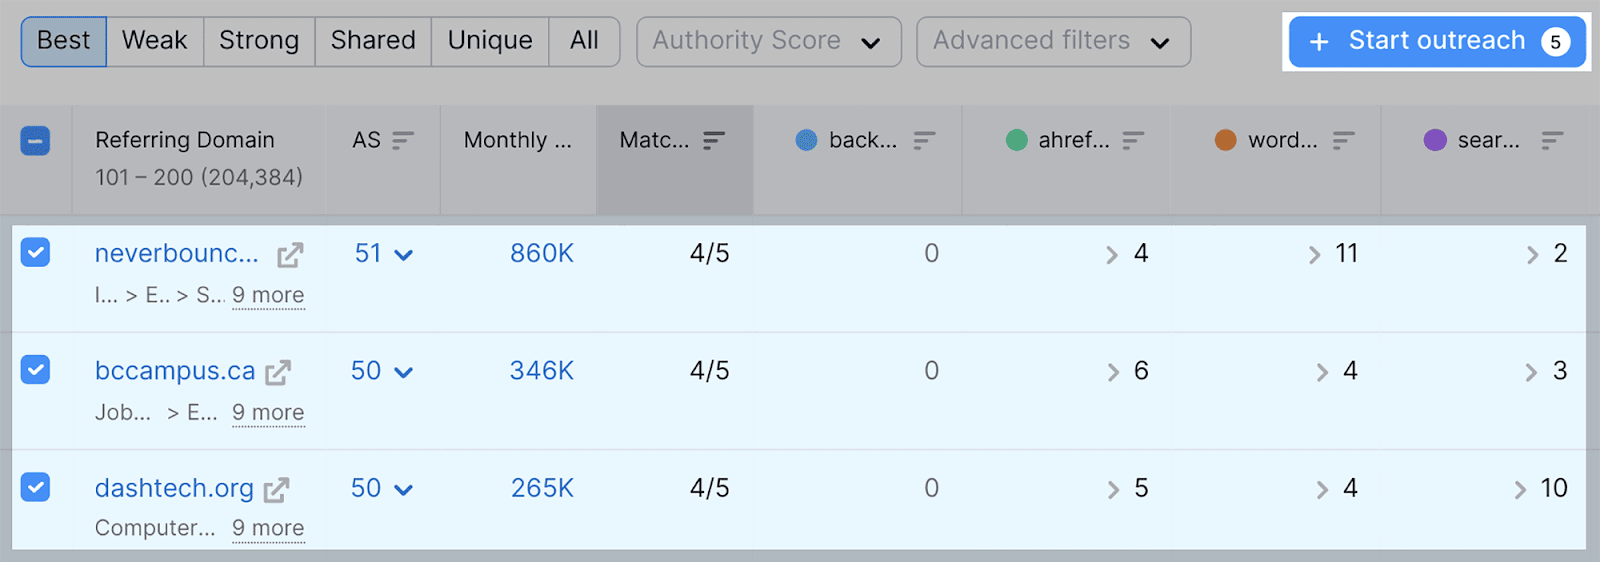
If you find backlink opportunities that could be beneficial for your link building campaign, you can utilize this tool to automate an outreach campaign as well.
Simply select the referring domains you’d like to acquire backlinks from and click the “+ Start outreach” button:
You can then choose to “Send prospects” to Semrush’s Link Building tool:
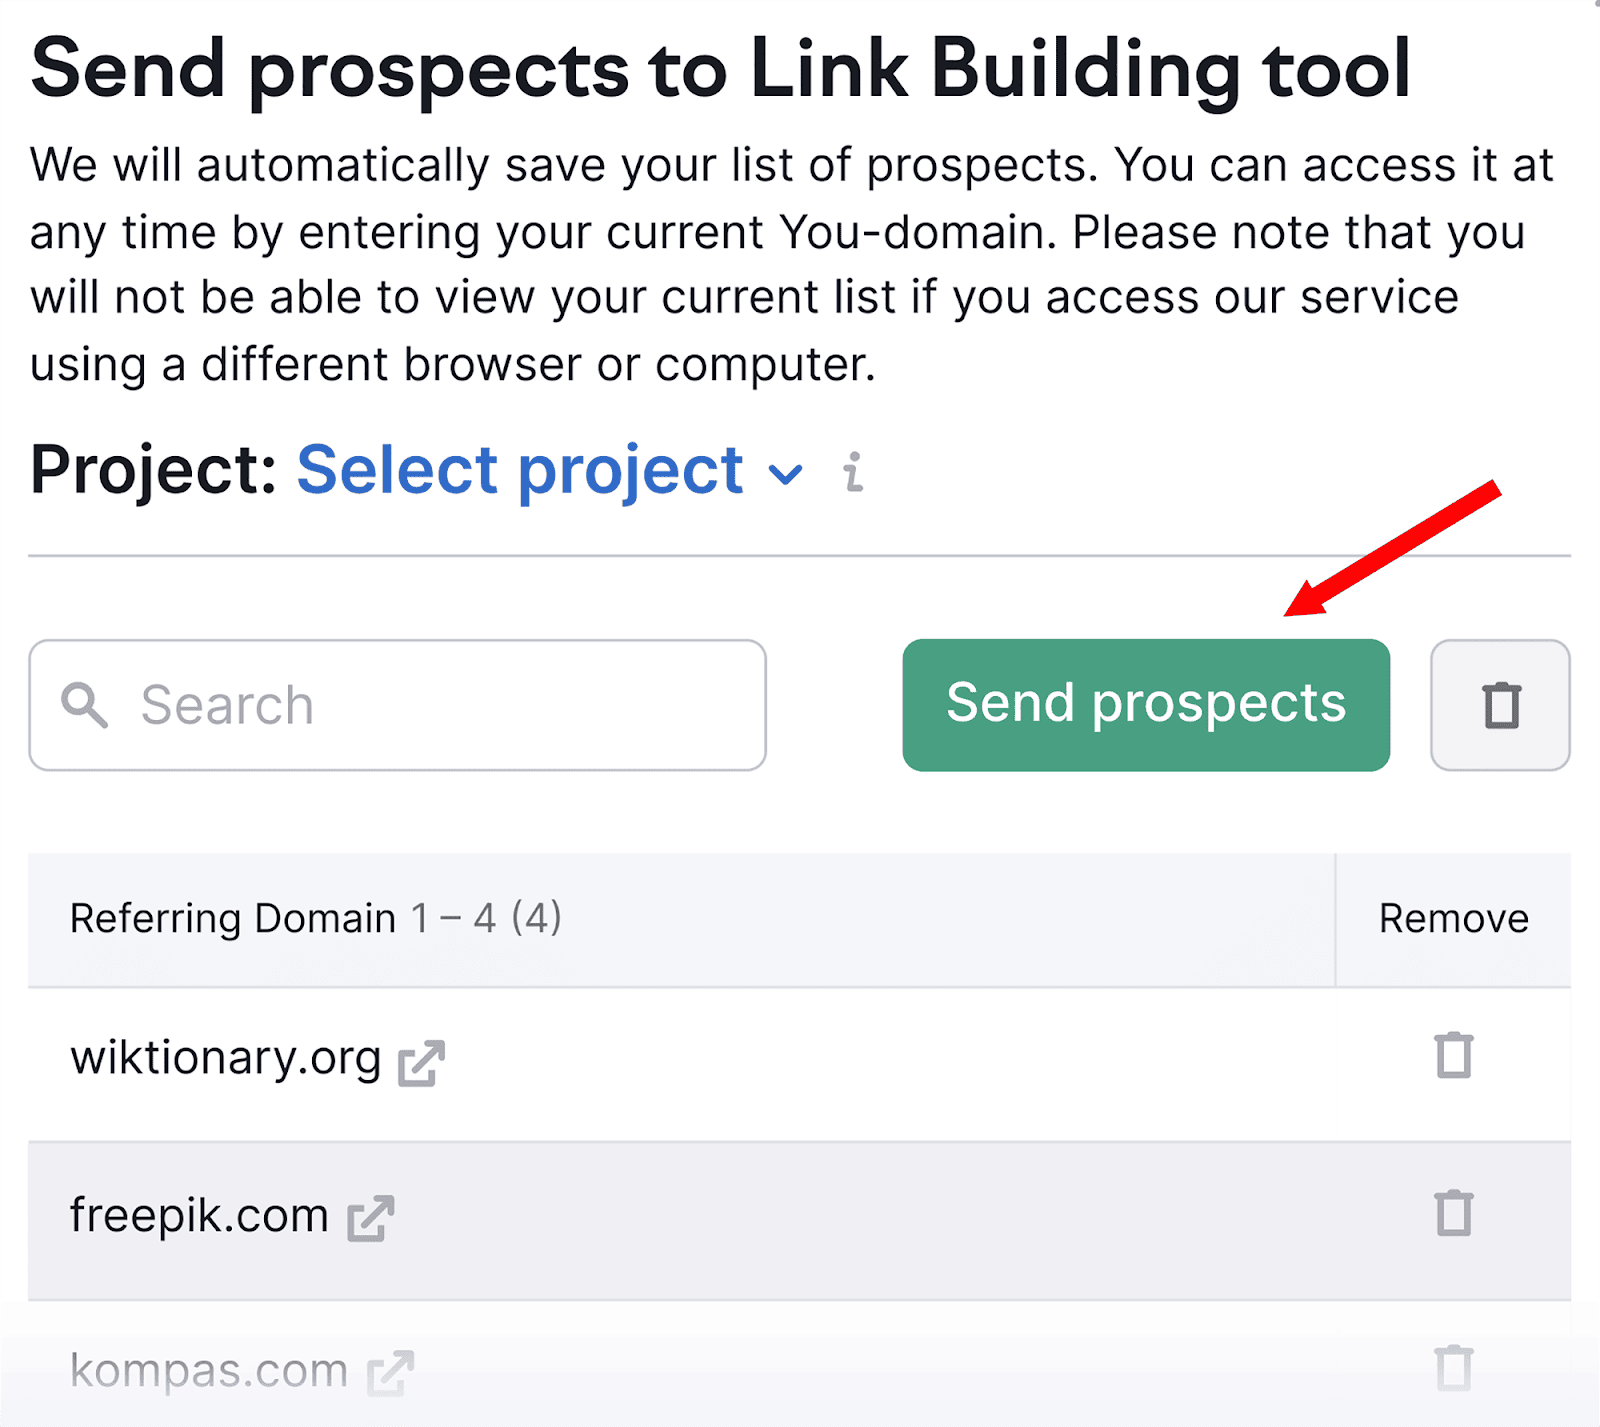
With the Link Building tool, you’ll be able to automate emails to each of these prospects.
Overall, Semrush’s Link Building Suite can help you complete the entire backlink analysis process: from analyzing your own and your competitors’ backlinks, right up to finding new backlink opportunities and reaching out to prospective websites.
Analyze backlinks using Google Search Console
Google Search Console offers a free method for analyzing your backlinks.
The tool will provide you with basic insights into which websites are linking to yours, allowing you to monitor and assess your backlink profile without the need for manual tracking.
To check up on your backlinks, scroll down and click on the “Links” tab:
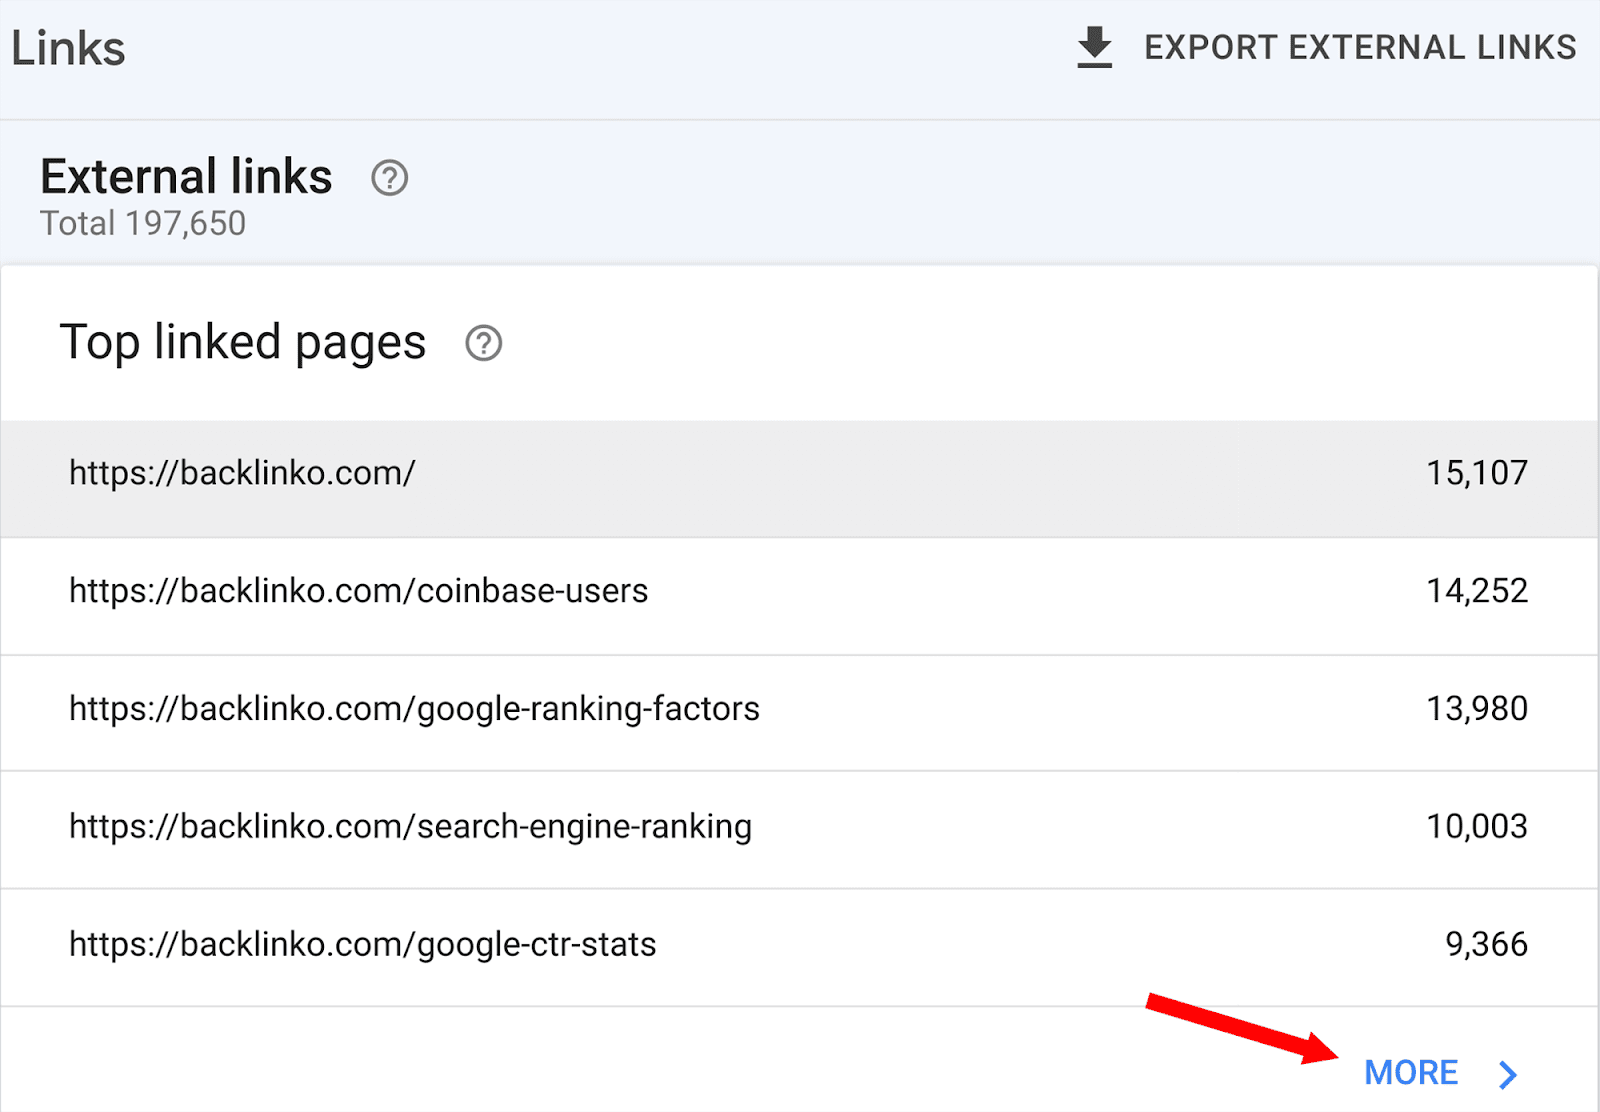
…on the “Links” page, go to the “External Links” section and click “MORE” at the bottom:
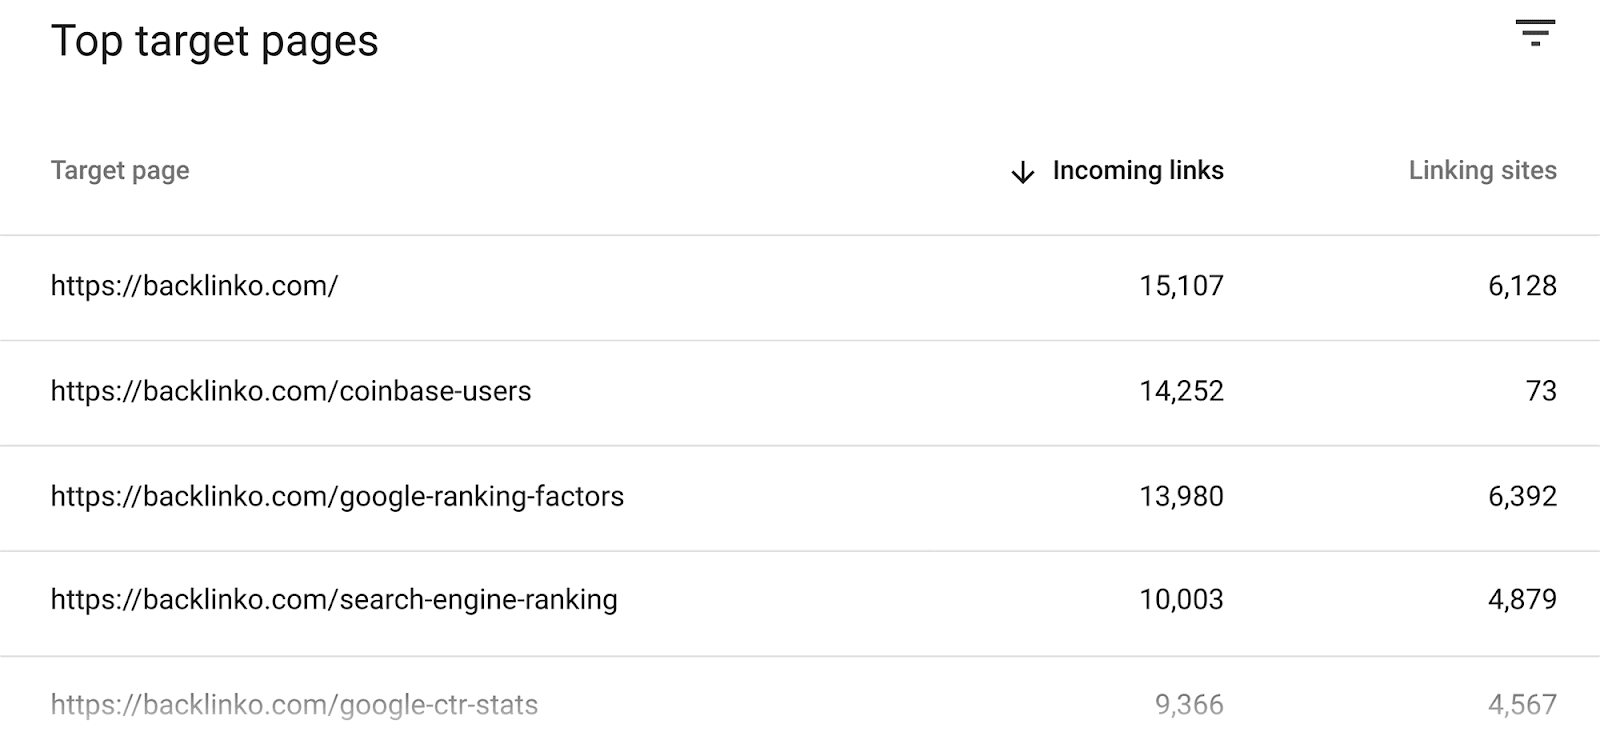
You’ll then be shown a list of the pages on your domain along with the incoming links and referring domains. By default, they’ll be listed in order of the number of backlinks they receive:
If you click on one of these URLs, you can review all the backlinks that the page receives.
For example, when I click on https://backlinko.com, I’m shown a list of all the domains that are currently linking to my homepage, as well as the number of backlinks coming from each domain:
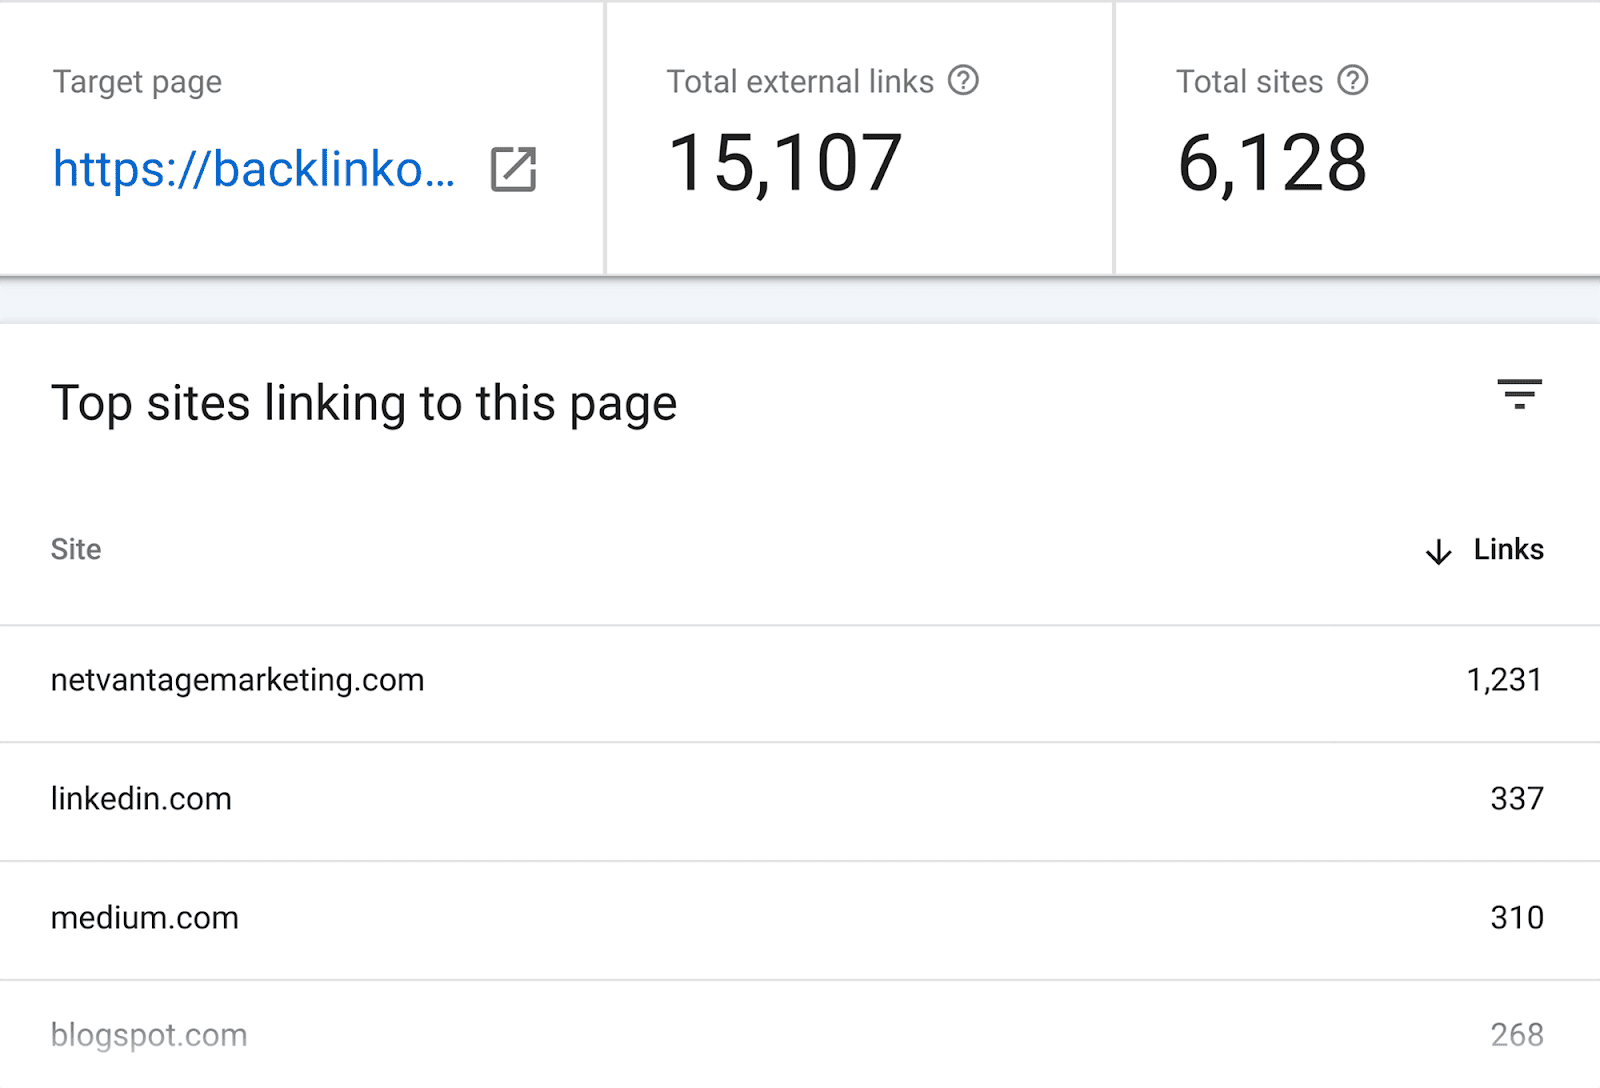
As you can see, the reports aren’t as comprehensive as what you’d obtain through Semrush.
You can’t determine any toxic links you might have, nor can you analyze the anchor text used or the page authority score of the referring domain.
Therefore, I highly recommend investing in Semrush if you want a comprehensive overview of your site’s backlink portfolio. It will provide you with comprehensive data and insights into your backlinks.
2. Tracking page view metrics
After you’ve launched an SEO campaign, measuring its performance is essential.
While checking on SERP positions works as a good performance indicator, reviewing your page view metrics gives you better insight into how your audience engages with your pages.
There are three tools you can use to track page view metrics. These are Google Search Console, Google Analytics 4, and Semrush’s Organic Traffic Insights. I’ll show you how to use all of them.
Google Search Console
Google Search Console (GSC) is used throughout the SEO game.
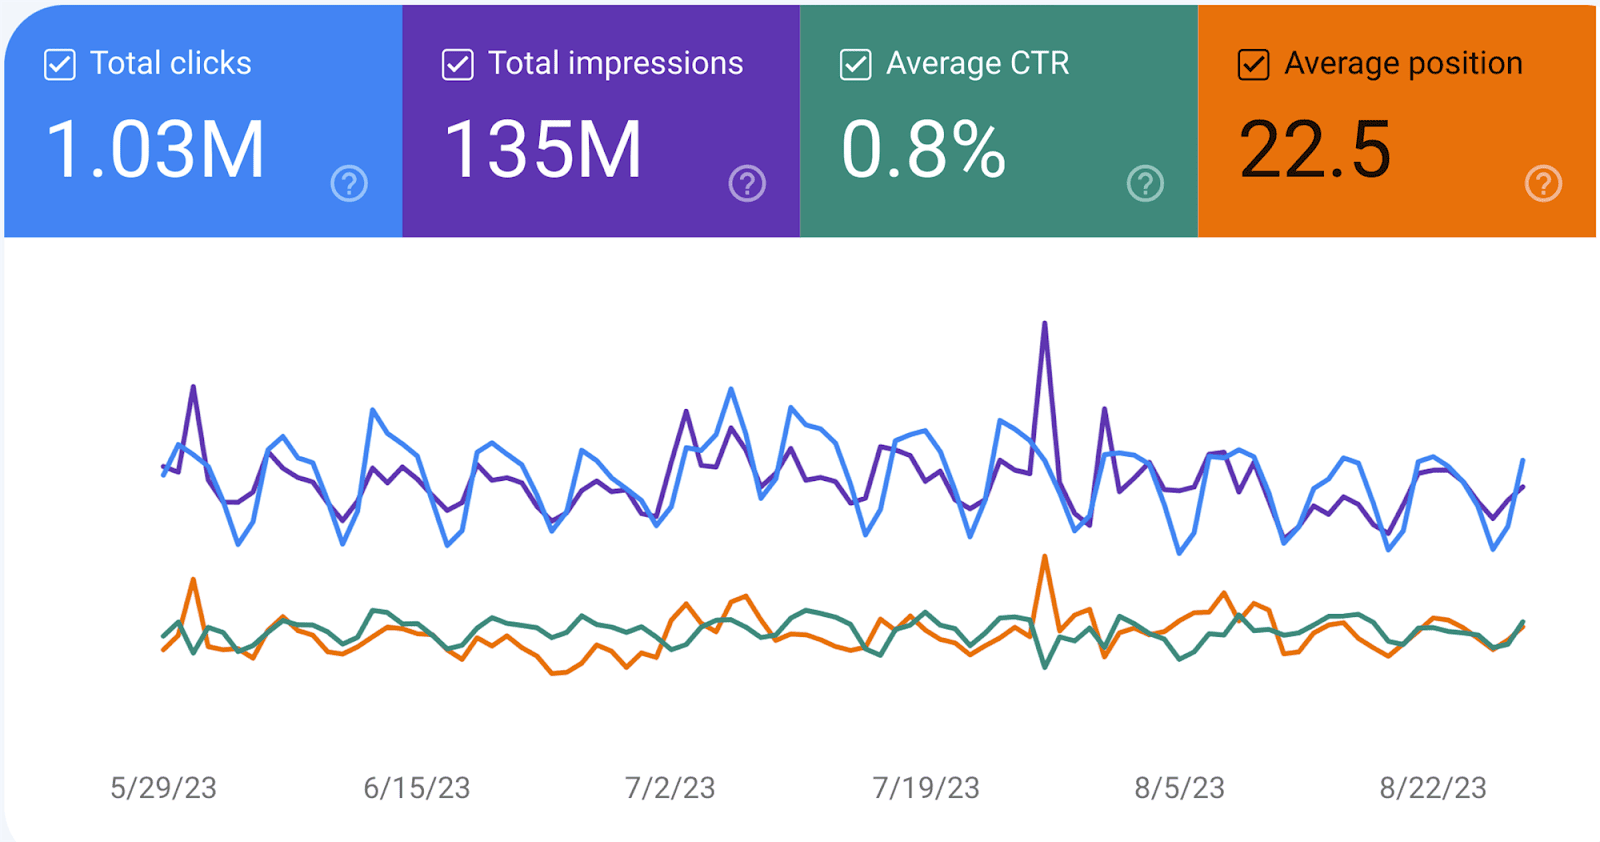
Once you’ve linked your domain to the platform, GSC can be used to analyze key metrics for your pages. These metrics include:
- Total Clicks — This shows you how many times your web page was clicked on via the SERPs.
- Total Impressions — This metric reflects how many times a page from your site appeared in the SERP for a user’s search query.
- Average CTR — This will give you a percentage of how often web users click on your link on average. The calculation for determining Average CTR (Click-Through-Rate) is: (clicks ÷ impressions) x 100.
- Average Position — This metric will show you what your average SERP positions are for your pages.
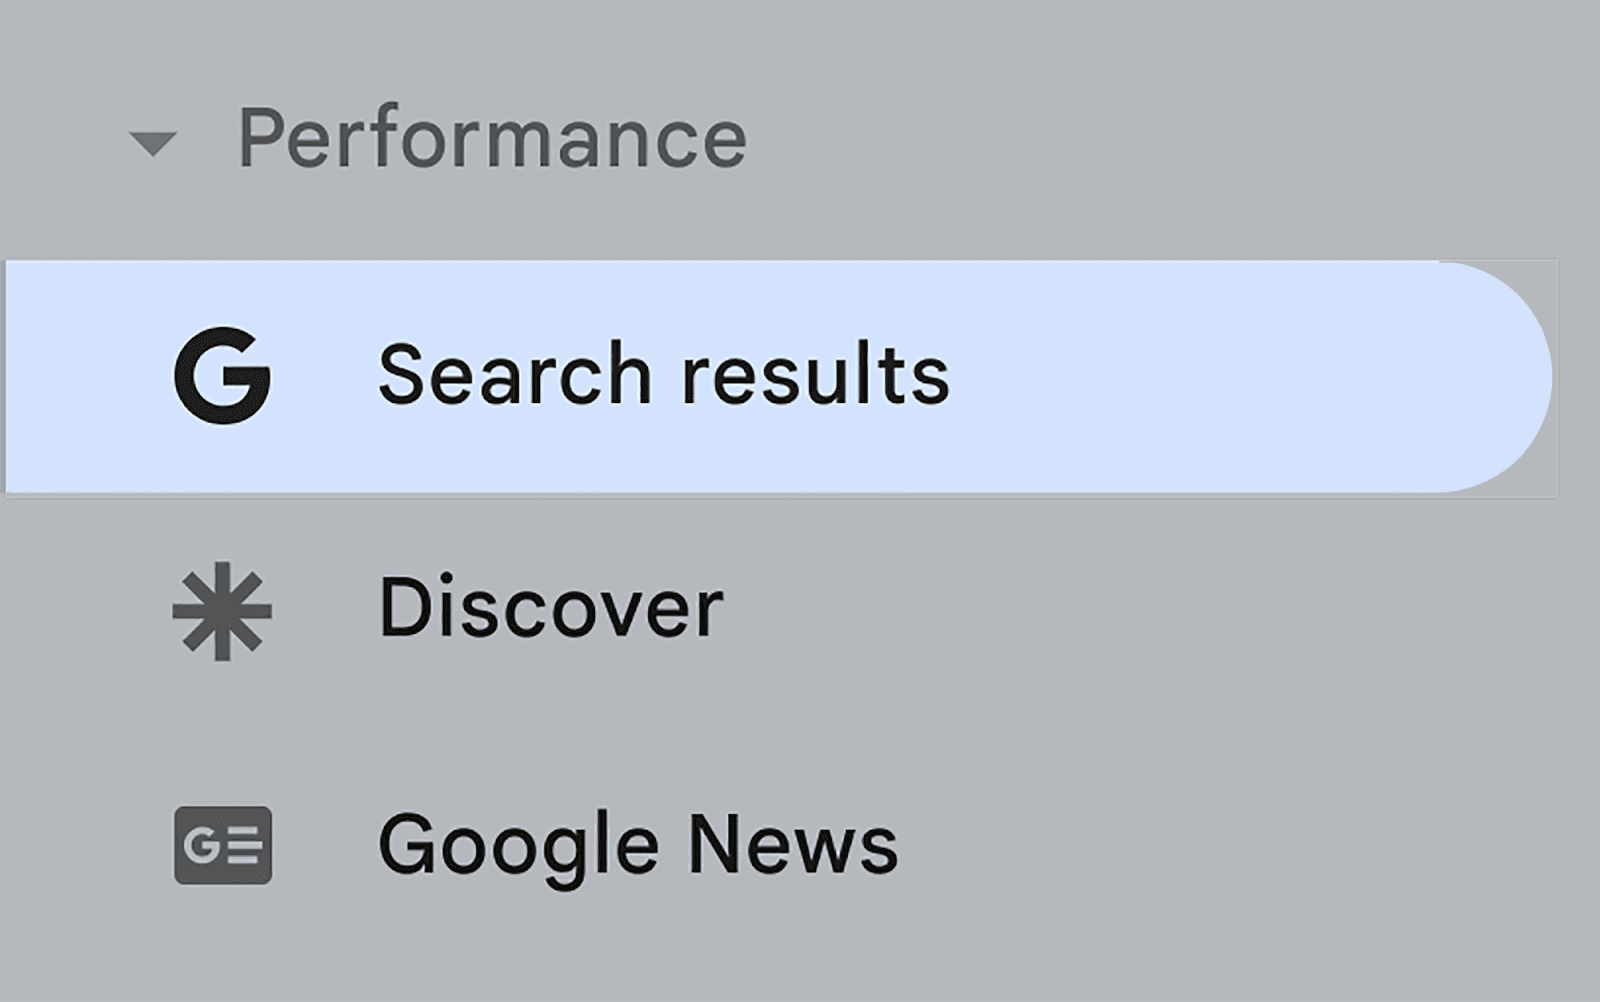
To view these metrics, head over to the “Search Results” tab under the Performance section on the left:
Here, you’ll be able to see the metrics mentioned above, as displayed in the main graph:
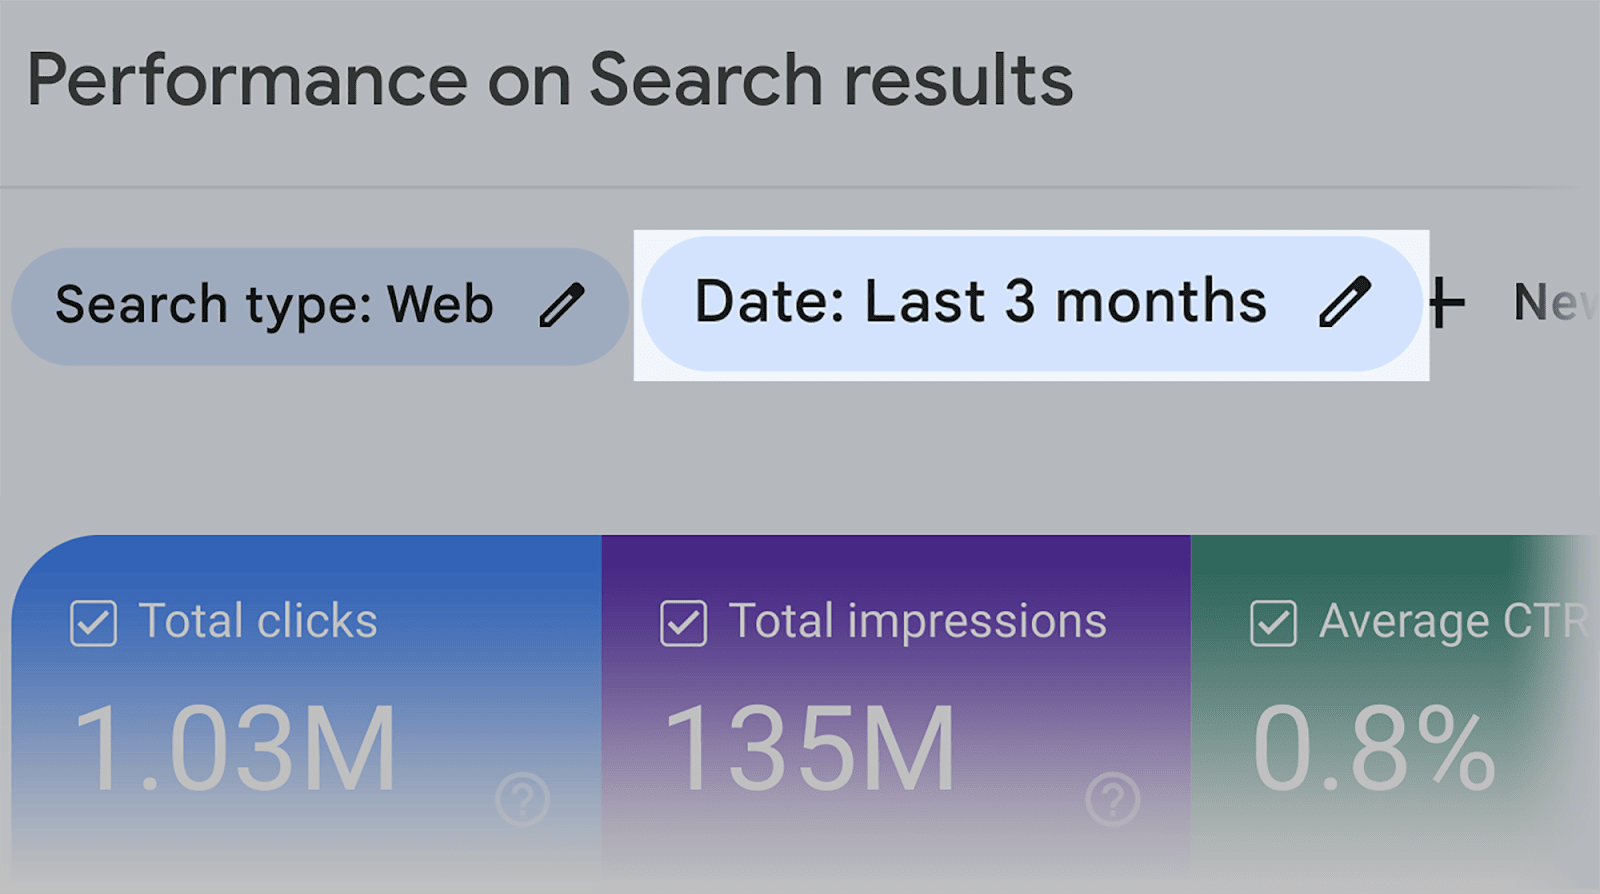
The metrics can be altered depending on the **** parameters you choose, which can be changed by clicking on the “****:” option located above the metrics:
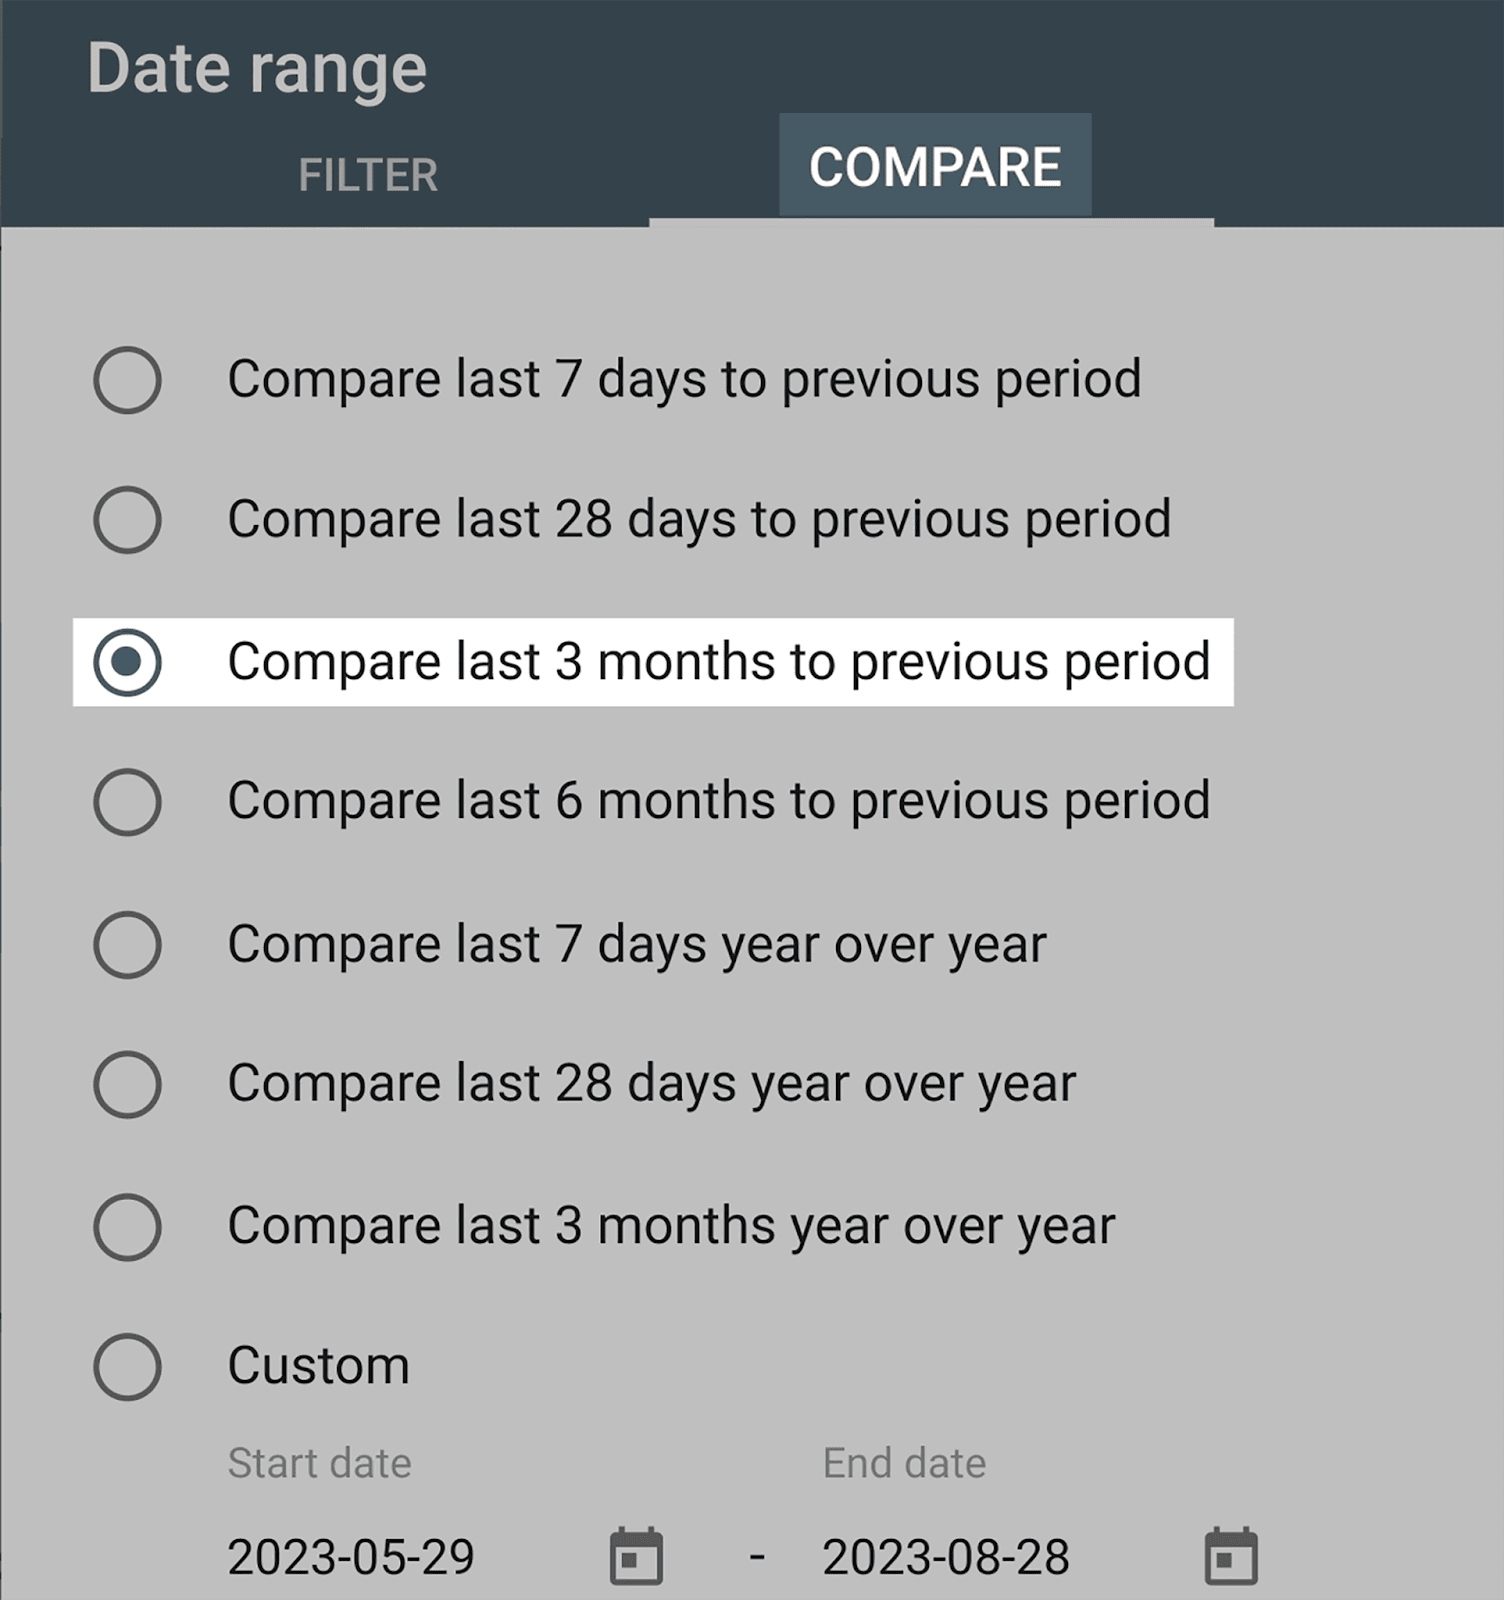
Next, you can choose to alter the reports to any of the following **** parameters or choose a custom **** range:

You can even compare one time frame to another by selecting the “Compare” option on the right.
Once you’ve set your **** parameters, scroll down and click on “Pages”:
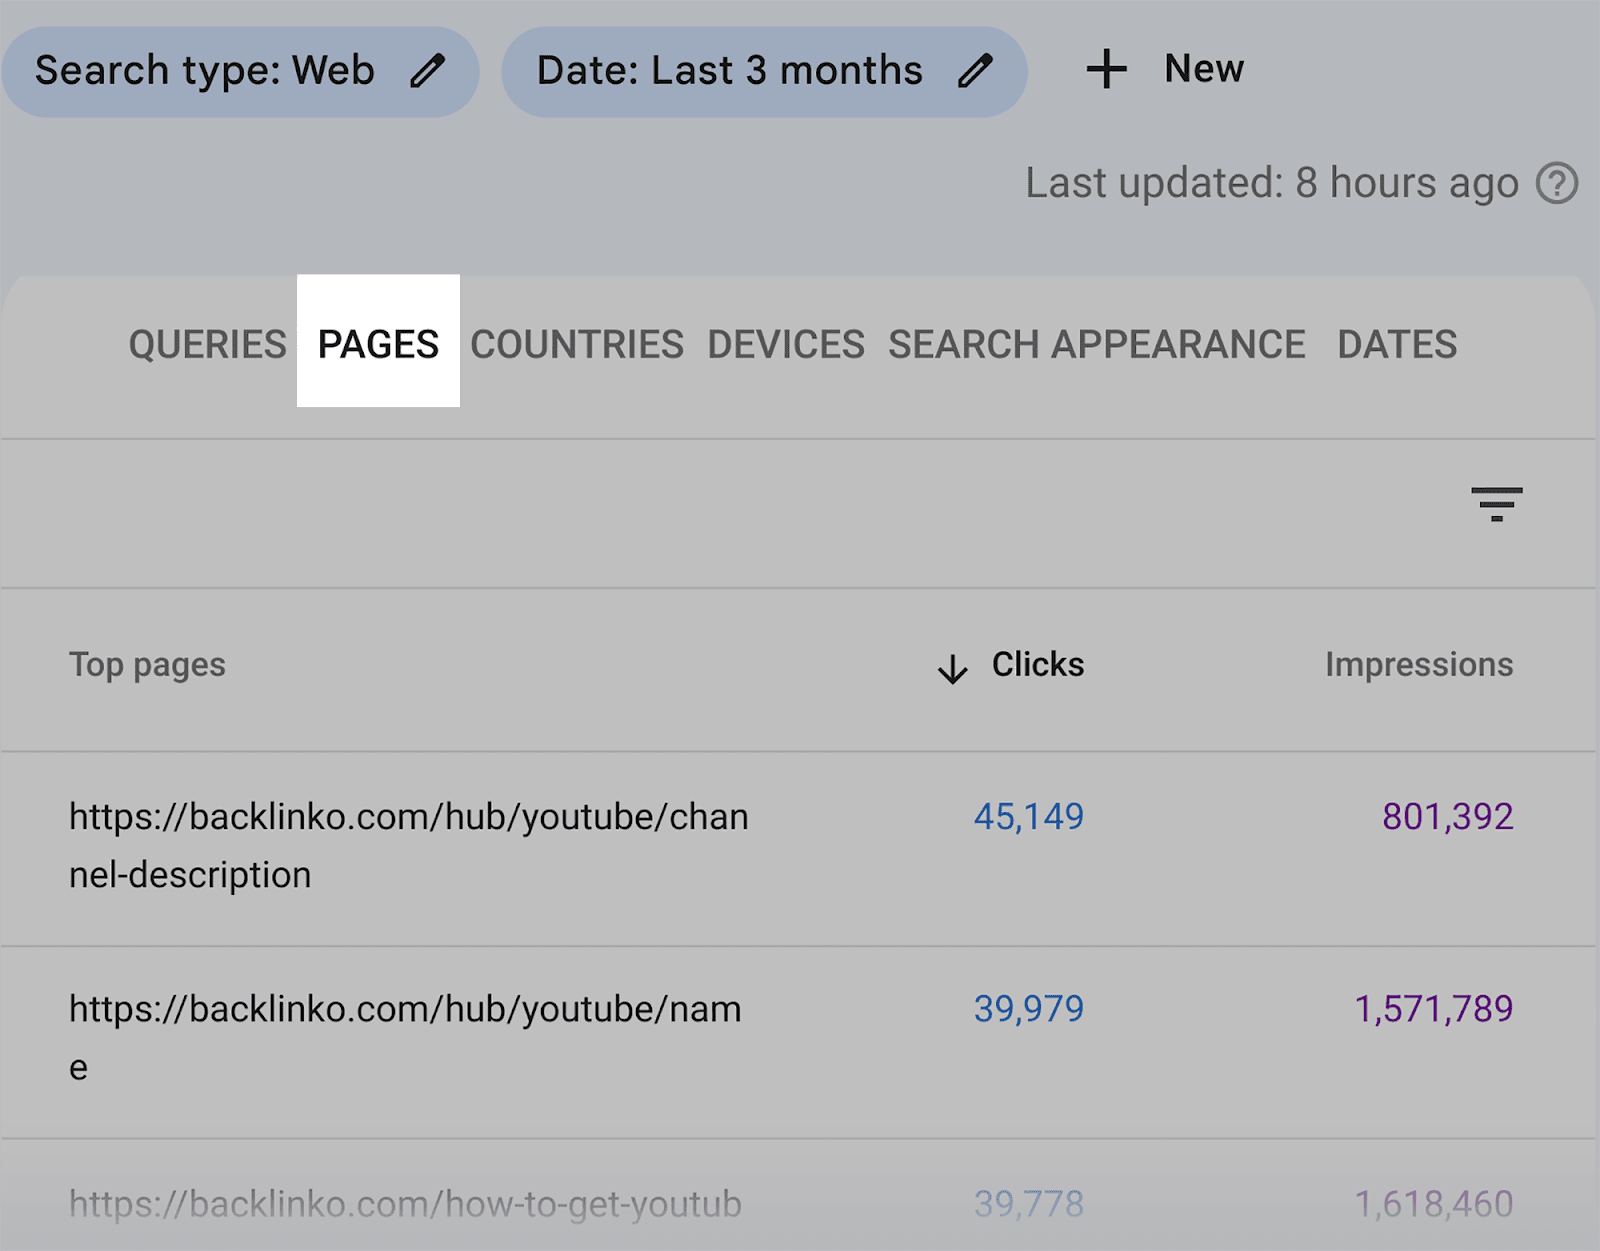
Here are my current top pages, as well as their clicks, impressions, CTR, and average positions:
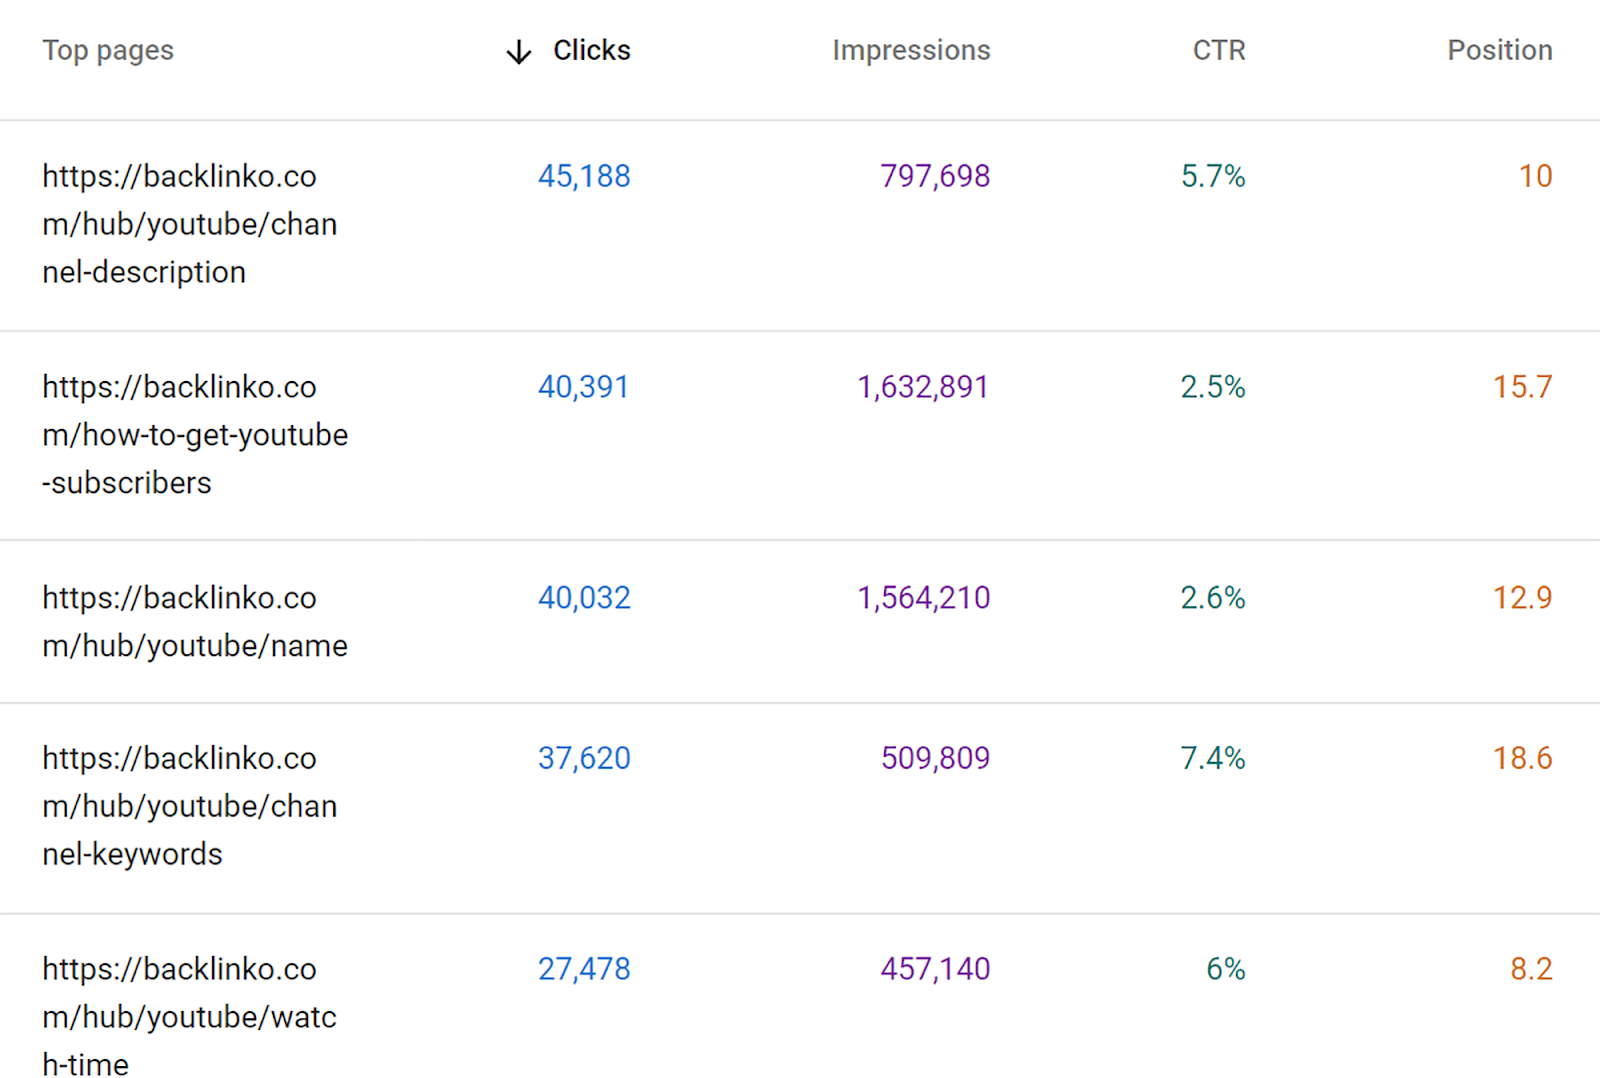
As you can see, using GSC can save you the trouble of having to figure out the number of clicks and impressions your pages are receiving, as well as the CTR and average positions they are in.
This will give you an idea of which pages are performing better than others.
For example, by looking at the “clicks” metric, you can easily identify the topics that are gaining you the most clicks. With this insight, you’ll have a clear direction on which topics to focus on for creating additional content around.
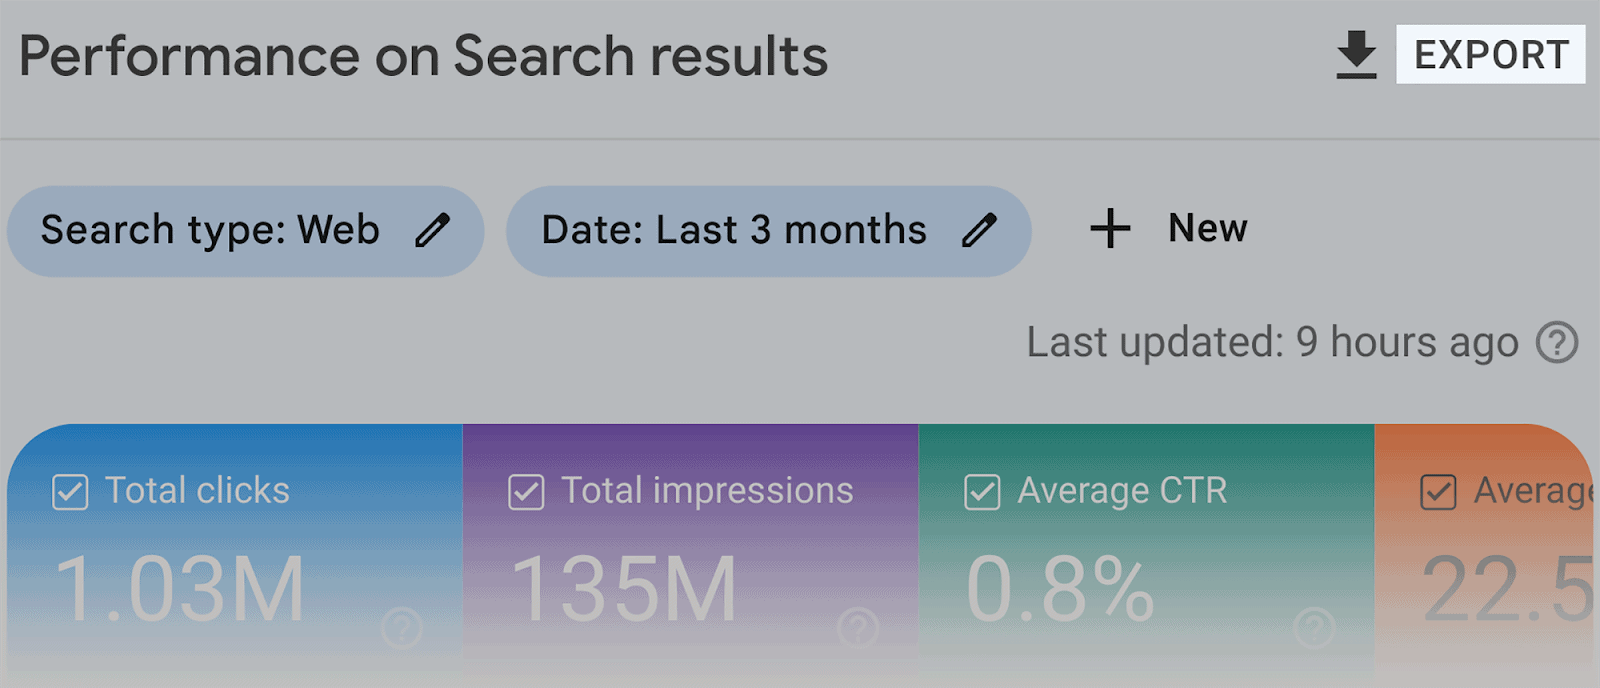
To export your reports, simply click on the “Export” button at the top right-hand side:
Using Google Analytics 4
Google Search Console may be good for giving you an overview of your clicks, impressions, and so on. However, if you want to view more granular data related to your page view metrics, I’d recommend using Google Analytics 4.
When it comes to tracking page view metrics, there are two sections of Google Analytics 4 that are particularly helpful: ‘Pages and screens” is one of them, “Landing page” is the other.
Let’s start with Pages and screens.
“Pages” refers to all your web pages that your visitors click on during their time on your site. It does not only record the page they land on, but every single page they visit as a whole.
“Screens” is similar to “pages”, but refers to the different sections of your app that users visit.
With GA4’s Pages and screens, you can analyze the following:
- Views — This gives you an understanding of which pages receive the most views.
- Users — This metric shows you the number of unique users that visit your site. Unlike the “views” metric, each visitor is only counted once.
- Views per user — This metric represents the average number of page views generated by website visitors.
- Average engagement time — This gives you an indication of the average amount of time that users spend actively on your web page.
- Event count — This metric represents the amount of events that users have triggered while visiting your web pages. Events can include page clicks, downloads, video views, and custom events that you’ve set in GA4.
- Conversions — With this metric you can see the number of purchasers, mail subscriptions, or other goals that have been completed by your site visitors.
Where can you find these metrics?
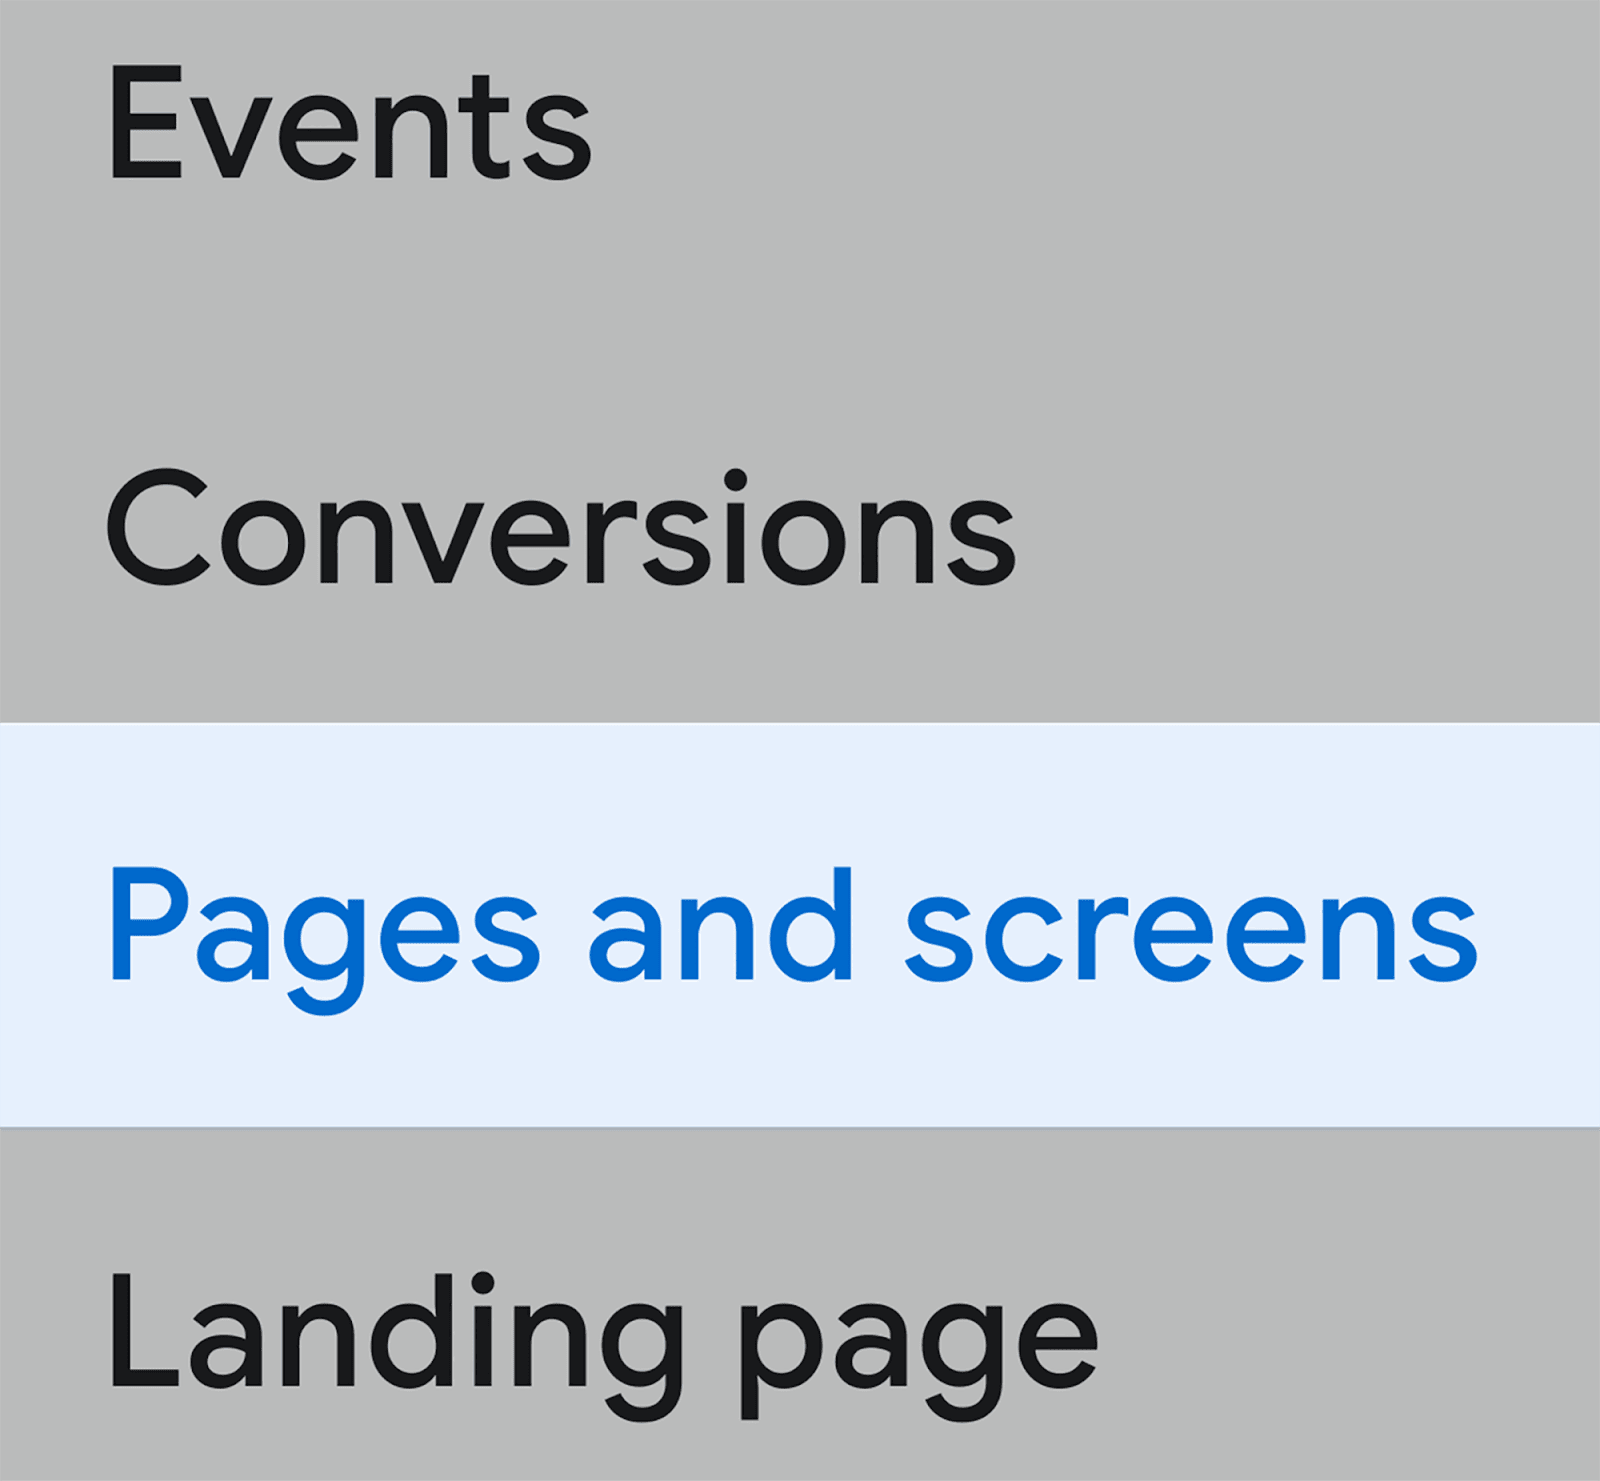
Once you’ve set up your GA4 account for your domain, head over to the Pages and Screens report, which is below “Engagement” in the Reports menu:
When you land on the Pages and Screens dashboard, scroll down and you’ll see a list of all your URLs along with their page view metrics.
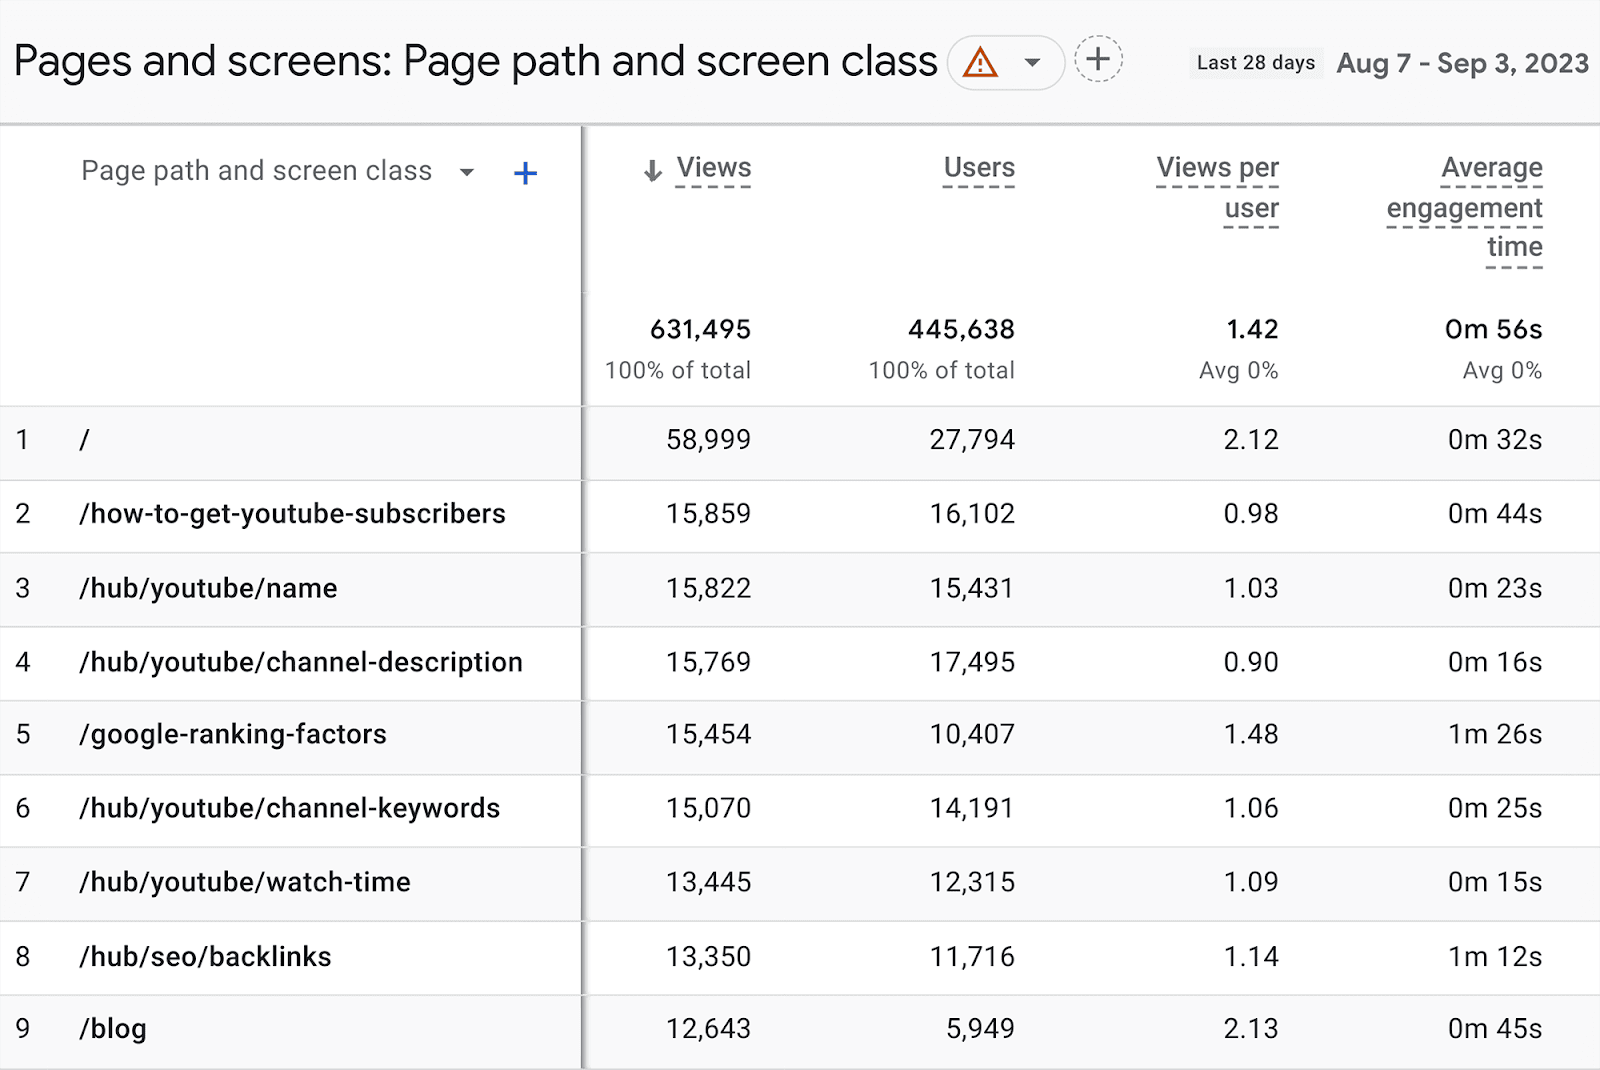
Overall, the Pages and Screens section is useful for determining which parts of your site users navigate to the most.
You can also use the average engagement time, event count, and conversion metrics to determine whether the pages are performing well, or if adjustments need to be made.
From the menu on the left, you can also reach the Landing page report. You can find this directly below Pages and Screens, as shown here:
As the name implies, the focus of this report is to show you a list of your top-performing landing pages. I.e., the first-page visitors land on when entering your website.
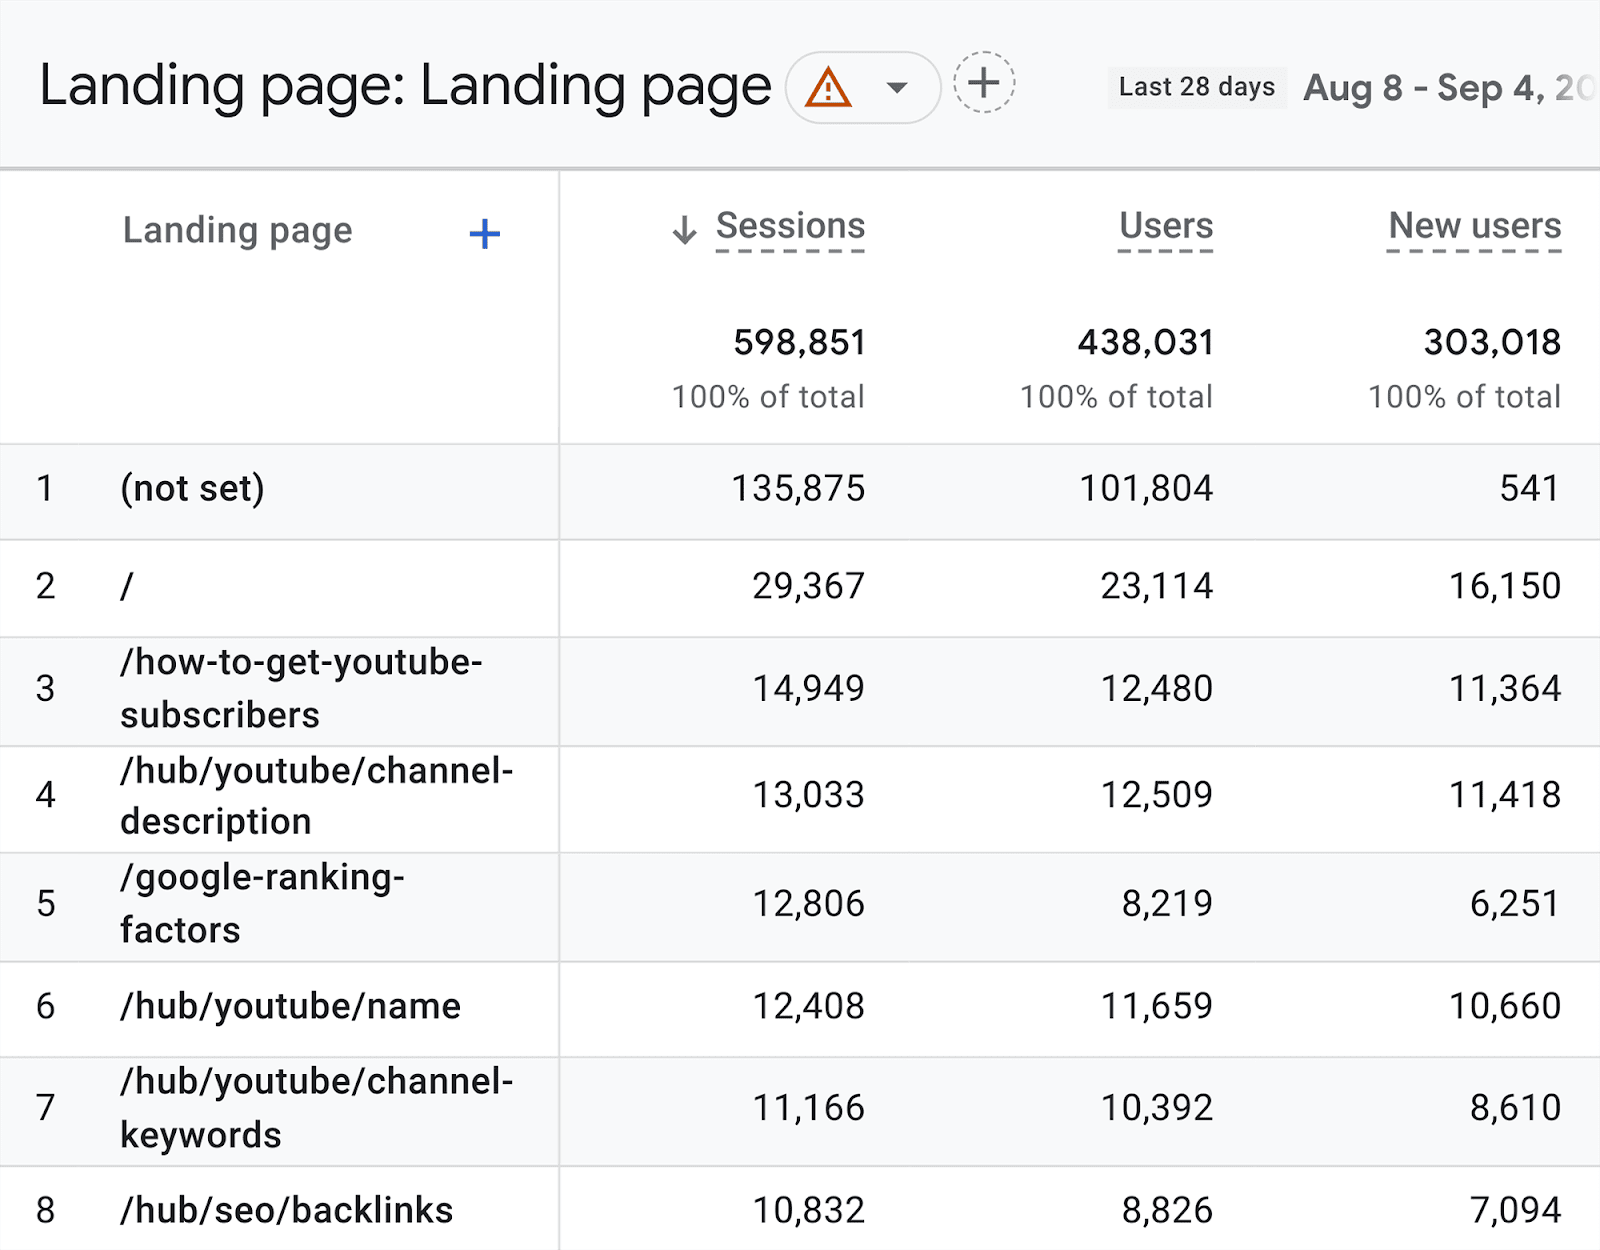
Here, you can review metrics such as:
- Sessions — Reflects the total amount of sessions users spent on each of your pages listed.
- Users — The total number of unique users that have visited each page within the specified time frame.
- New users — Examines only the visitors who have visited each landing page for the first time during the specified time frame.
- Average engagement time per session — How long users spend engaged on your website in sessions initiated from each of the landing pages.
- Conversions — How many desired actions site visitors completed after visiting the landing page.
- Total revenue — The total amount of money made from conversions secured via the landing page.
By reviewing all of this, you can see how well each page is performing. I.e., are these landing pages resulting in conversions?
It also helps you identify pages that aren’t performing well. If you find a landing page that has a low engagement time or drives no conversions, perhaps there is something wrong with it. In that case, you should visit the page and investigate.
Overall, GA4 can be used to automate the process of tracking your page views and the performance of your pages.
Using Semrush’s Organic Traffic Insights
If you’d prefer to analyze your page view metrics all in one place, then you can use Semrush’s Organic Traffic Insights tool.
Not only can you use this tool to draw in data from Google Search Console, but you can use it to gather data from GA4, too.
Here’s how to use the tool. Click “Organic Traffic Insights” found under the Keyword Research section:
Enter your domain and click “Get Insights”:

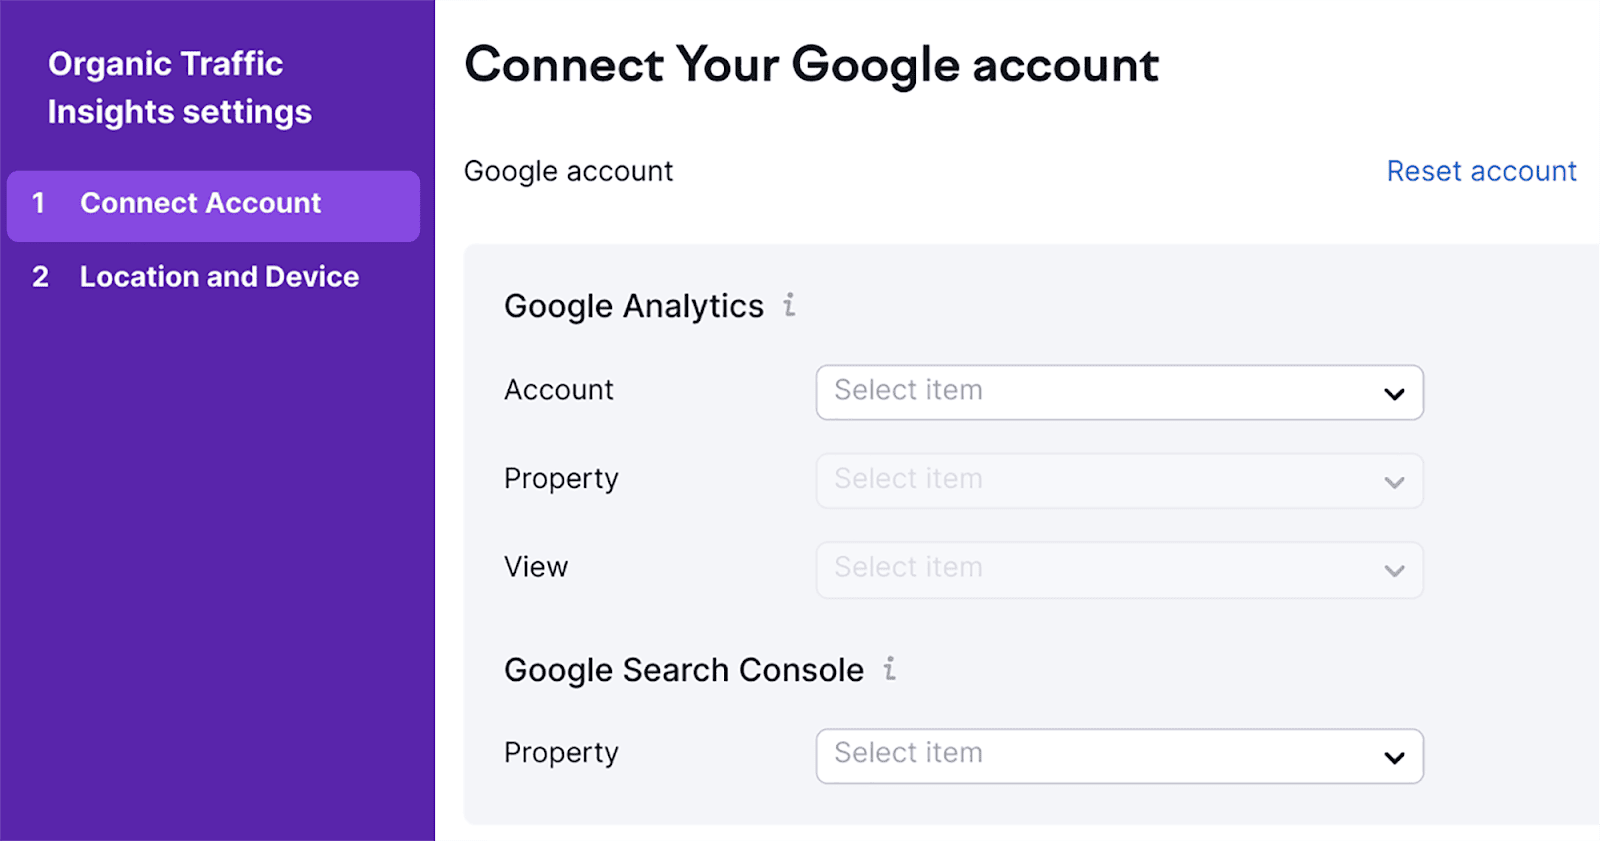
You’ll then have to connect your Google Search Console and GA4 account to Semrush.
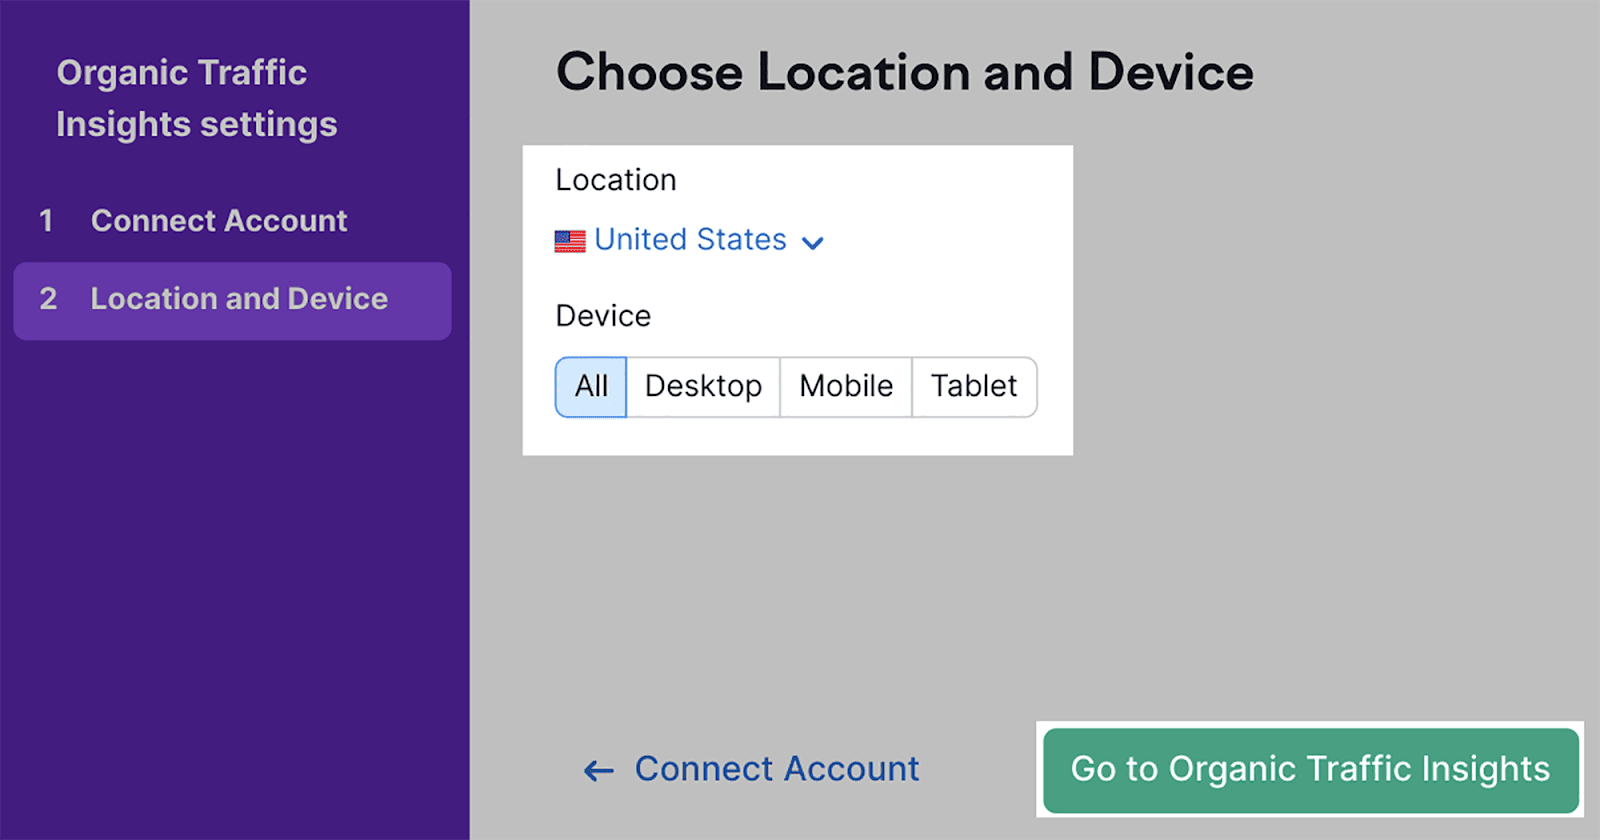
Then select a “Location” and “Device”, and hit “Go to Organic Traffic Insights:
You’ll then be able to analyze data from Google Analytics 4, Google Search Console, and Semrush – all in one tool.
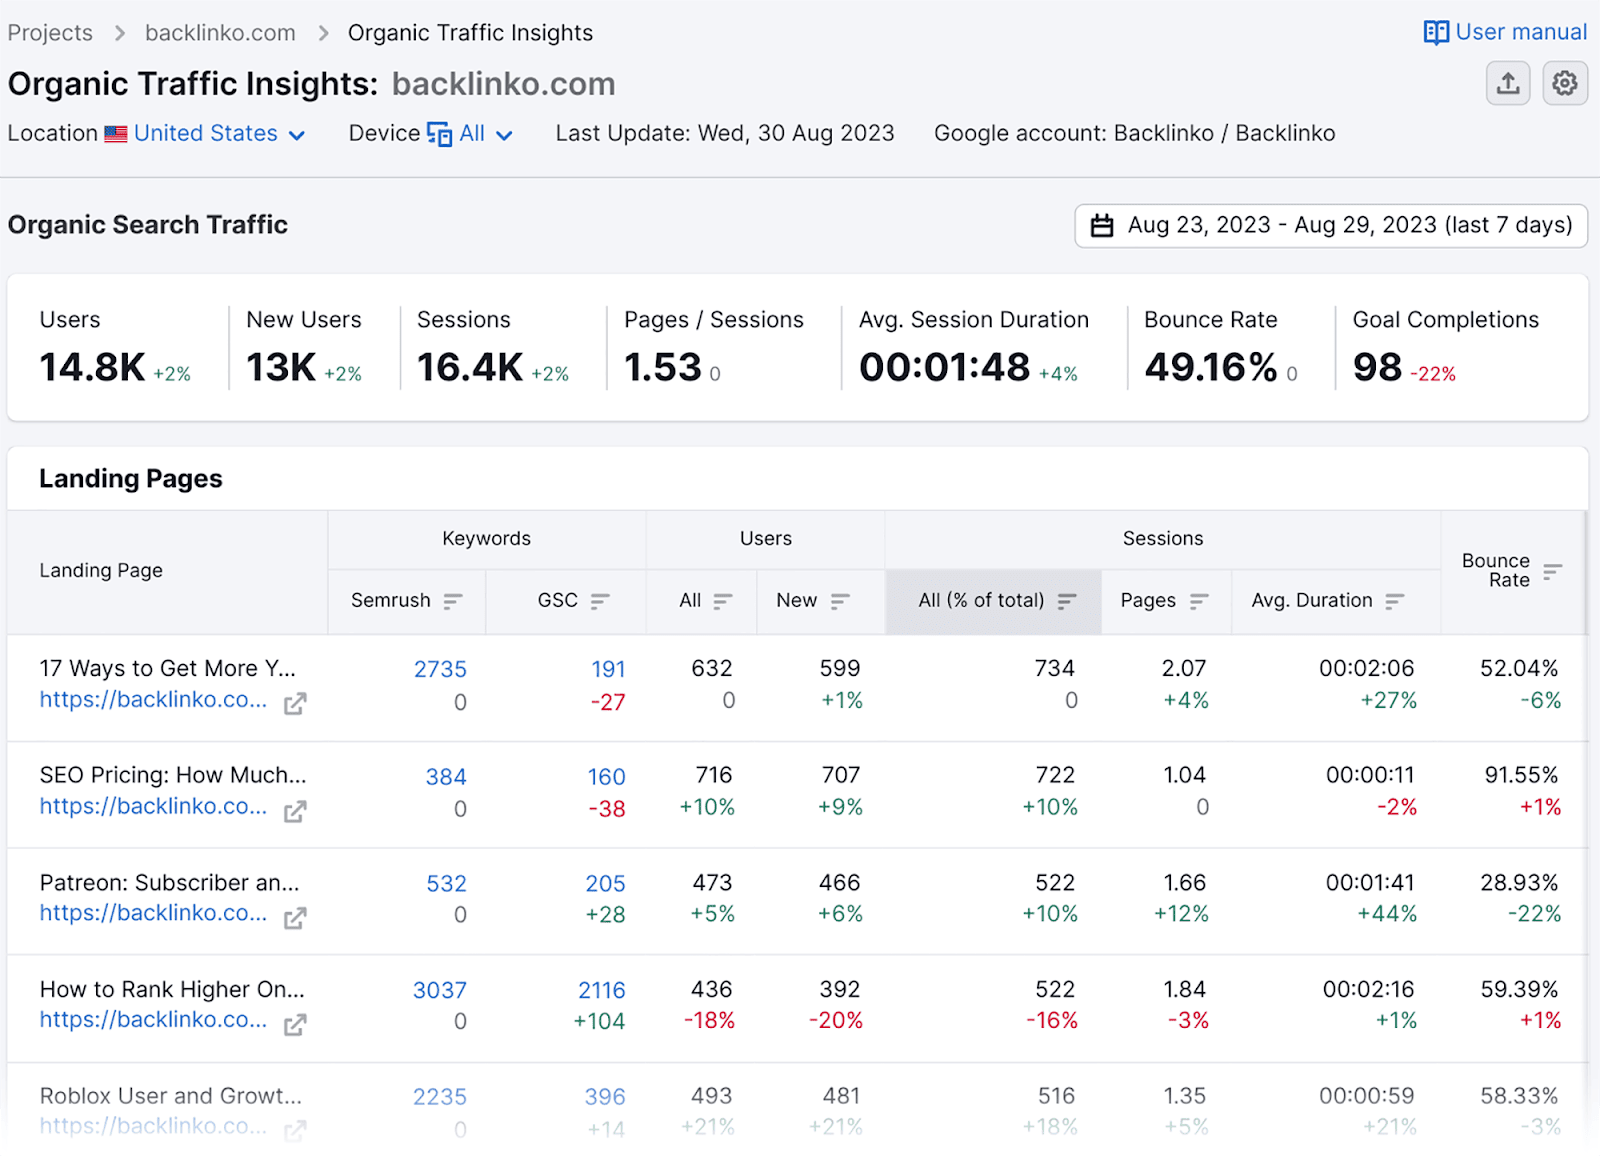
As you can see, this report is loaded with insightful metrics which include:
- Users — This refers to the total number of unique users who logged an event.
- Sessions — Sessions measure how many times your users engage with your page during a particular period. Google defines a “session” as being 30 minutes in length. If a user clicks on a new page on your site once this 30 minutes is up, then a second session will be recorded.
- Pages/sessions — The average number of pages visited per session.
- Avg. sessions duration — The average amount of time your site visitors spent on your web pages.
- Bounce rate — The percentage of site visitors who left after only visiting one page.
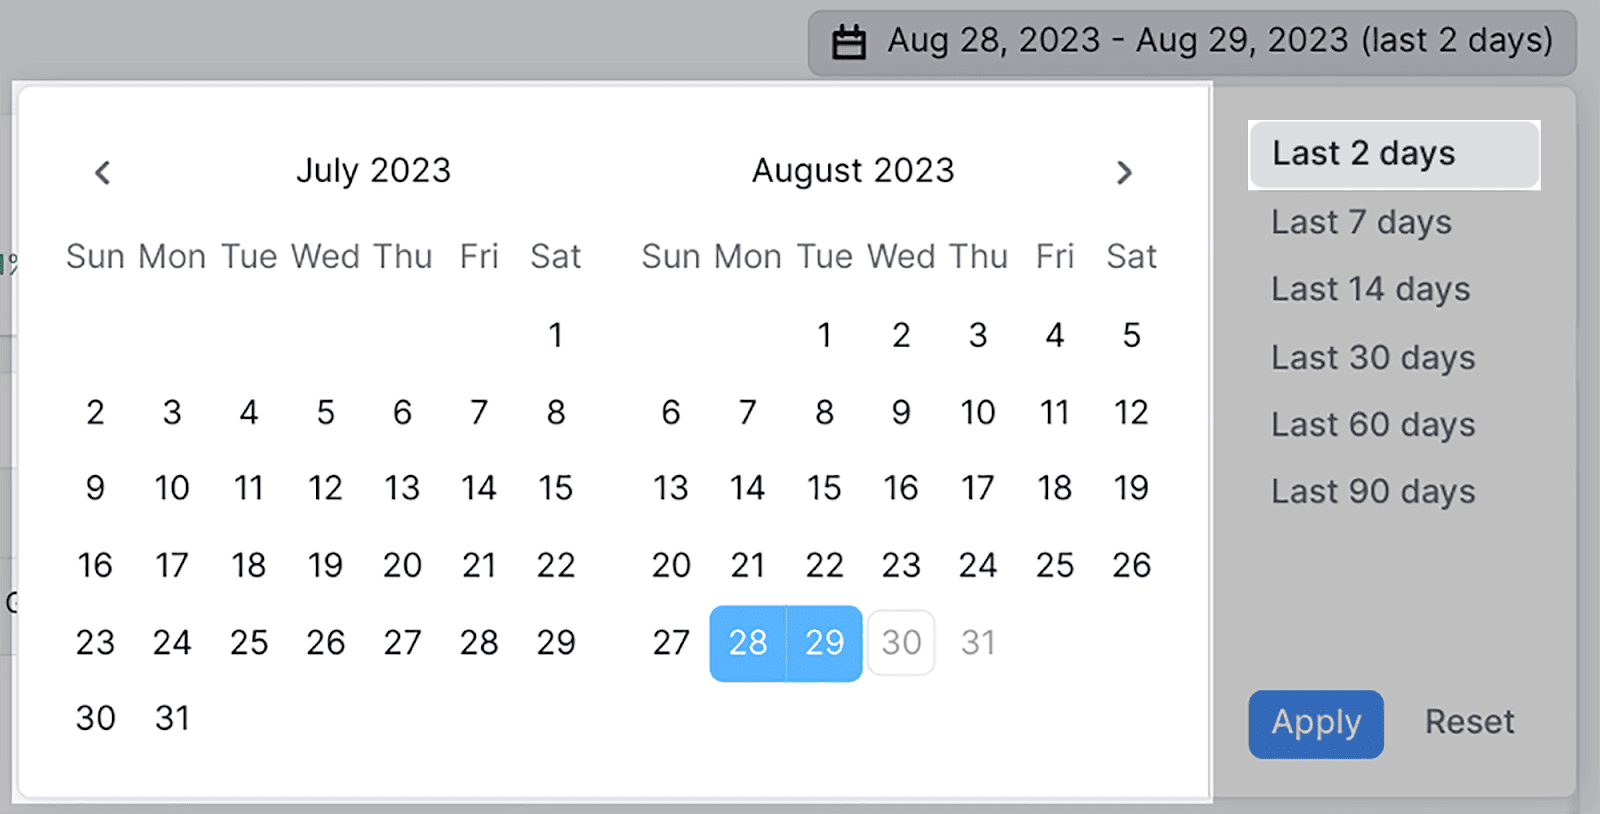
To view how these metrics change over time, you can also adjust the **** range at the top right:

For example, if I wanted to get insights for the last two days, I can select this and hit “Apply”, as shown here:
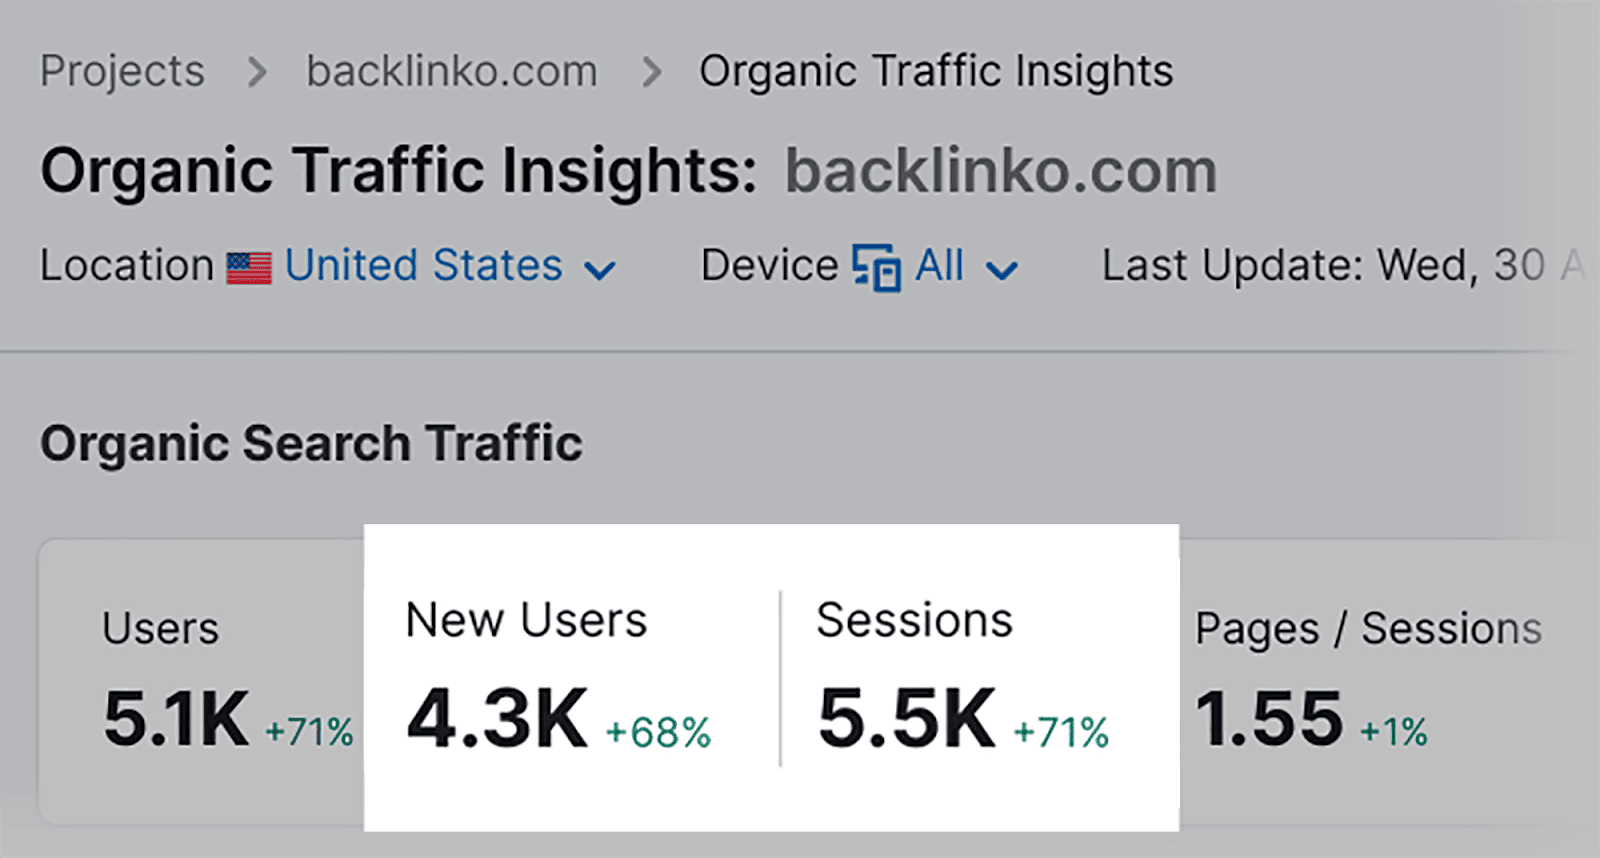
I can see that my domain gained 4.3k new users and the sessions went up by 71% to 5.5k:
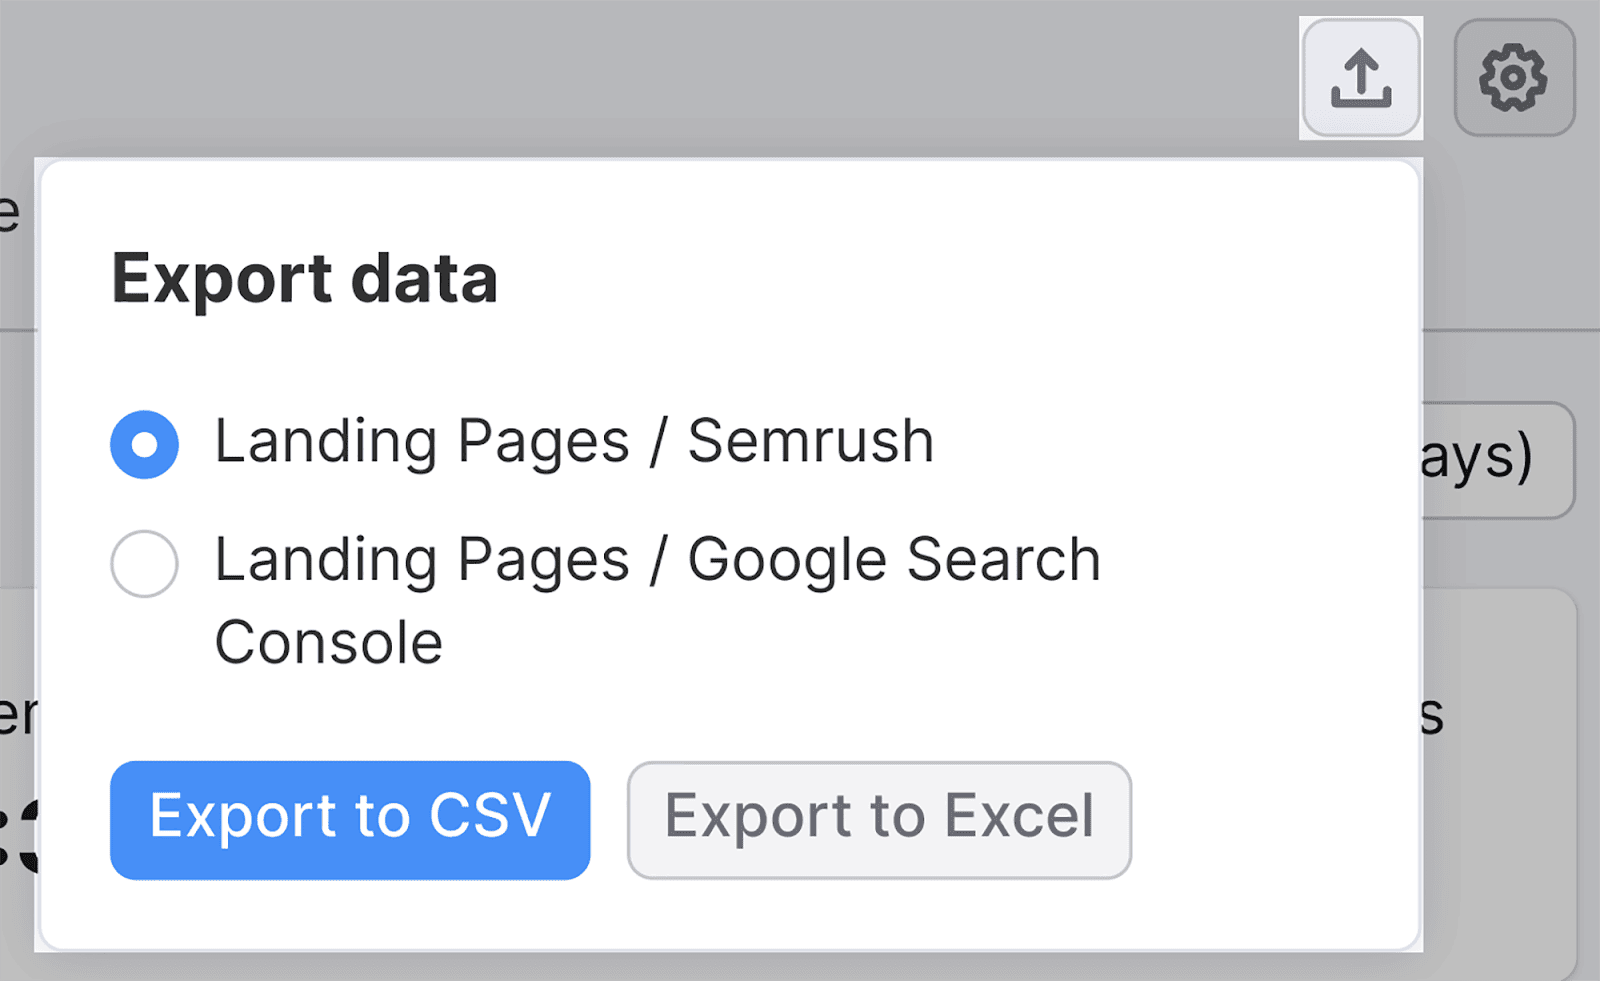
If you need to export your Organic Traffic Insights report, click on the export button at the top right-hand side of the page, and choose which report you want to export:
Overall, Semrush’s Organic Traffic Insights tool streamlines the process of reviewing your page view metrics by seamlessly integrating data from both GSC and GA4. This means you can conveniently access and analyze all your important metrics in one single dashboard.
With these insights, you’ll be able to identify your top-performing pages and areas where improvements need to be made.
3. Page indexing
When you need to check whether Google has indexed your pages, then you can do so easily in GSC. After all, you won’t be able to rank on the SERPs if your pages aren’t indexed.
All you need to do is head over to “Pages”, which you’ll find below the “Indexing” section:
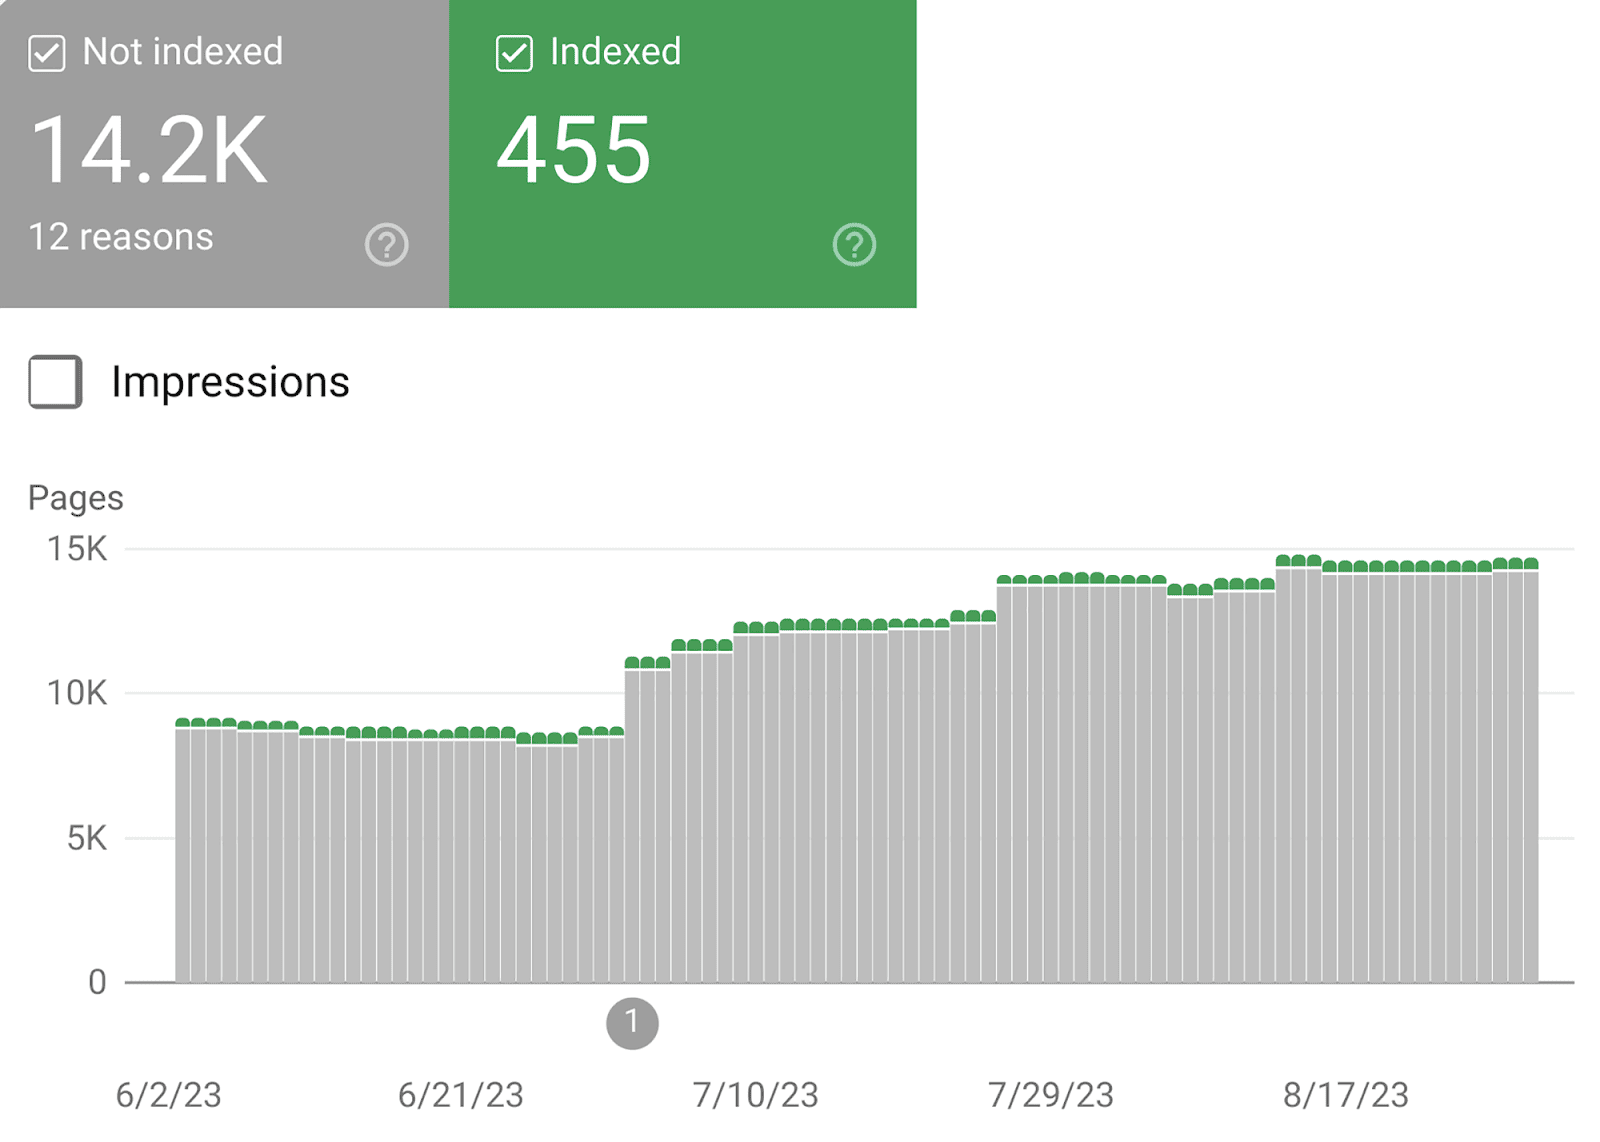
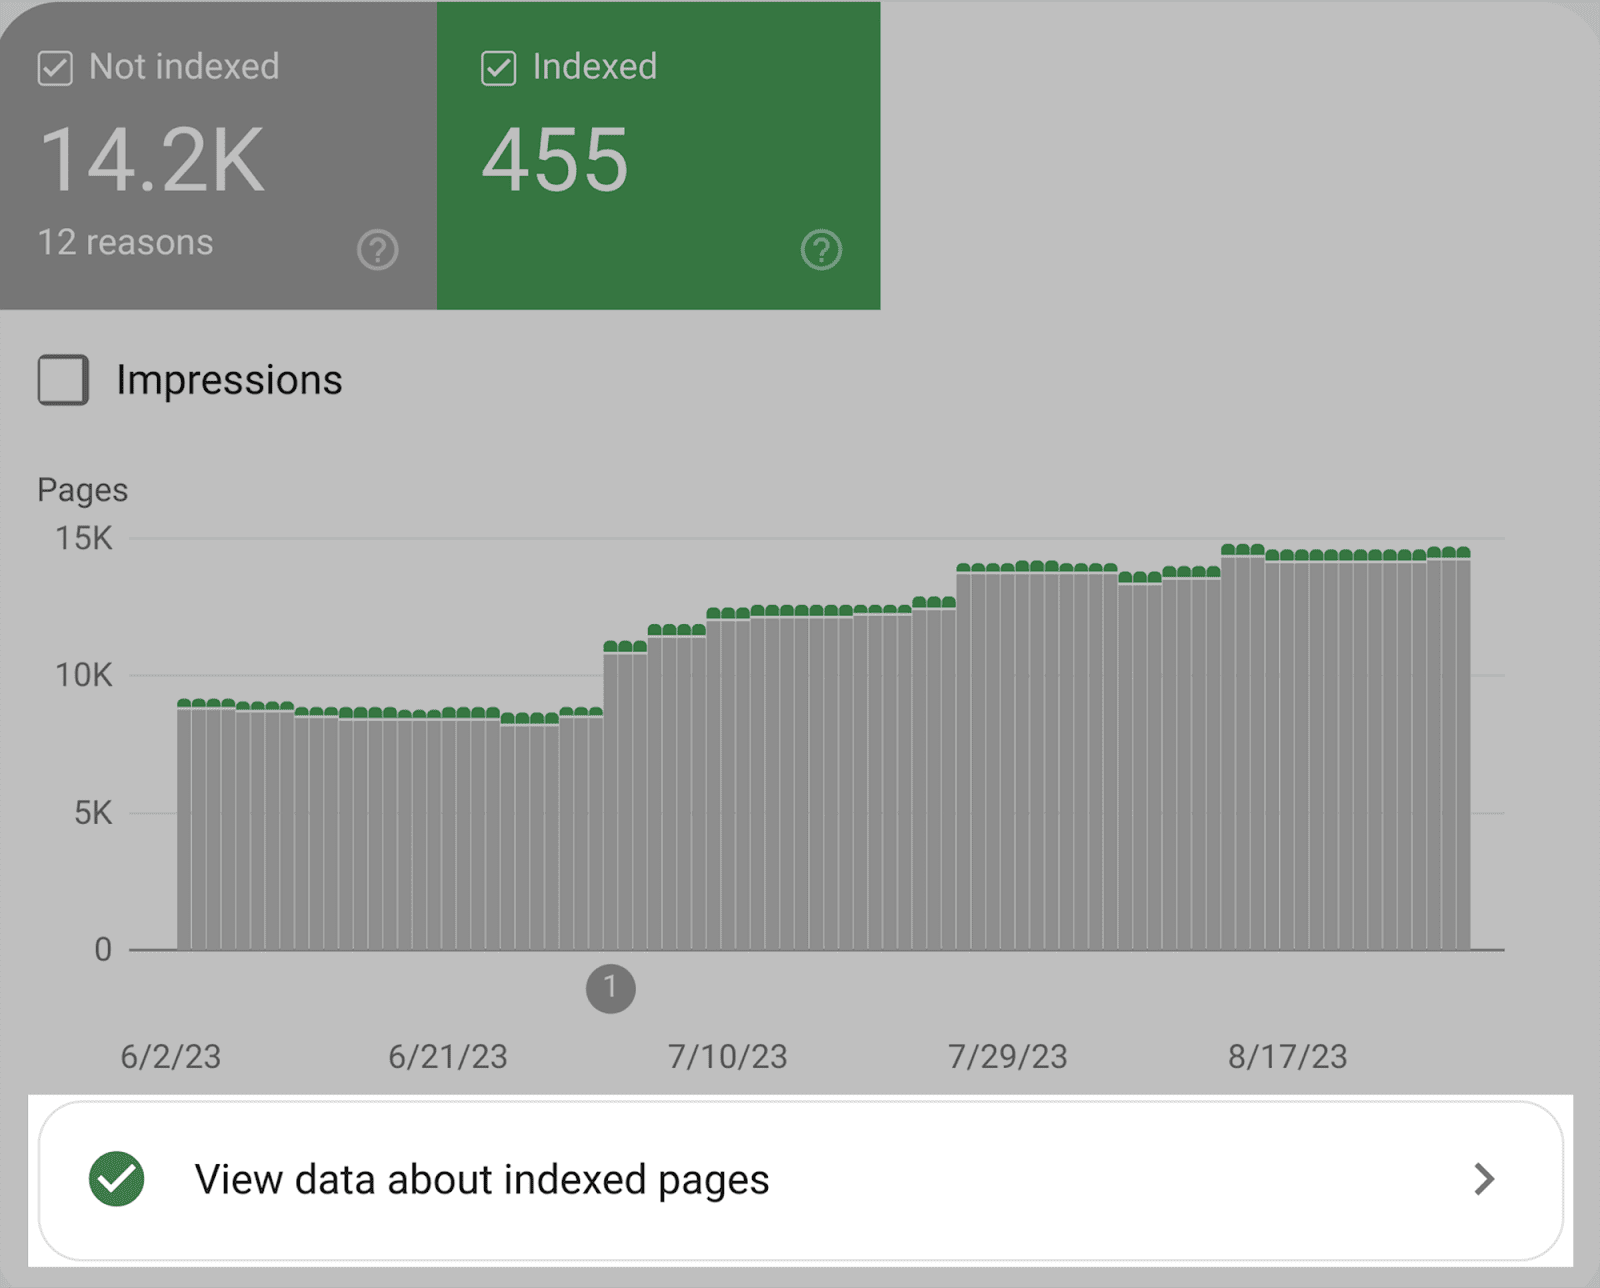
This will then give you an overview of how many pages on your site are currently indexed, as well as the pages that aren’t:
If you click on “View data about indexed pages”…
…and scroll down, you’ll see a list of all your indexed pages, listed in order of when they were last crawled:
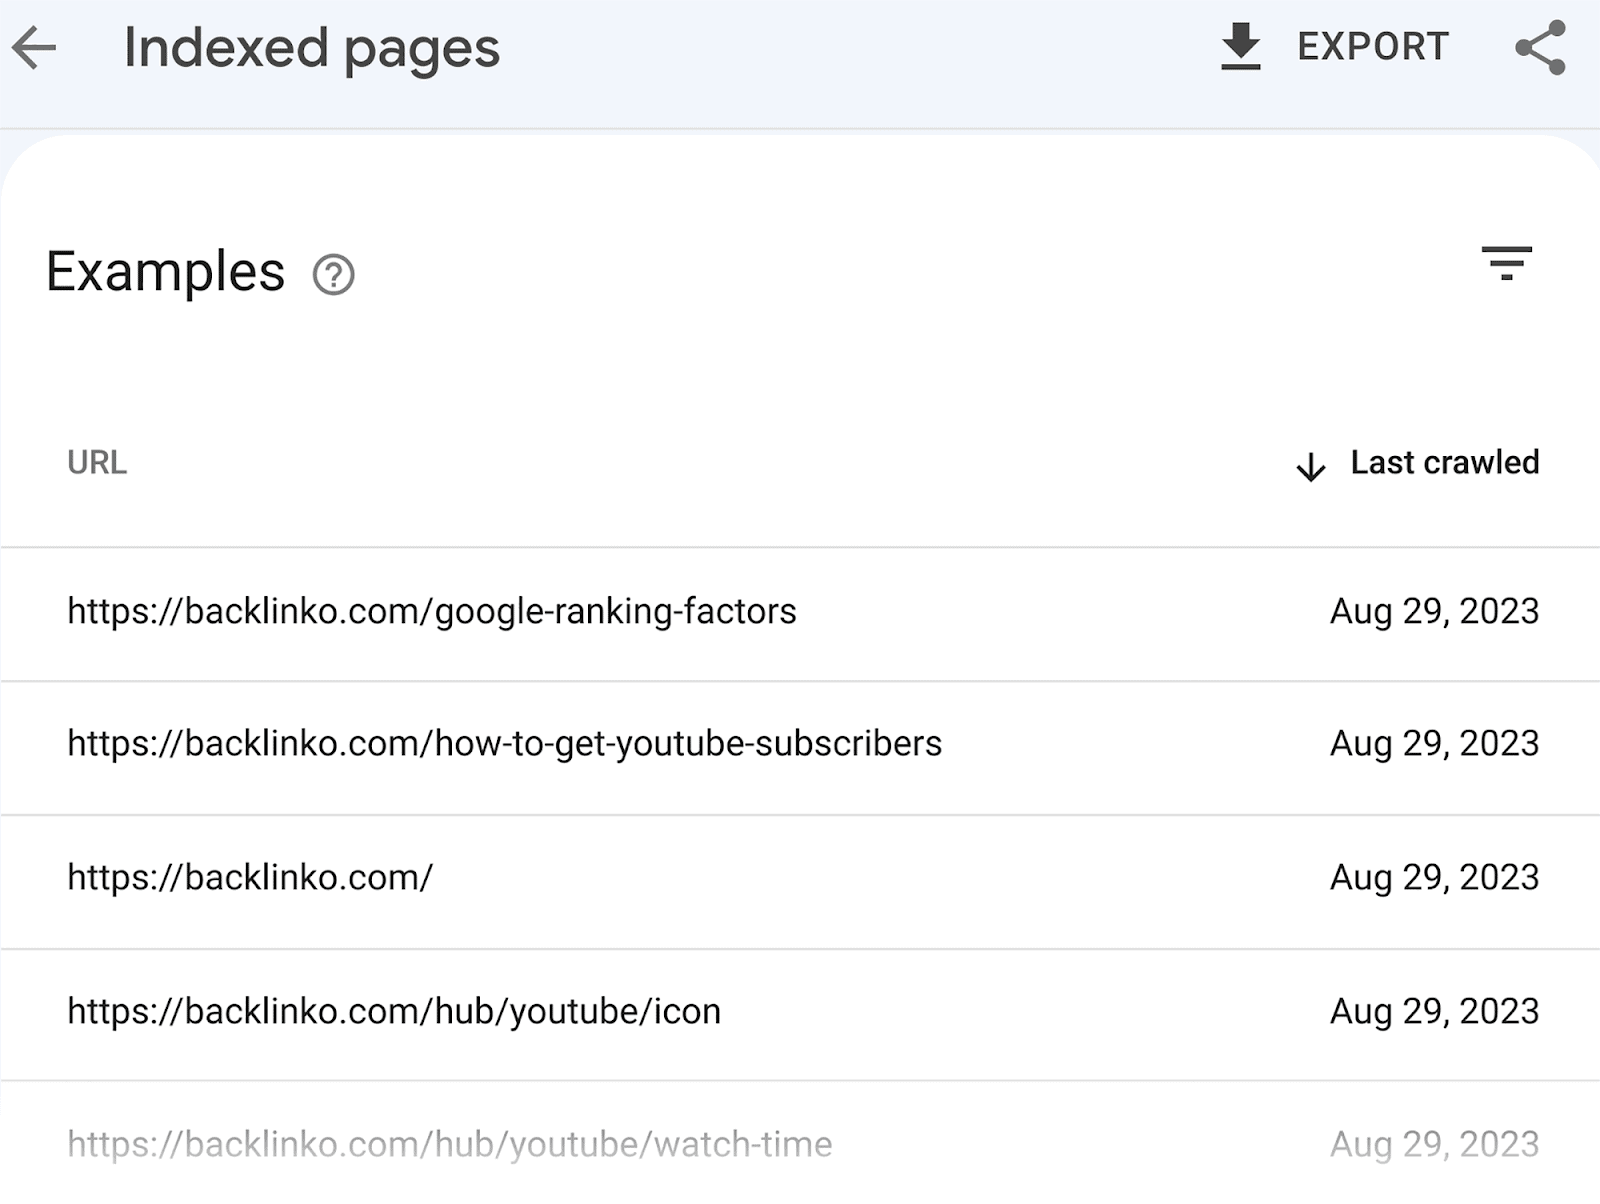
This can save you a ton of time from having to manually check for your pages on Google, especially if you have a large website with hundreds of pages.
But what about pages that aren’t indexed?
To see all the pages on your site that aren’t currently indexed, simply return to the Page Indexing dashboard.
Scroll down and you’ll see a table titled “Why pages aren’t indexed”:
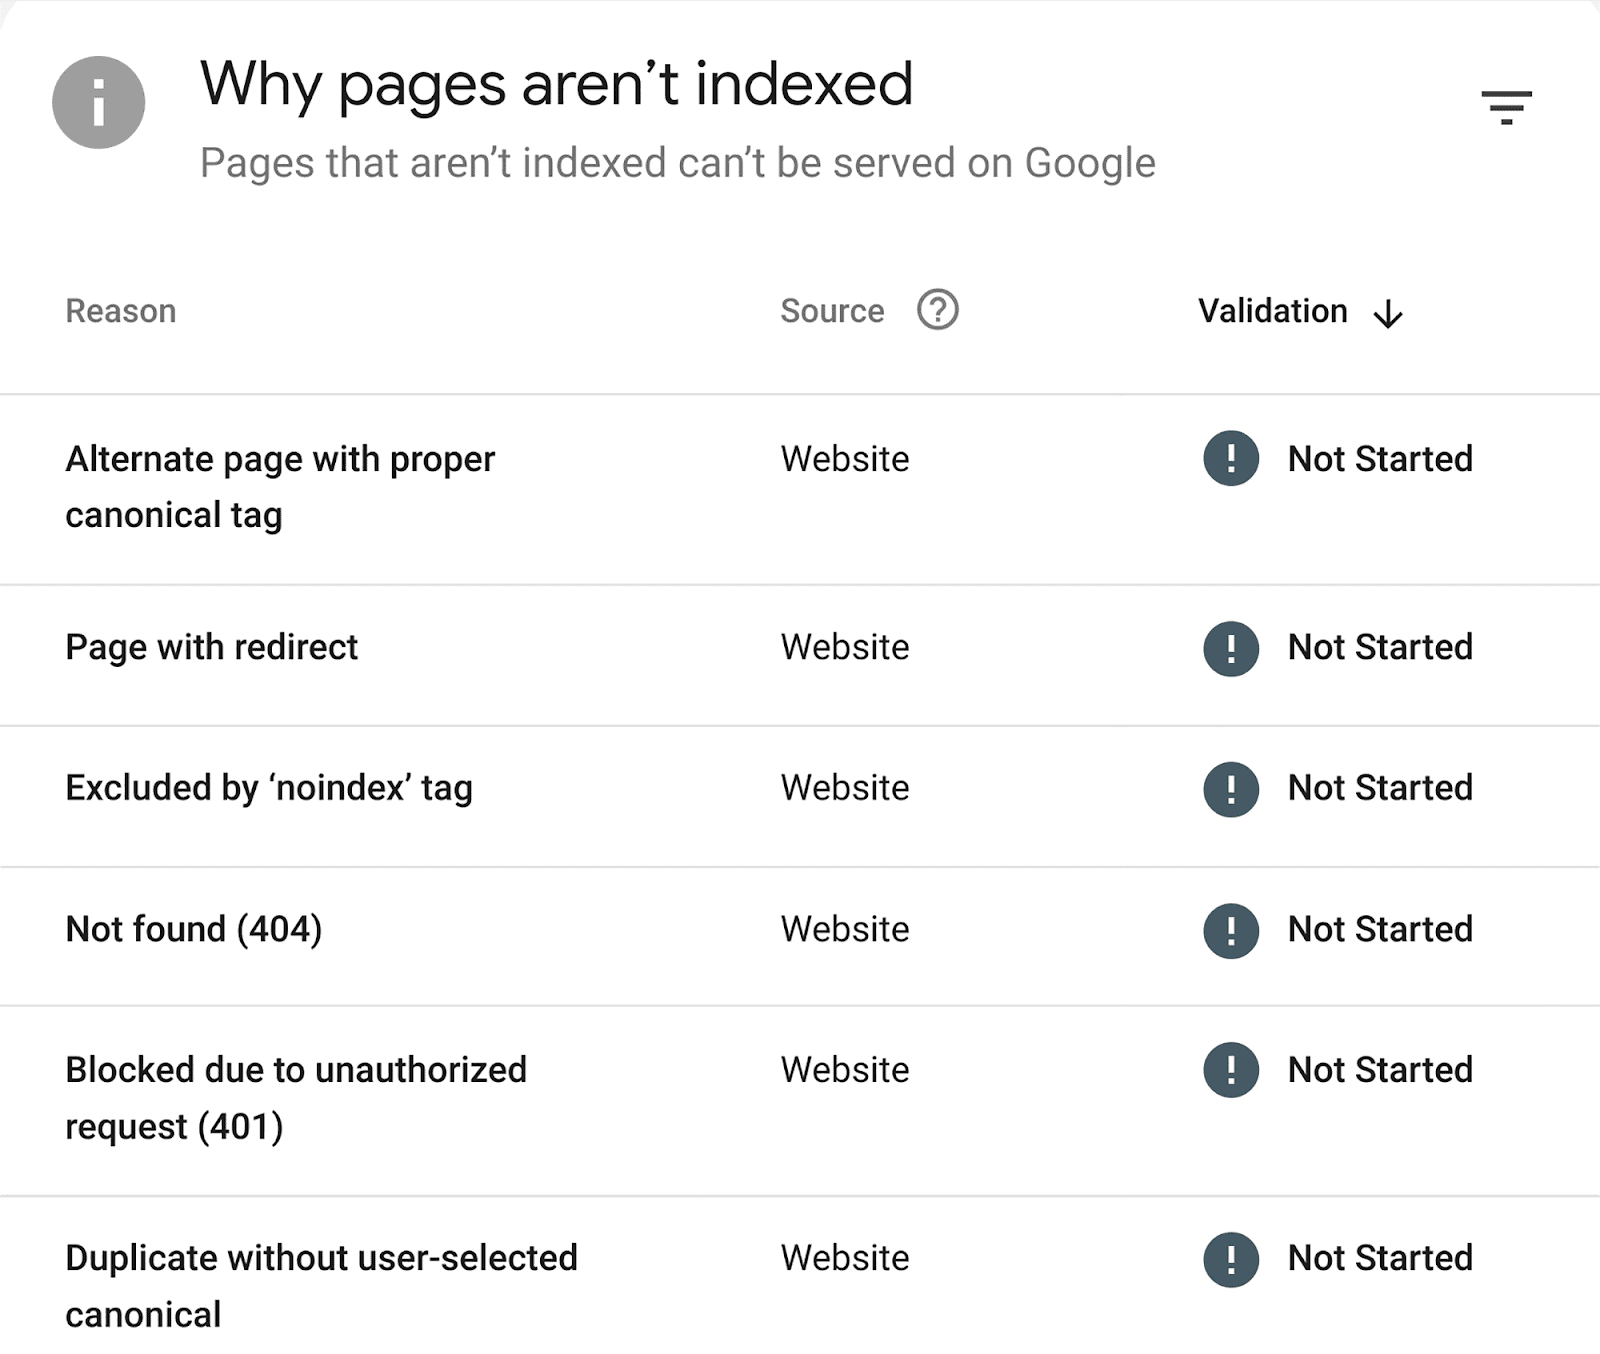
Here, you’ll be able to view all the reasons why your pages aren’t indexed. If you click on one of these reasons, you’ll be able to review all the pages that have been affected by that specific problem.
For example, when I click on the “Not found (404)” reason, I can review all the pages that are currently affected:
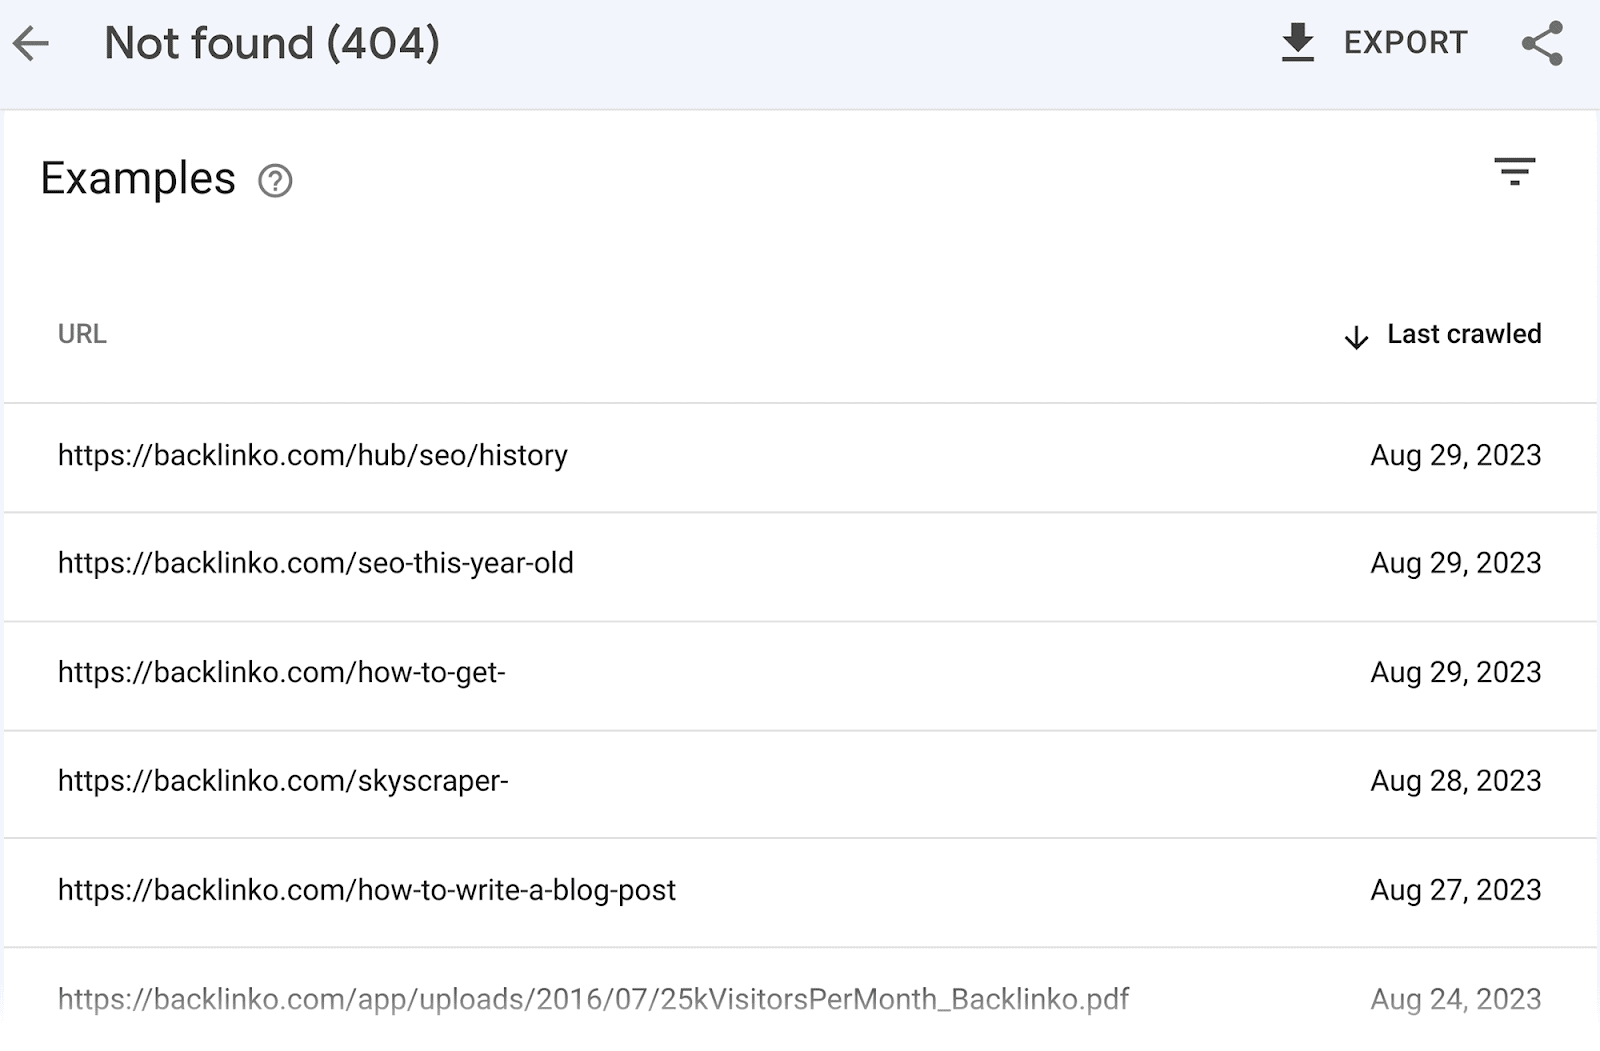
Determining which of your pages aren’t indexed can be confusing and time-consuming.
With GSC, you have all the data at your fingertips. All you have to do is review the findings and fix the problems.
4. Keyword research and analysis
Another vital component of SEO is keyword research. Without knowing what specific keywords to target, how will you ever attract the right audience?
Keyword research involves analyzing the keywords your target audience uses and narrowing down your findings to a list of target keywords.
From these target keywords, you can create content that directly meets the needs of your audience and allows you to compete with your niche rivals.
When conducting keyword research, you have to go through huge bodies of data to determine which keywords to target.
This can be a time-consuming process, especially when you’re trying to figure out which search terms your competitors are ranking for and you’re not.
To make this task easier for you, you can use Semrush’s Keyword Gap tool to automate the process.
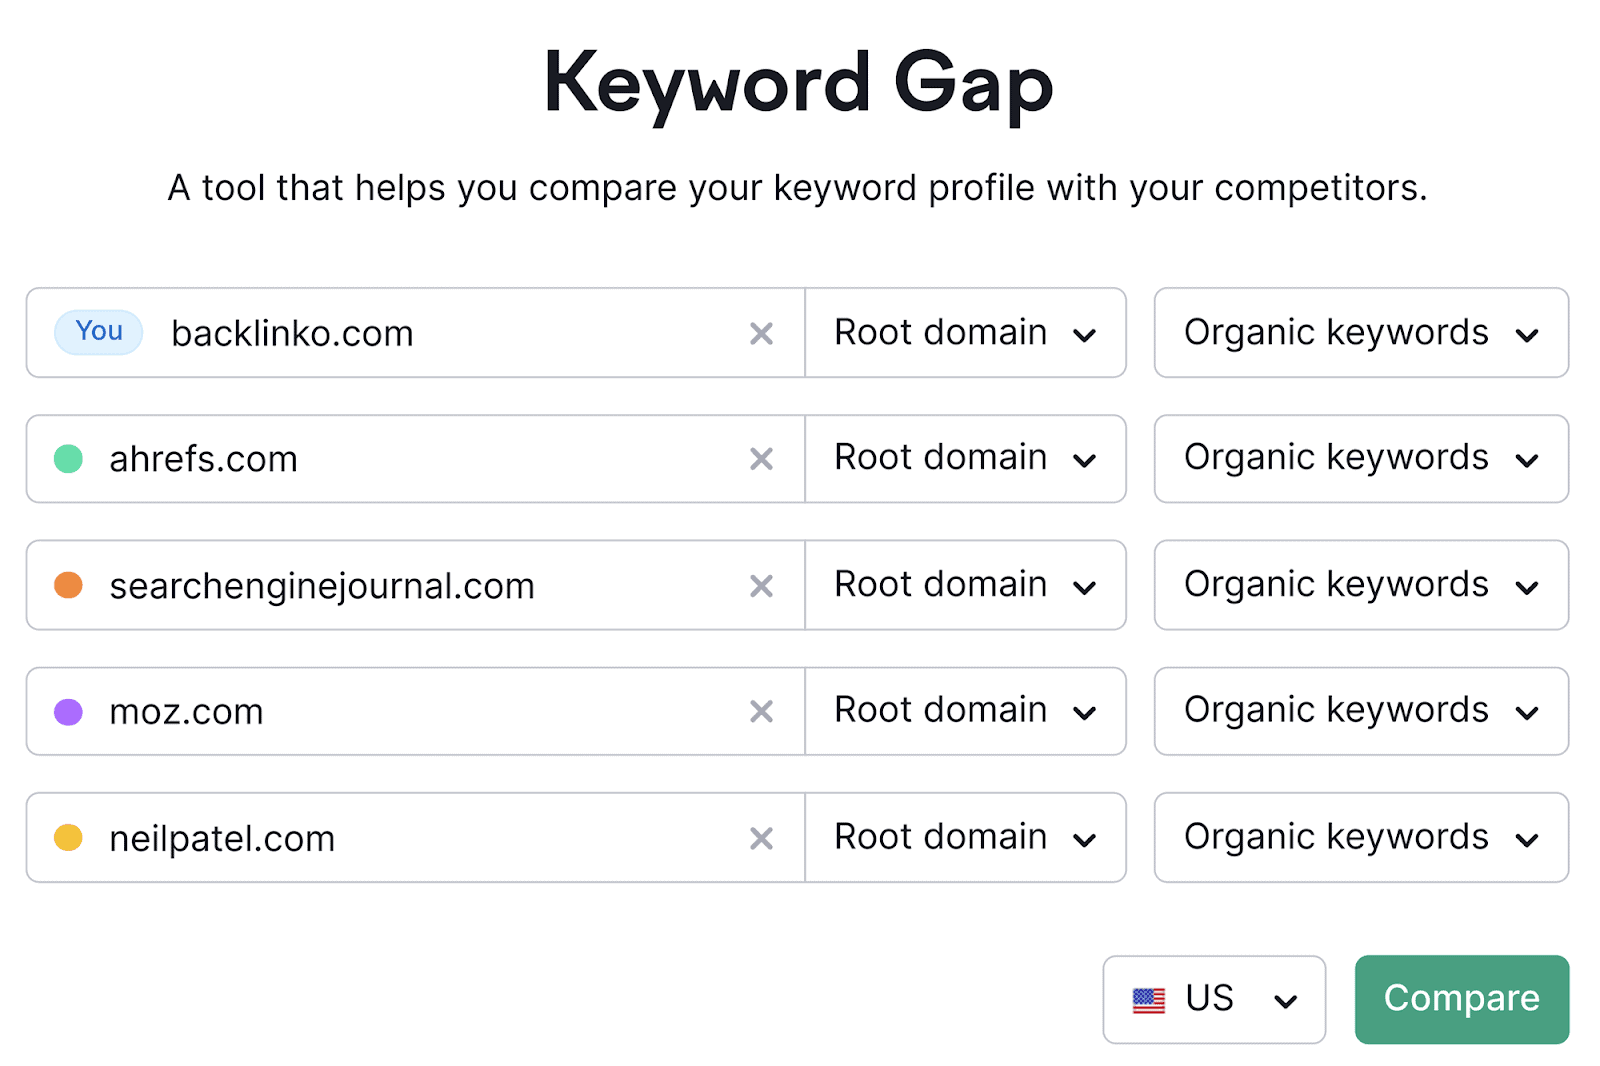
This tool allows you to compare your domain against four of your competitors to identify keyword opportunities you’re missing out on.
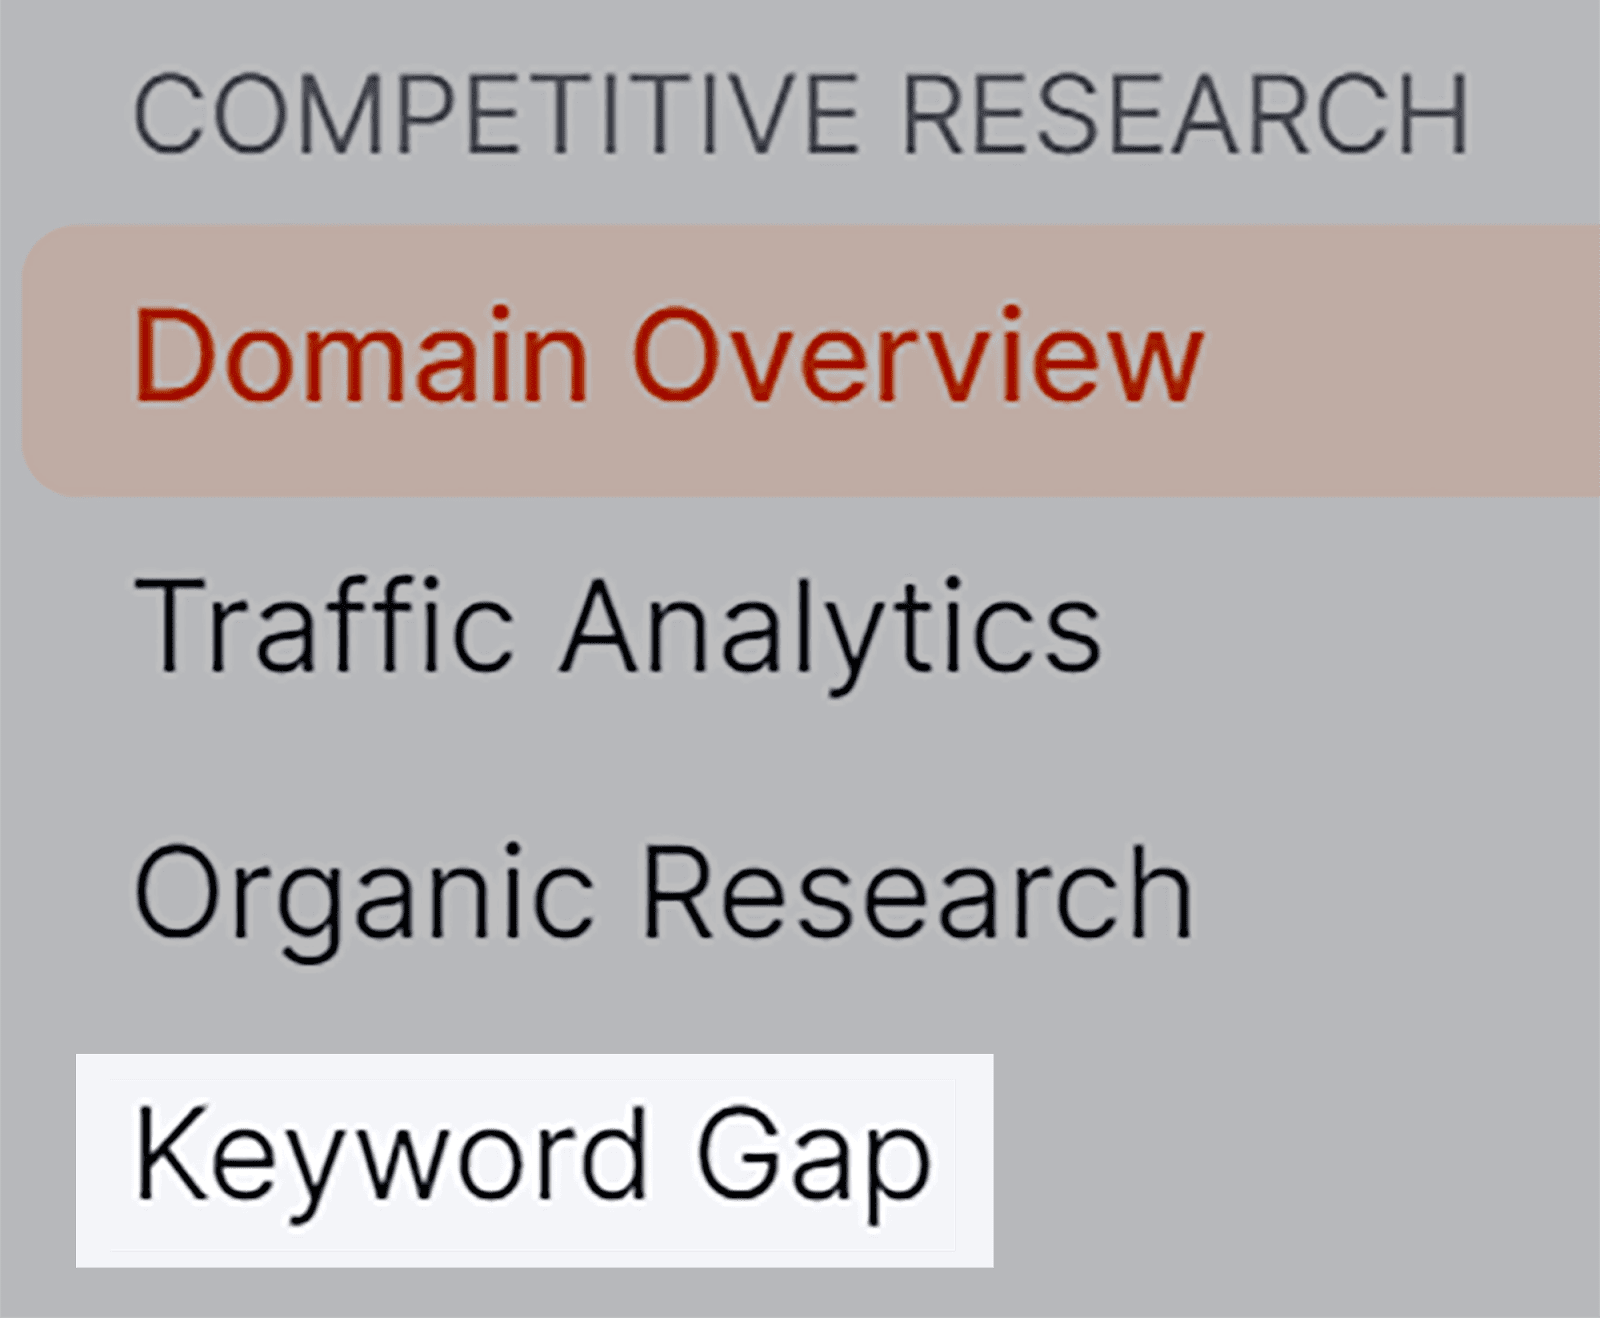
To use this tool, click “Keyword Gap”.
Next, paste your domain and your top competitors in and hit “Compare”.
Then, scroll down to the table section. By default, you will be shown all the keywords that you share with your competitors:
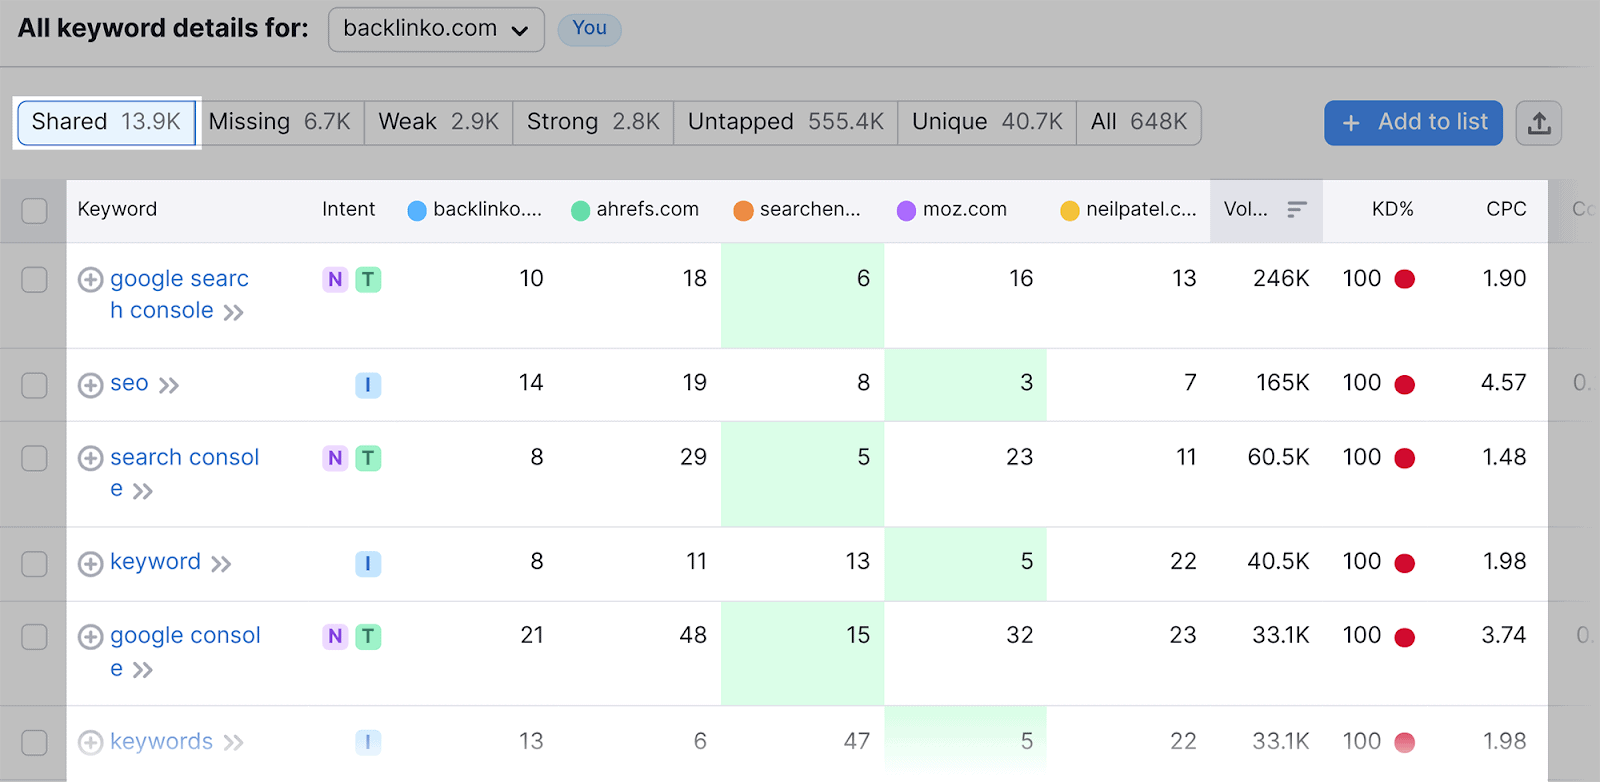
While this data is insightful, I generally pay more attention to the “Missing” and “Untapped” tabs.
“Missing” shows you all the keywords your competitors have on their sites, but you don’t have on yours:
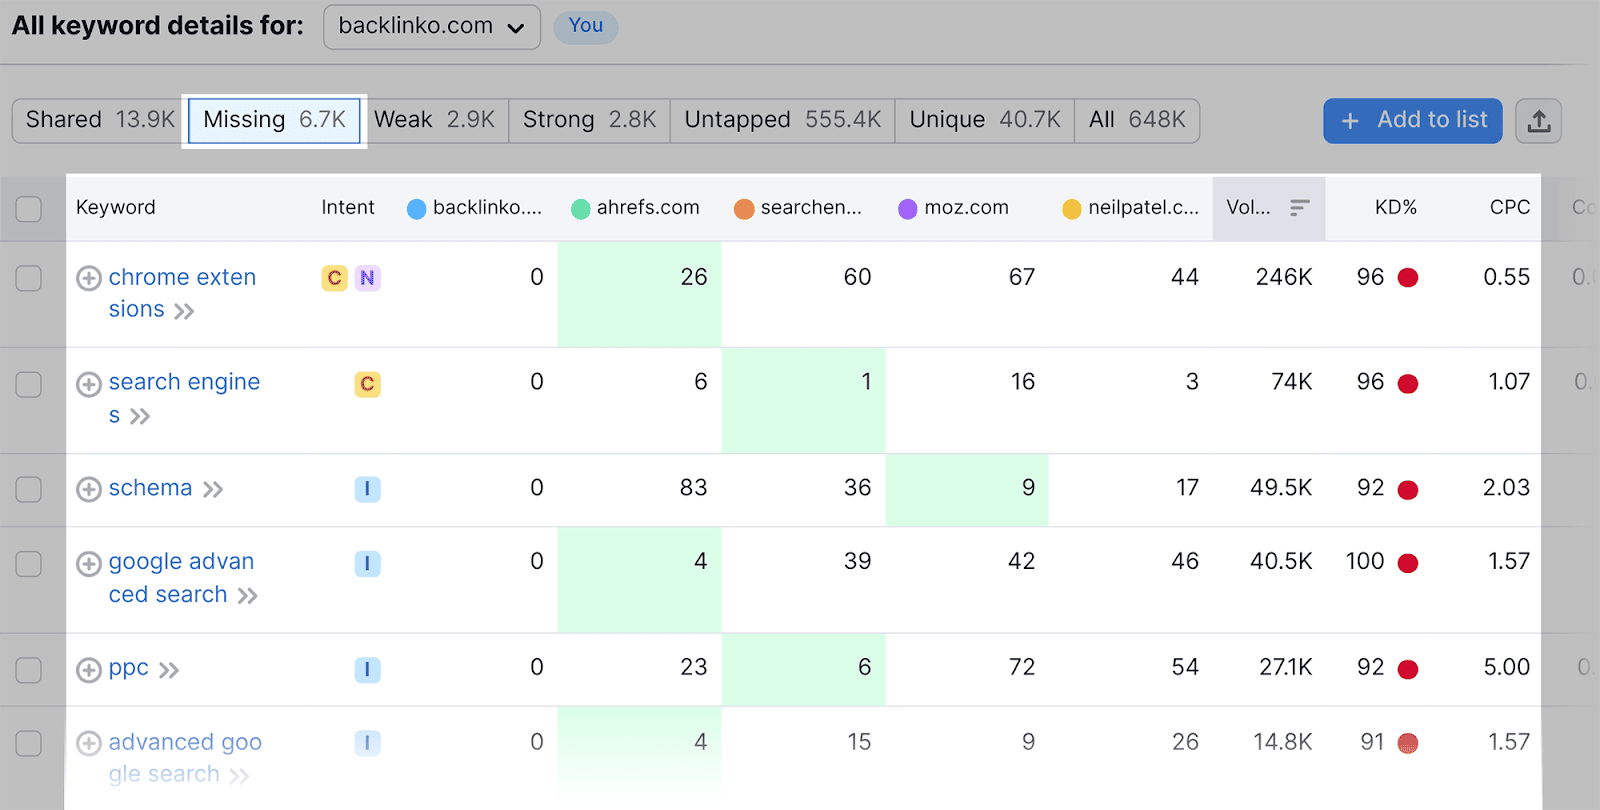
While “Untapped” shows you keywords you don’t rank for but at least one competitor does:
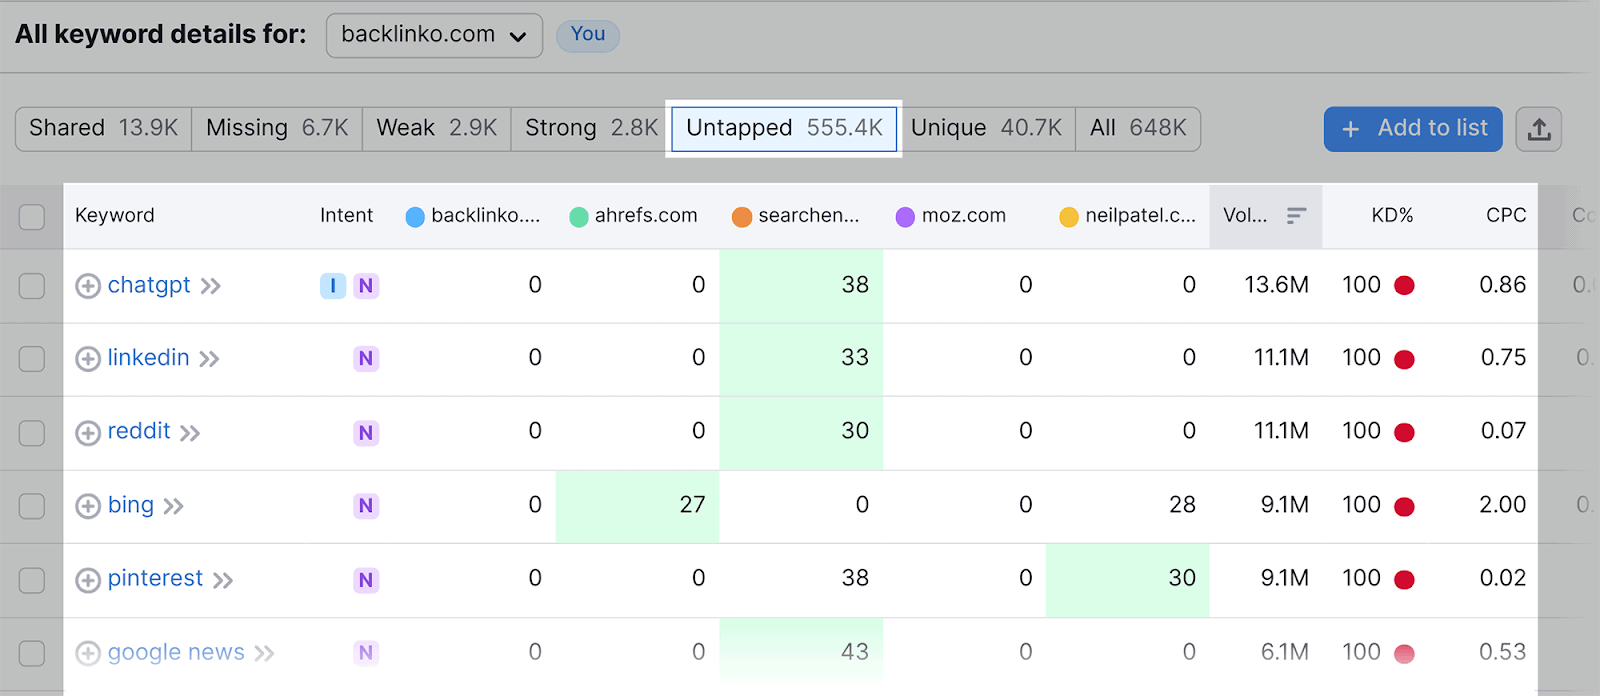
Both of these features are helpful because they allow you to identify gaps in your keyword-targeting strategy.
Rather than digging through your competitors’ articles to find keywords you’re missing, you can use the Keyword Gap tool to identify these search terms for you. This will save you a ton of time.
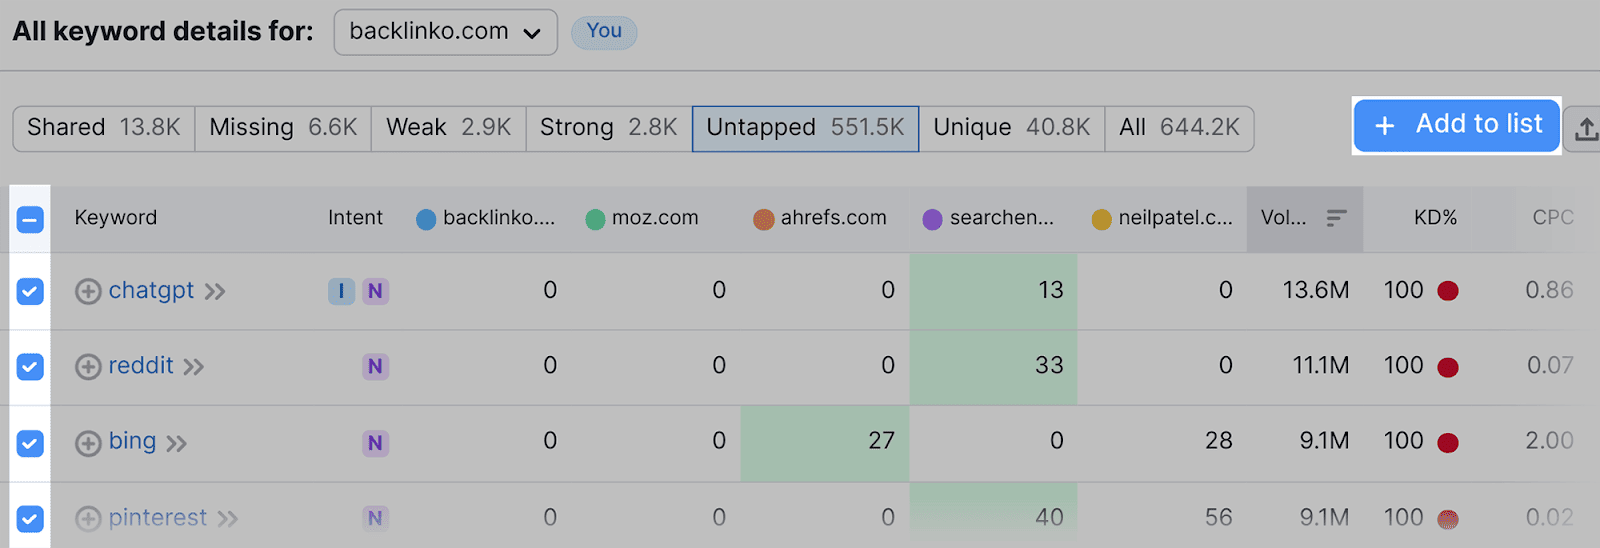
If you come across any keywords that you like, you can store them in the Keyword Manager tool by creating a keyword list.
Simply tick the box on the left-hand side and click “+ Add to list” at the top right-hand side:
Now, let’s talk about how Semrush’s Keyword Magic Tool can help you further automate your keyword research.
Let’s say you’ve recently acquired a new website and would like to launch a successful SEO campaign. You’ve got a rough list of seed keywords, but don’t know which other keywords to use in order to get your content ranking.
Instead of manually compiling keyword lists, you can use the Keyword Magic tool to not only provide you with keyword ideas, but also provide you with some automated analysis for each.
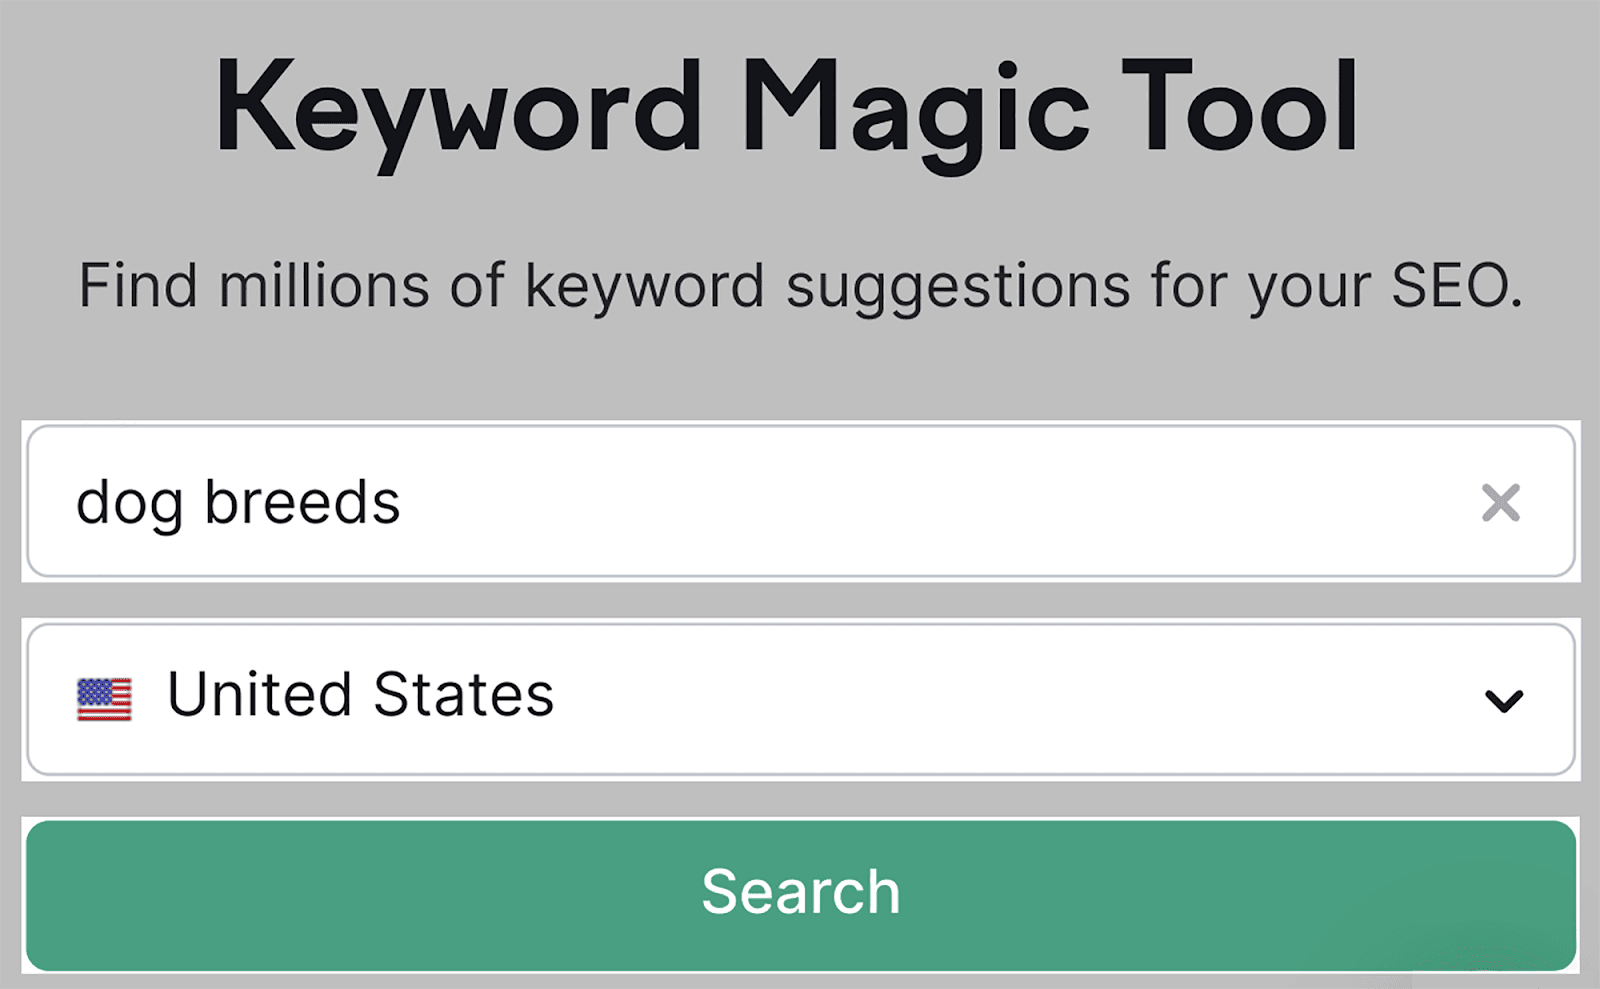
For example, let’s say you’re trying to optimize a website about breeds, and one of your seed keywords is “ breeds”.
You can enter this seed keyword into the Keyword Magic Tool, as shown here:
After you hit “Search”, you’ll be presented with a list of keywords:
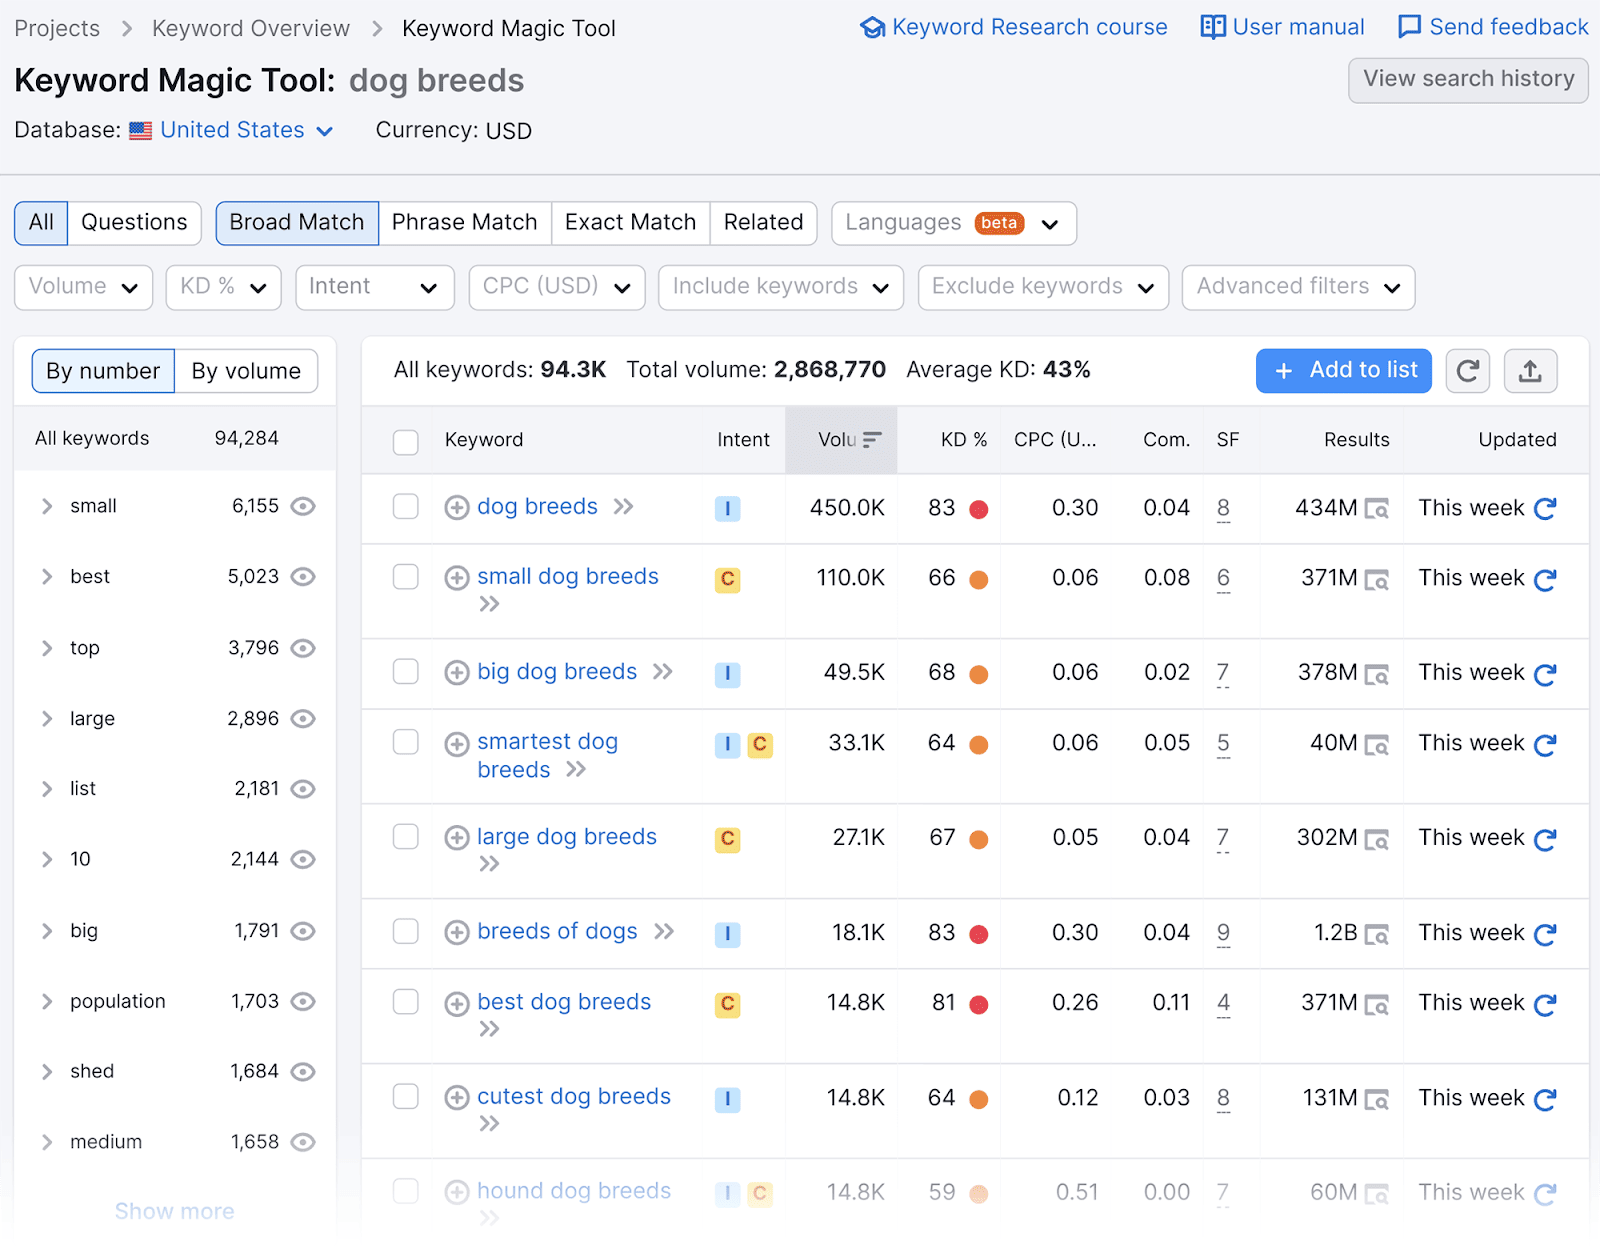
You can also see the monthly search volume, keyword difficulty, and search intent for each keyword.
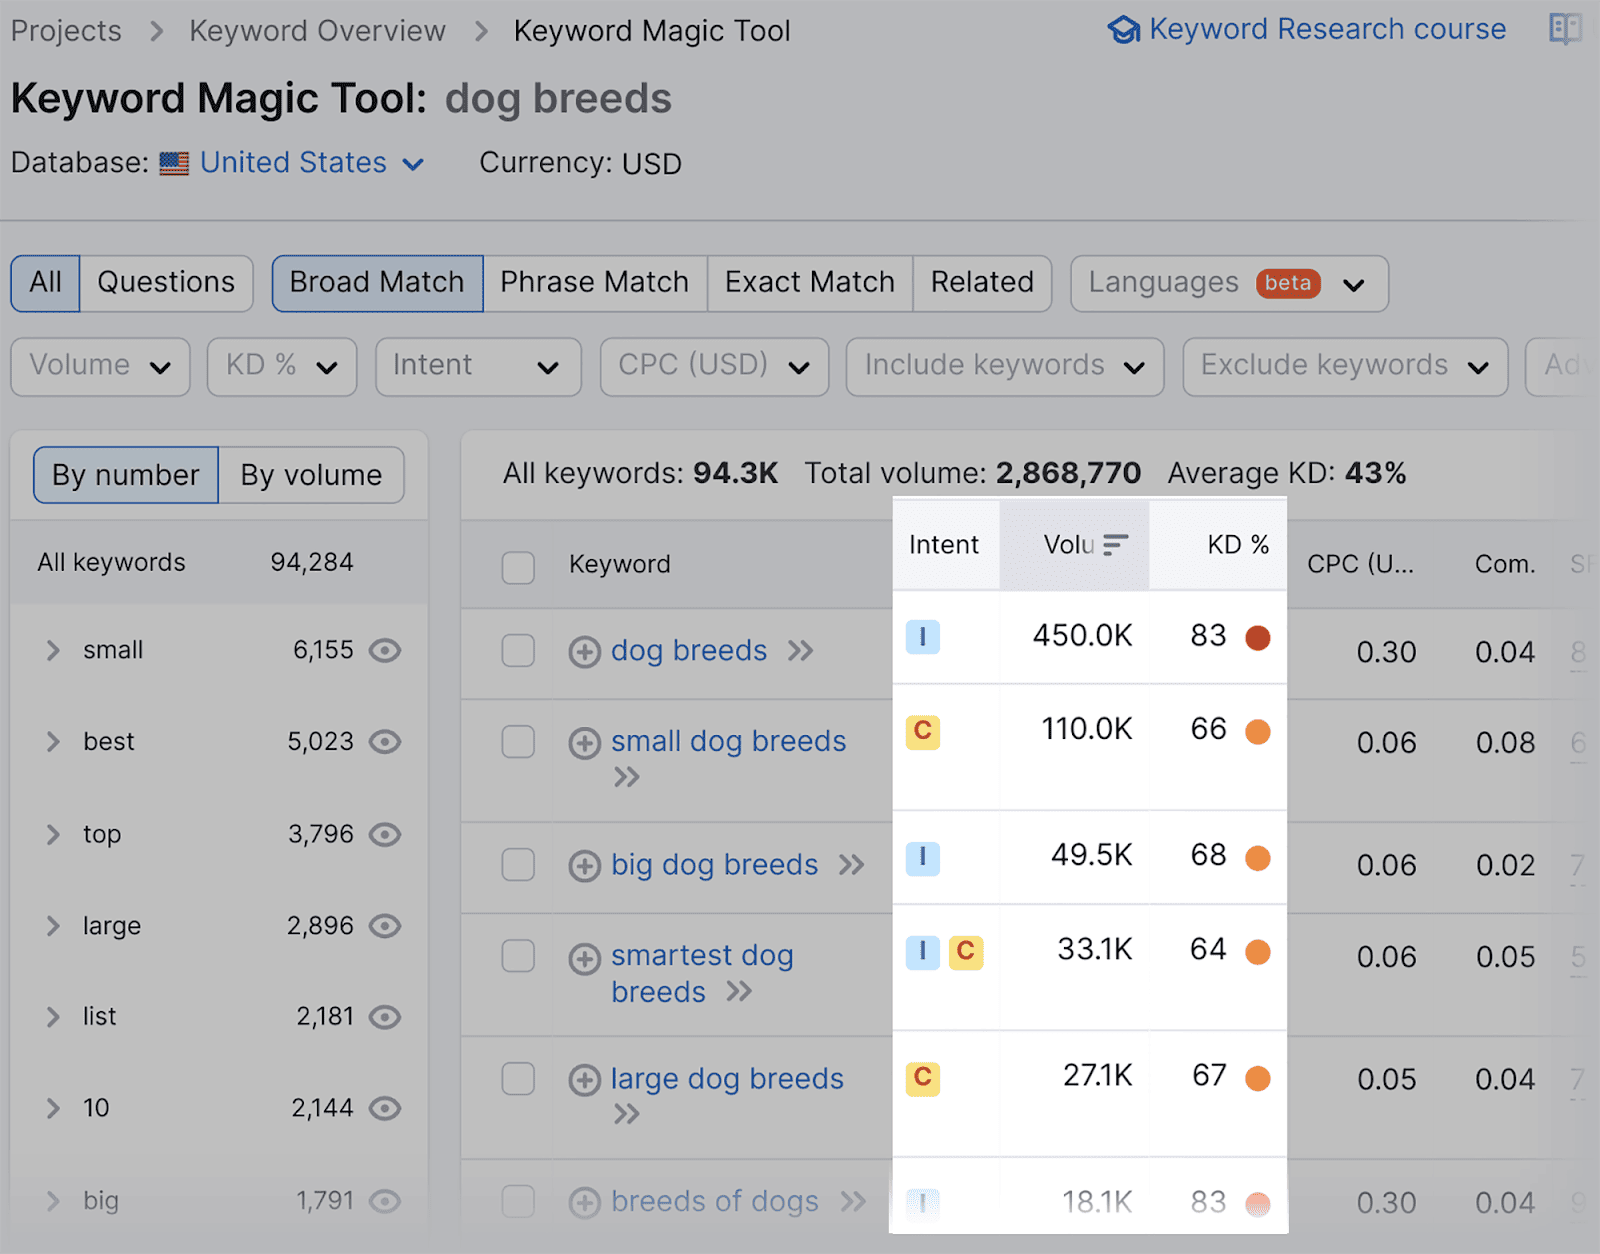
“KD %” reflects how difficult it would be to rank for the keyword.
So, ideally, you’d want to target keywords with a high search volume and low KD score.
Intent refers to the user intent associated with a particular keyword. It helps you understand the reason or purpose behind a user’s search when they enter that specific keyword into a search engine.
You can also use the filter options to further refine your list of keywords.
For example, you can use the KD % filter to find keywords that are “Easy” to rank for:
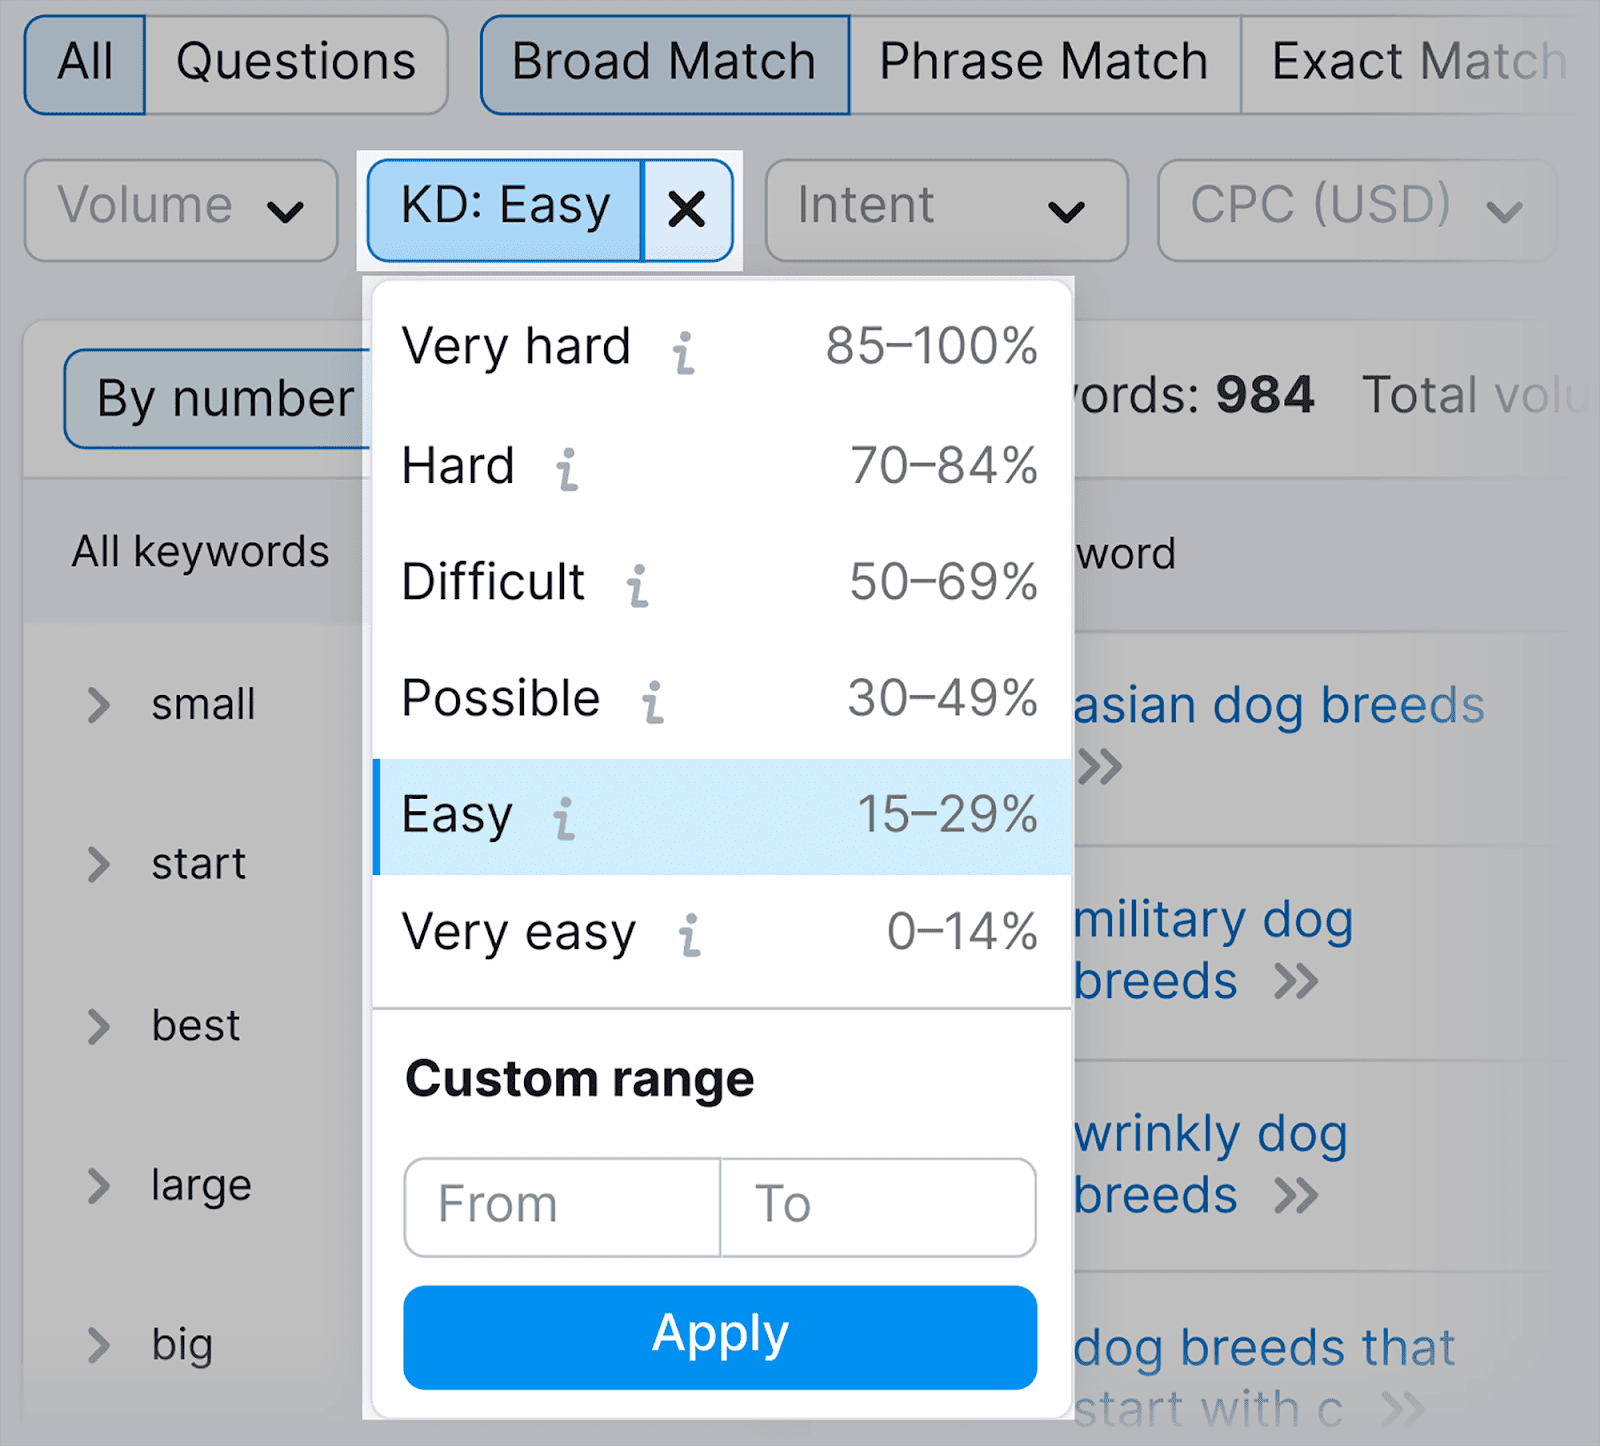
After you click “Apply”, the tool will present you with a refined list of keywords that match your settings:
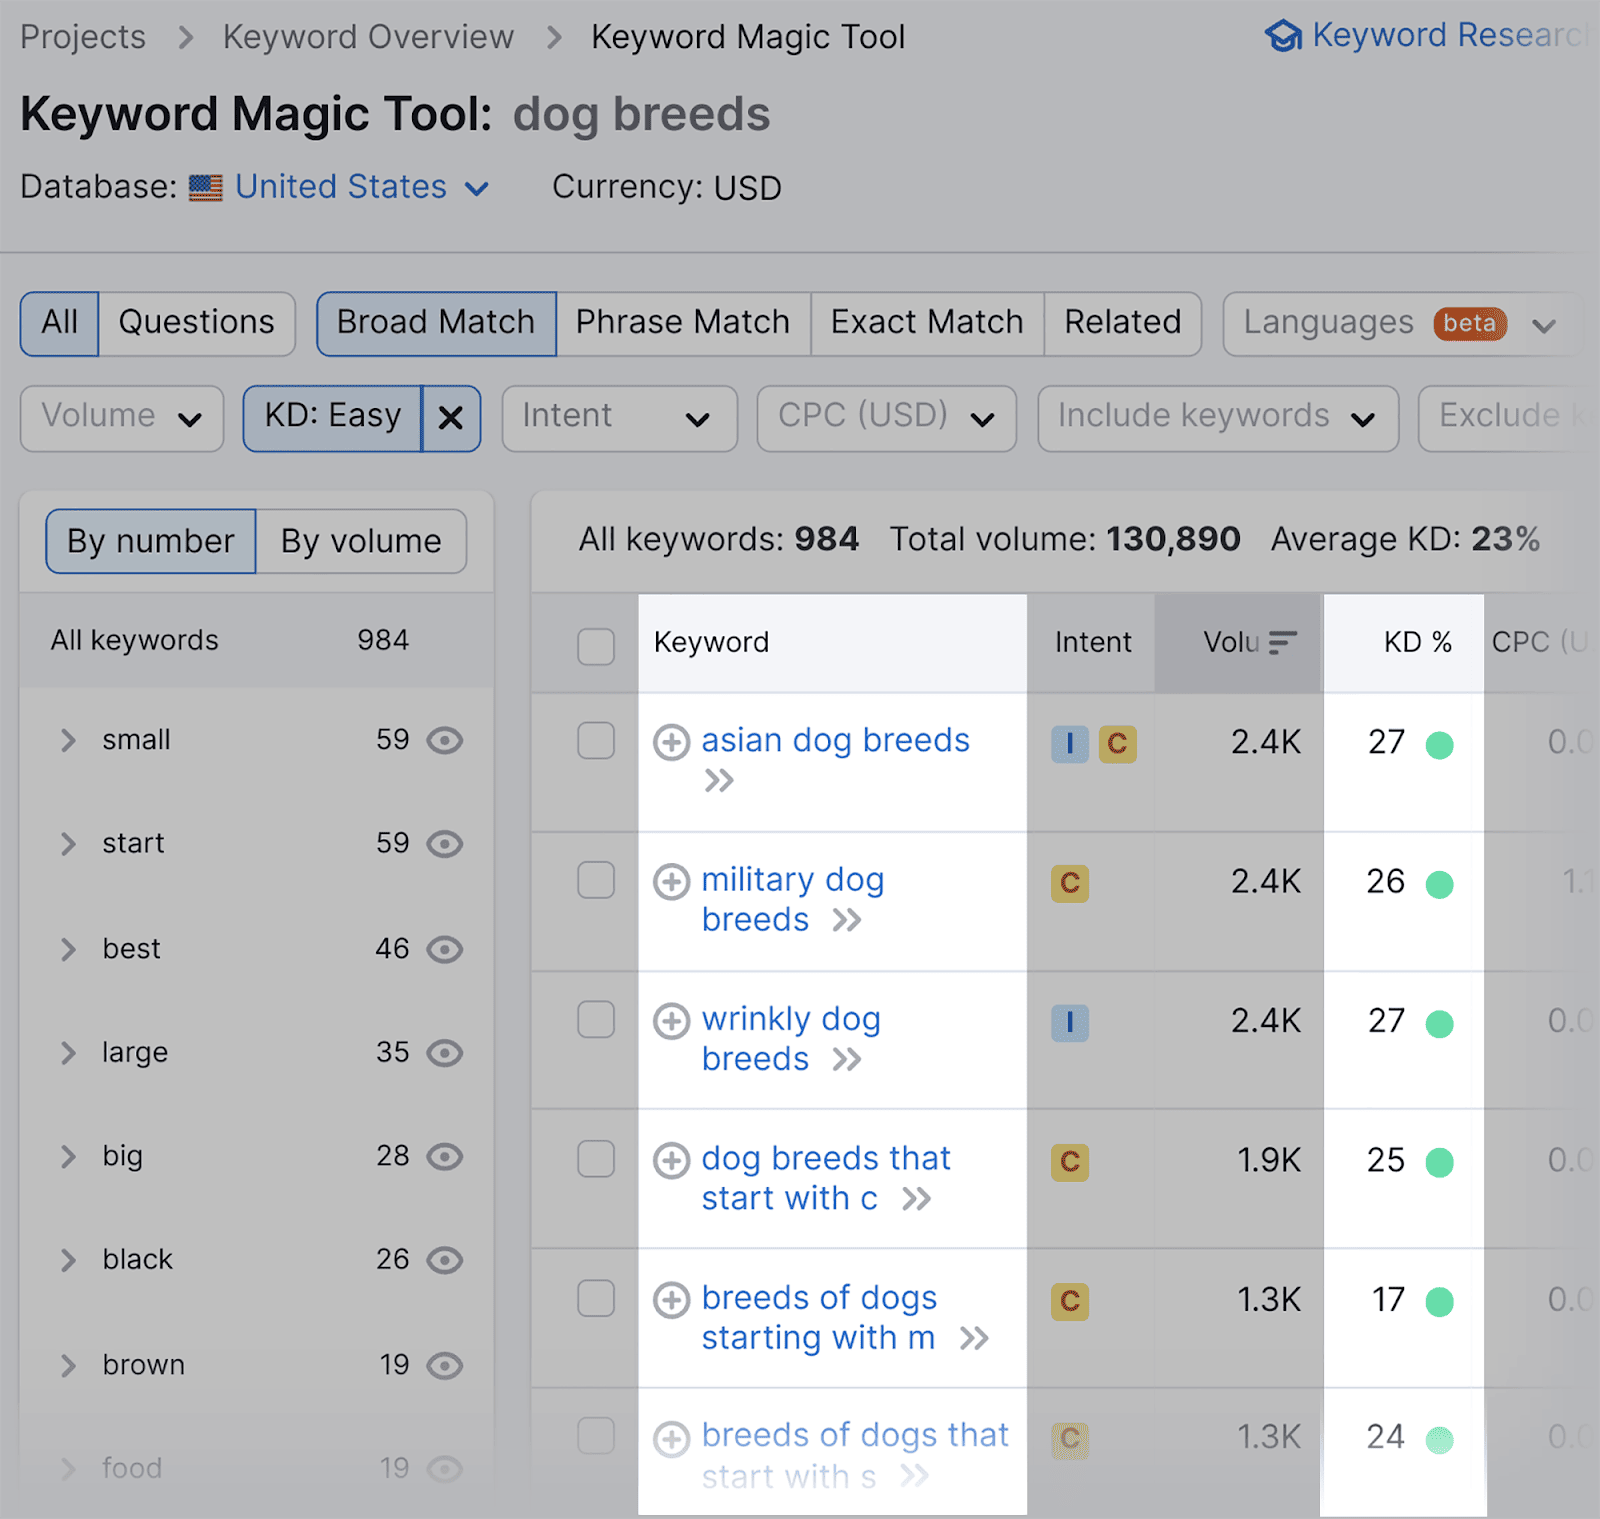
As default, the keywords above are arranged in order of search volume. So, the two options at the top:
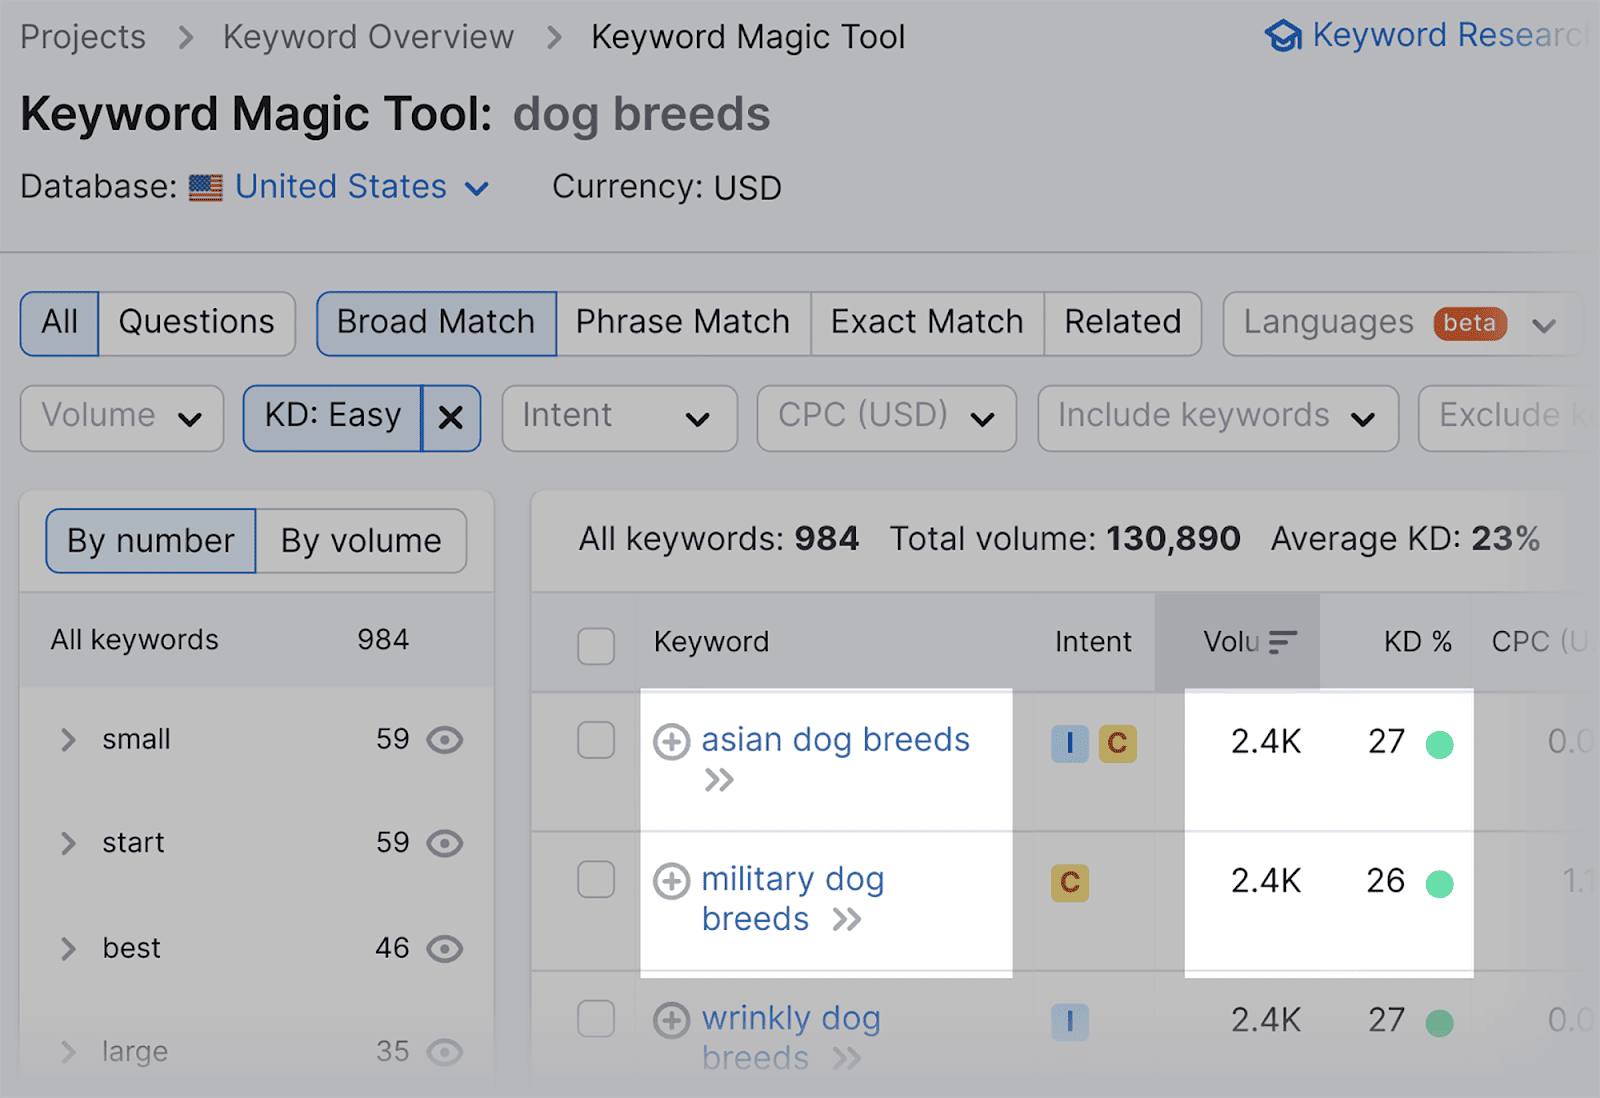
…have a very high search volume of 2.4K each, but a relatively low keyword difficulty score of 27% and 26% respectively.
Given these low scores, it would definitely be worth targeting these keywords.
5. Create keyword clusters
Keyword clustering involves grouping a list of keywords that are related to your main target keywords. These clusters can consist of synonyms as well as semantically related words.
For example, if your primary keyword is “search engine optimization”, some related keywords could include “SEO keywords”, “backlinks”, and “internal links”.
You can use Semrush’s Keyword Manager tool to create keyword clusters related to your seed keyword. The tool will provide you with a list of related terms and synonyms you can use in your content.
Here’s how to use this tool: Head over to Keyword Manager…
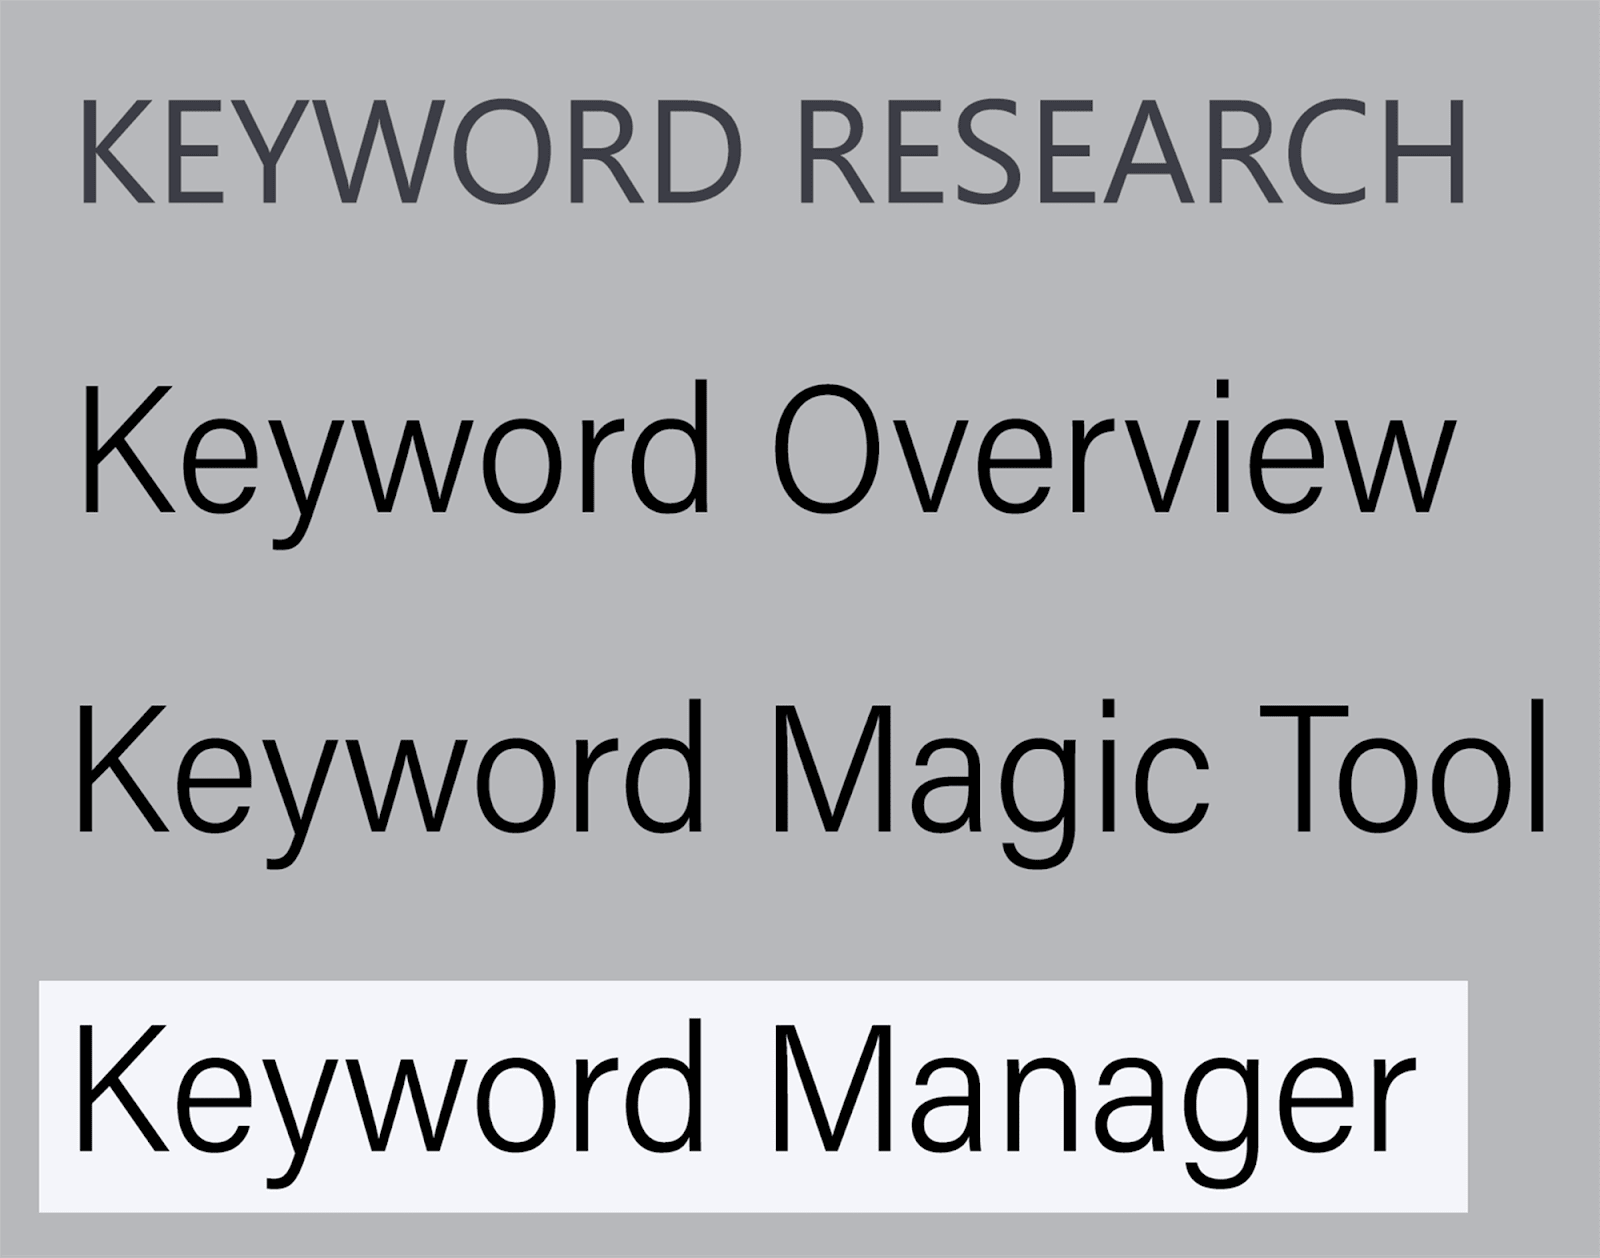
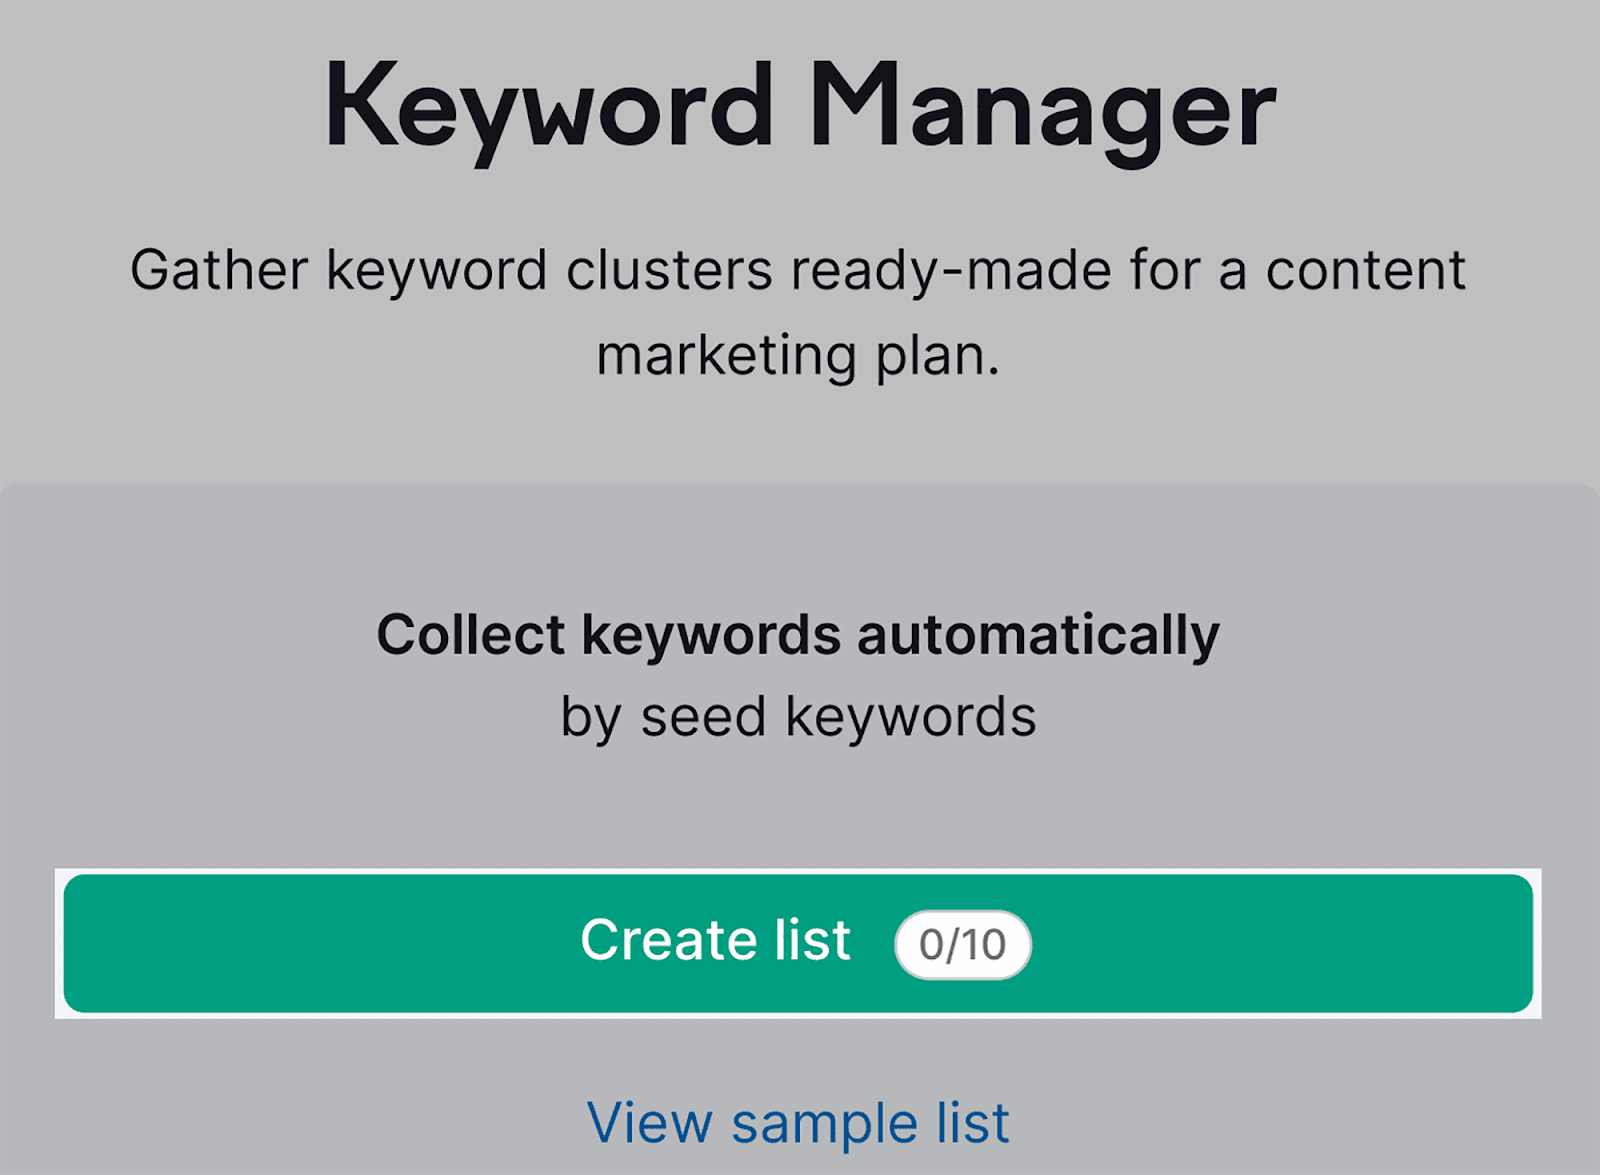
…and hit “Create list”:
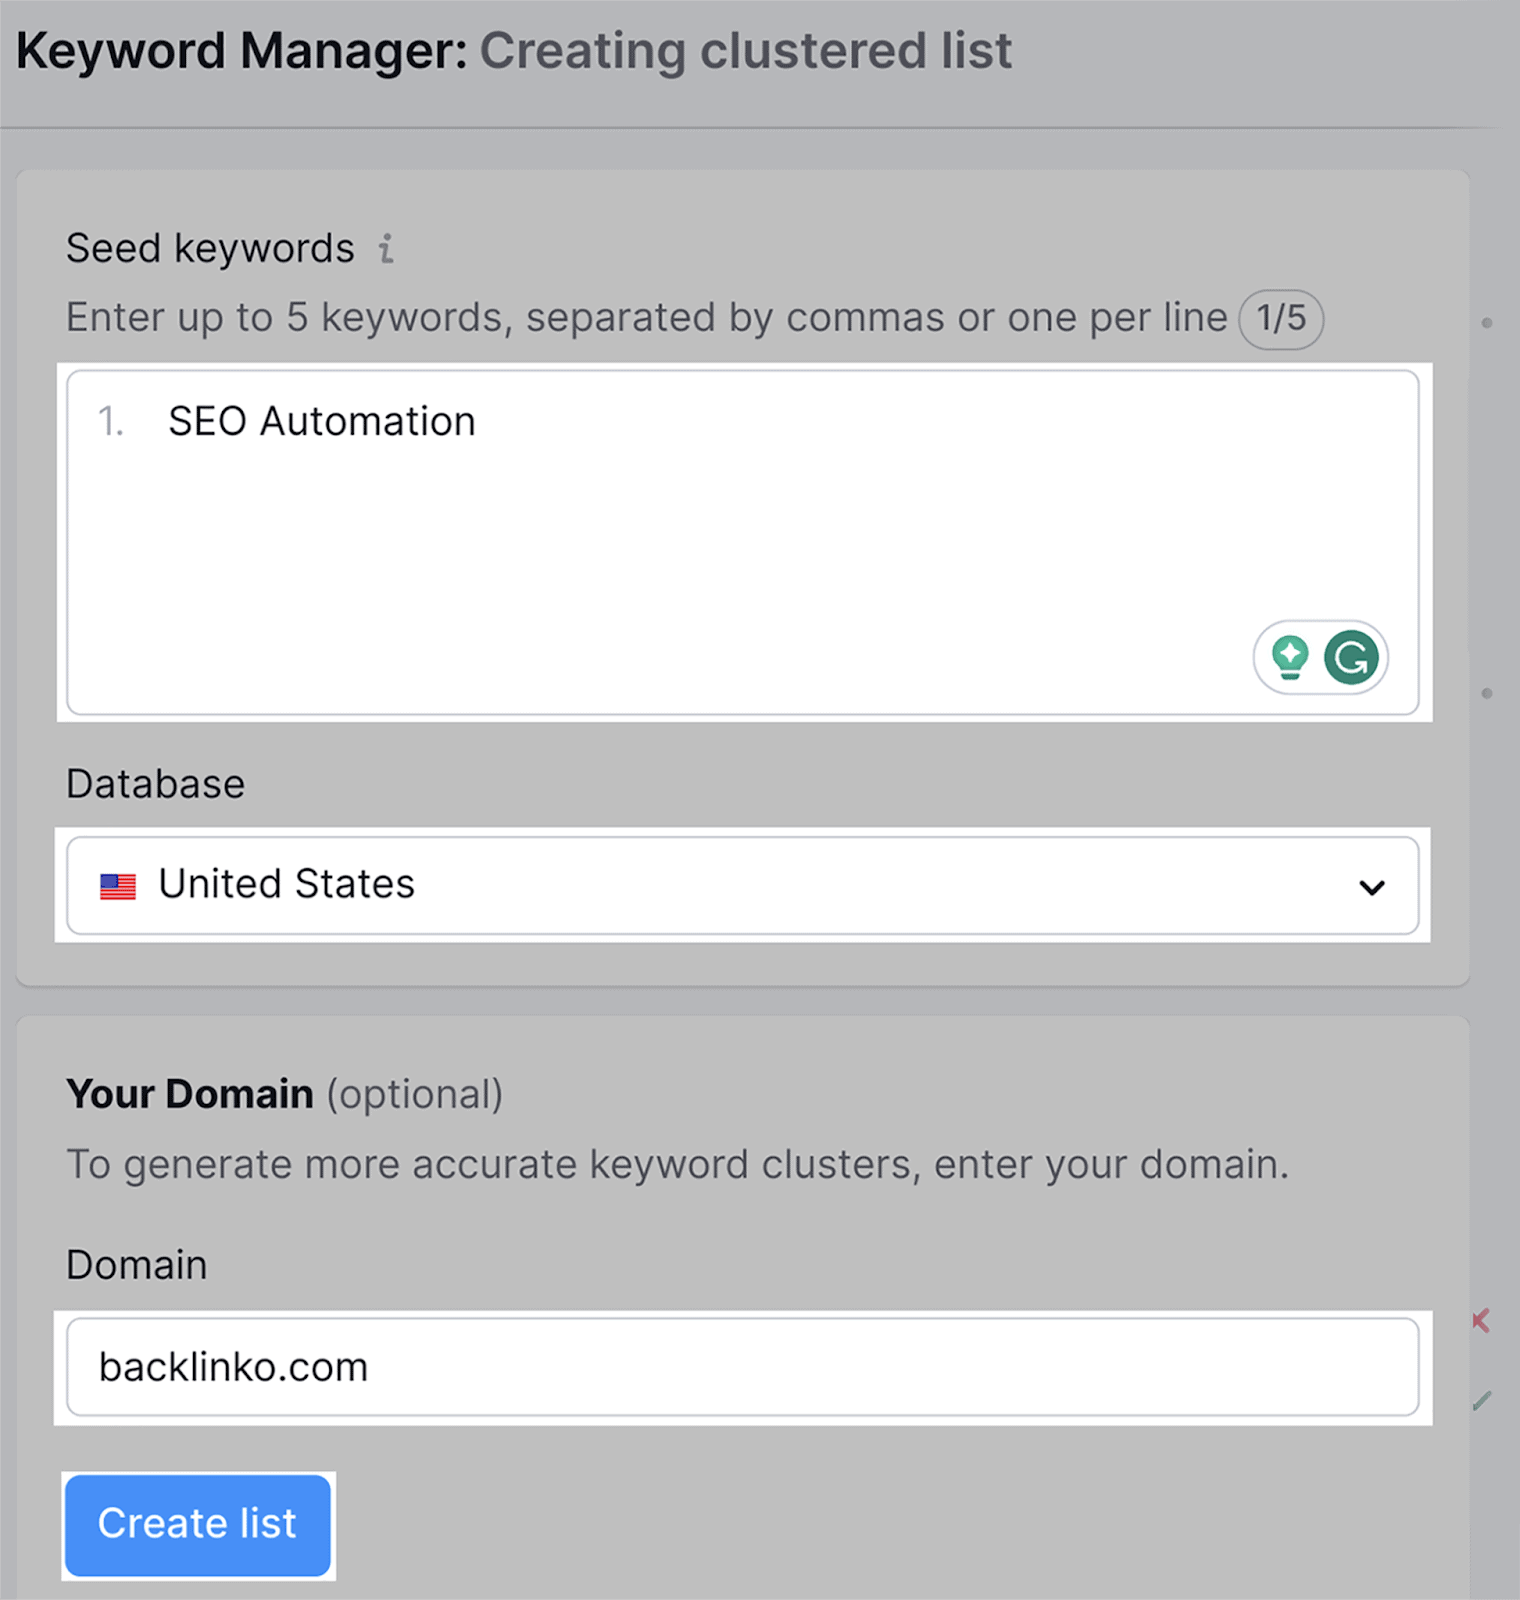
Then, type in your seed keyword, select a database, and type in your domain:
After you hit “Create list”, Semrush will take a few seconds to generate your keyword clusters:
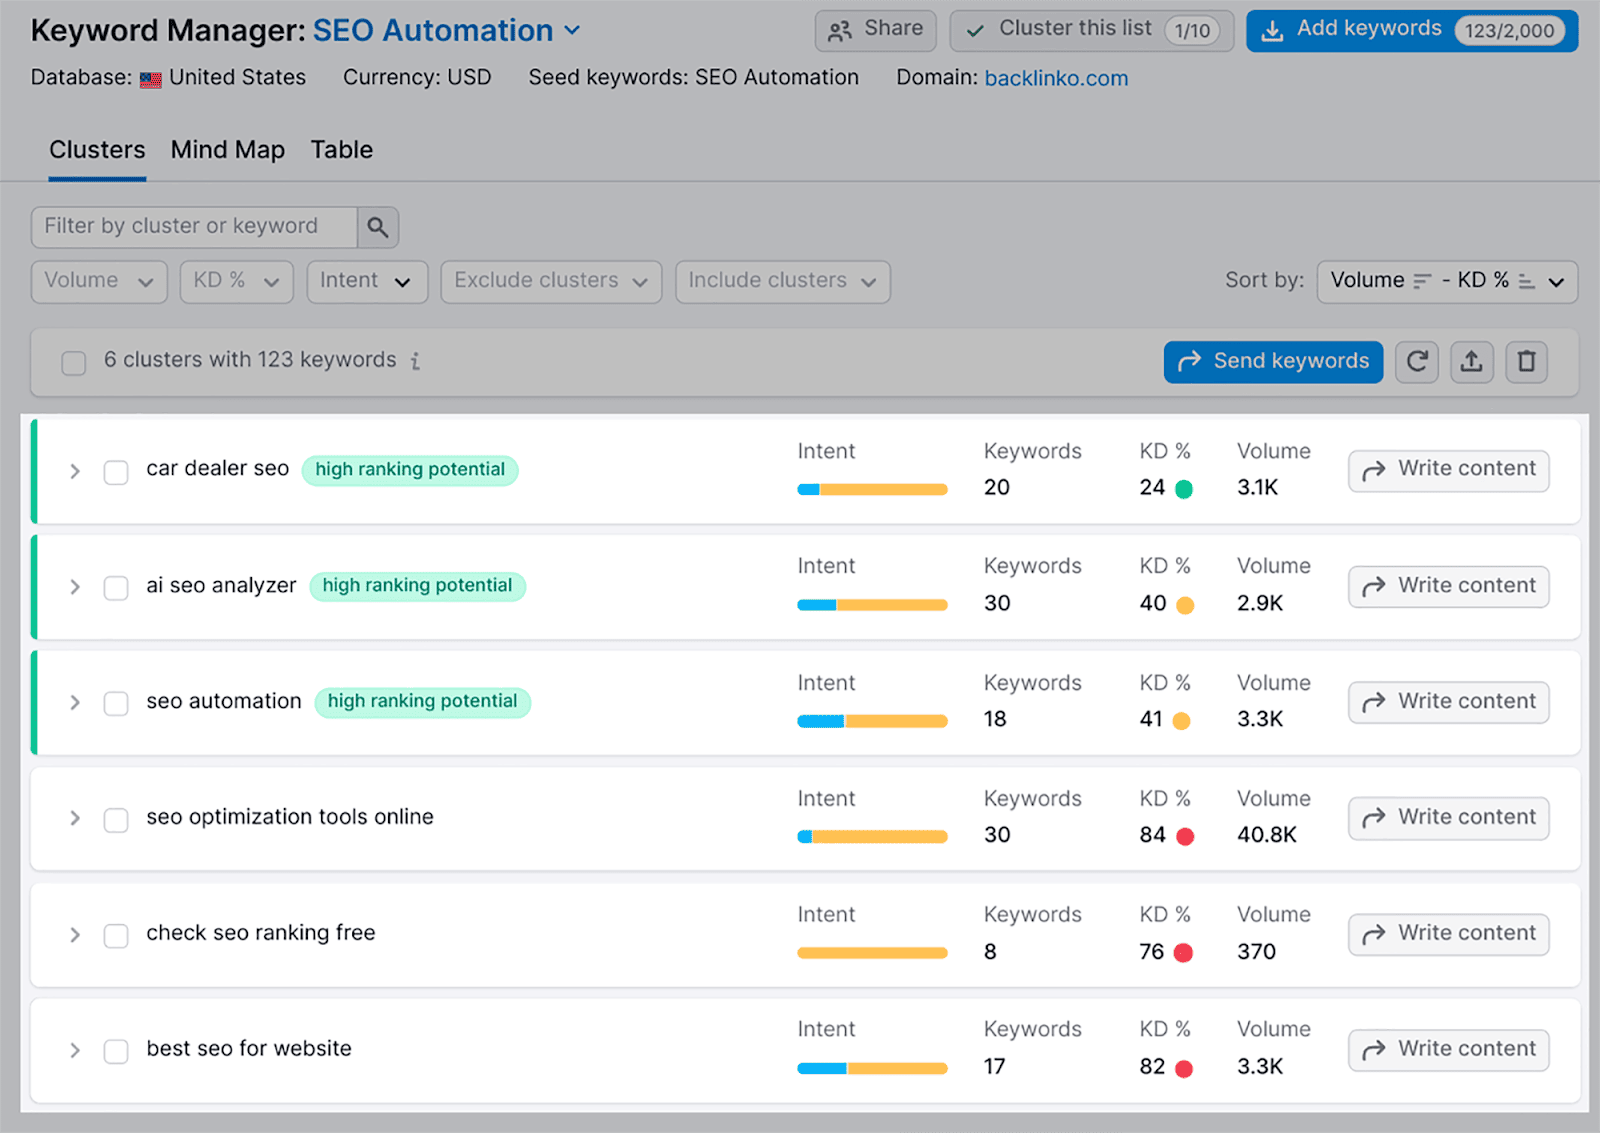
If you click on one of the clusters, you’ll be able to review an ordered list of related keywords and synonyms.
You can also analyze useful information such as the search intent, keyword difficulty and search volume of the keywords in the cluster.
For example, here’s what I get when I click on the “SEO automation” keyword cluster:
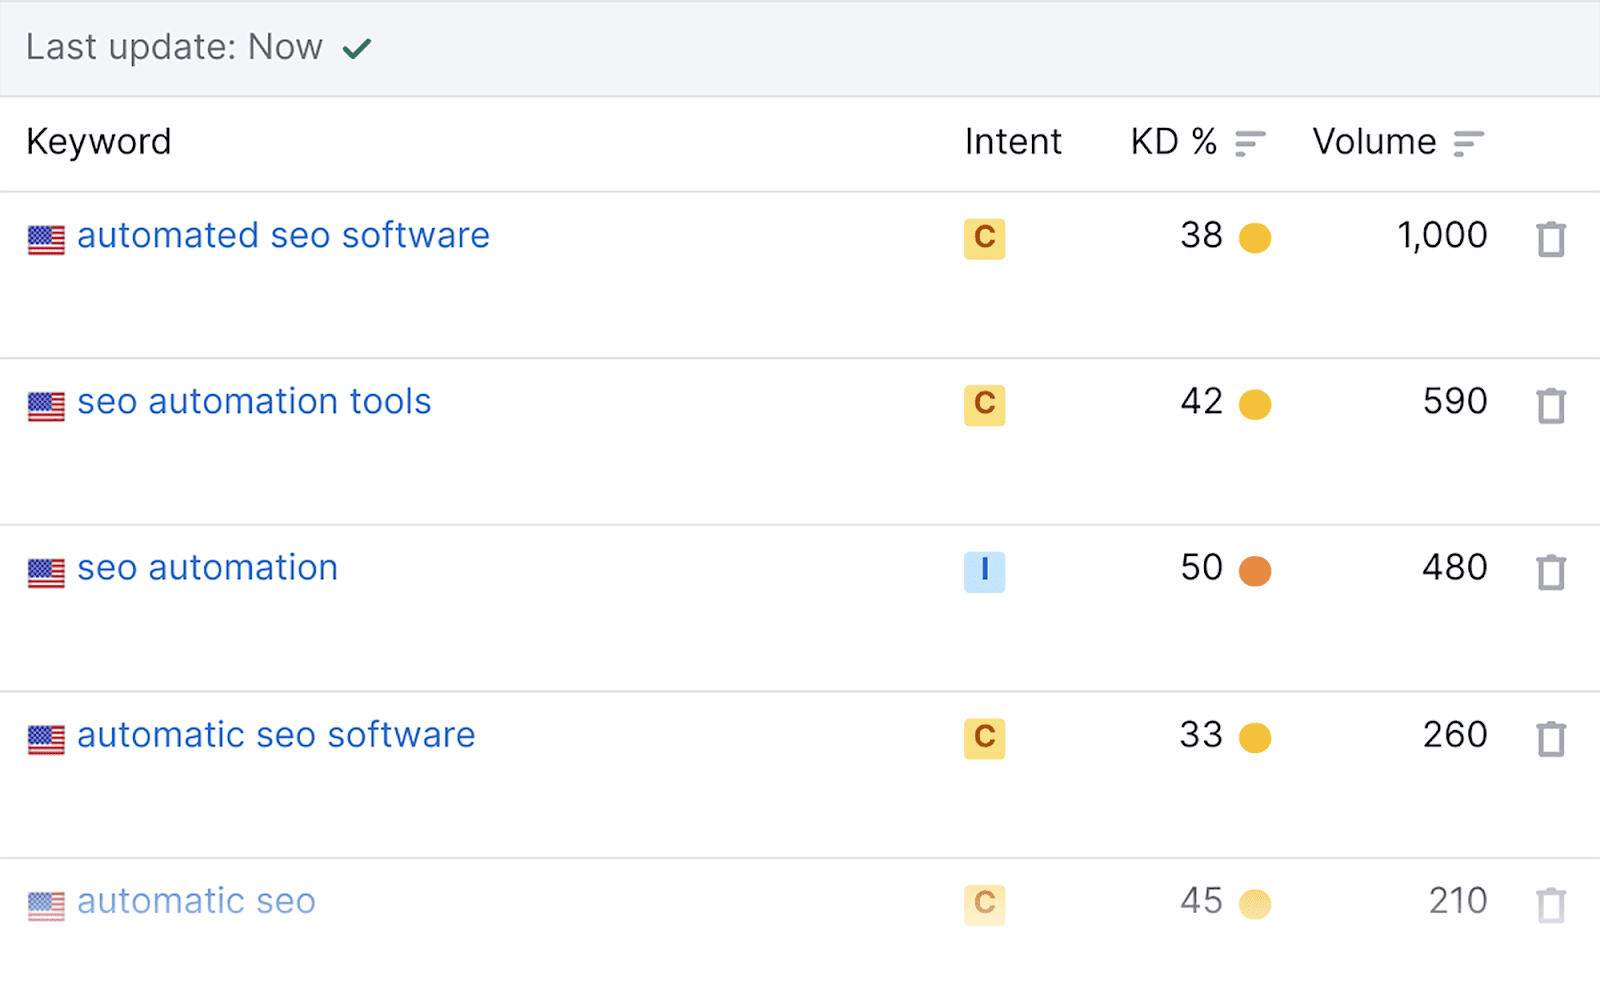
I now have more related keywords and synonyms to use in my article.
You can also expand your keyword clusters by adding related search terms you can find using Semrush’s Keyword Magic tool:
Paste a seed keyword into the Keyword Magic tool search bar, for example, “SEO”:
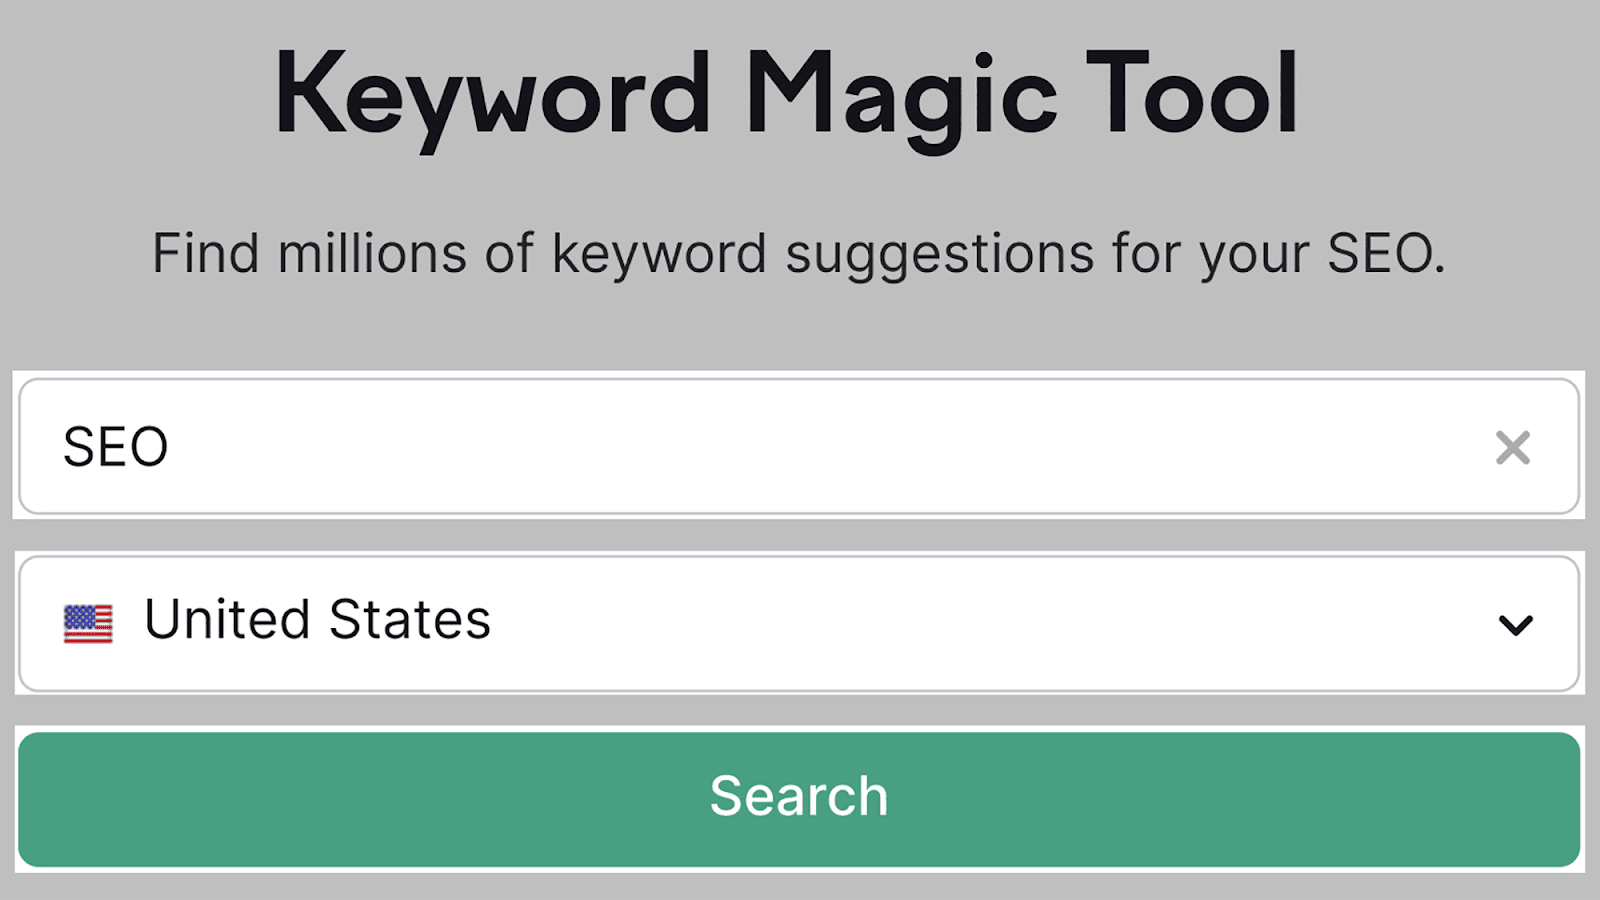
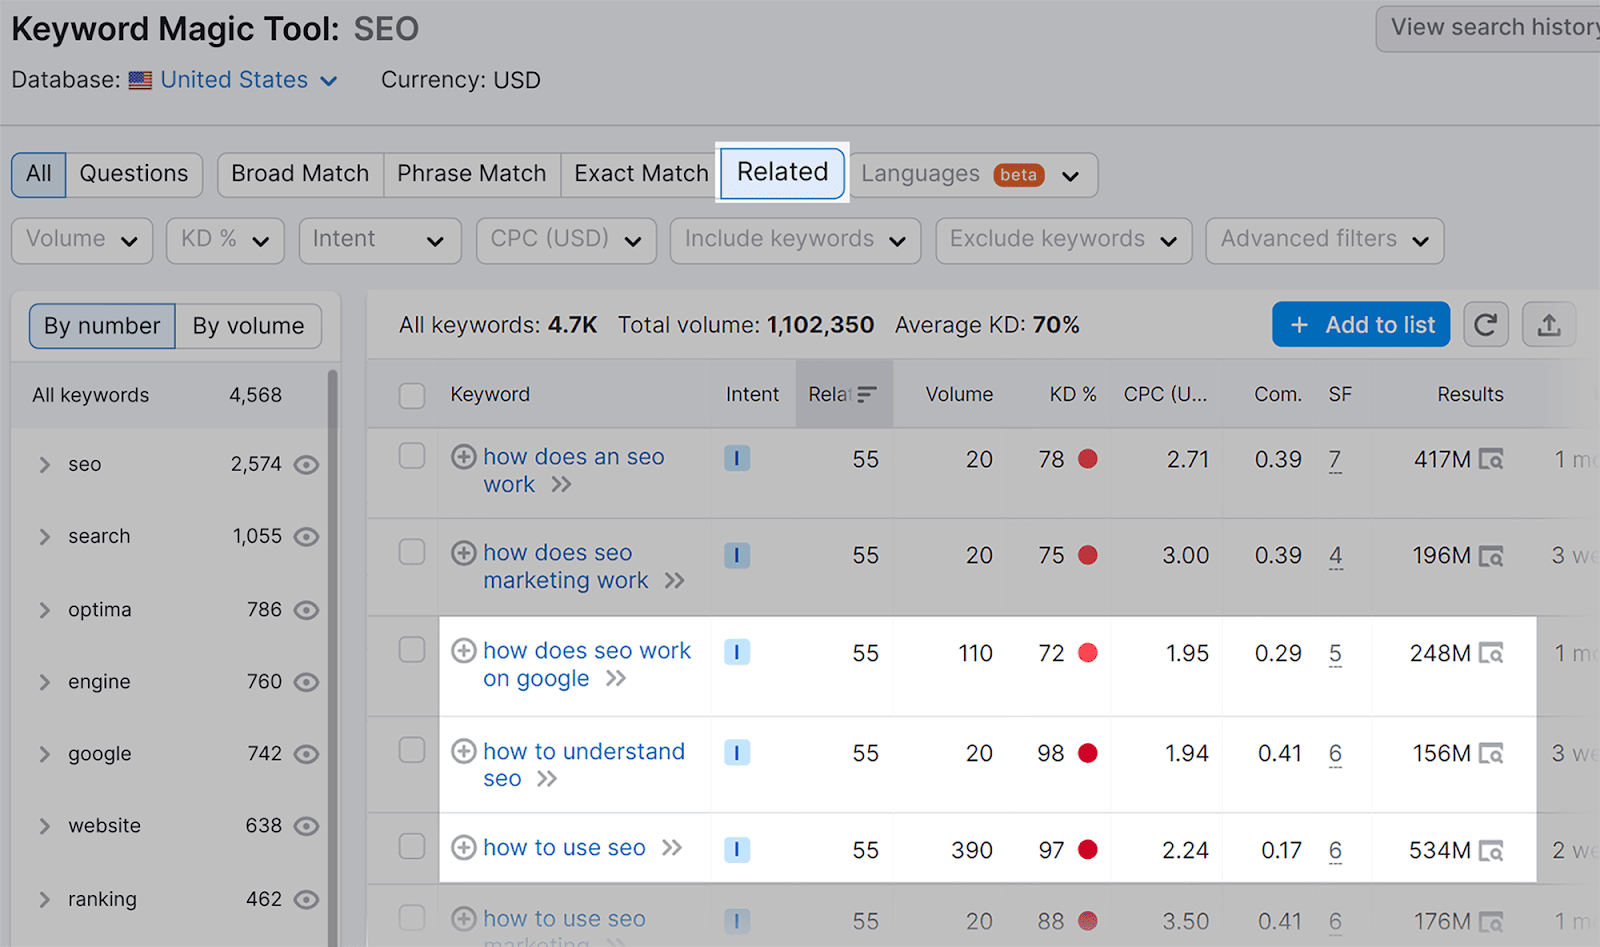
After you hit the search button, you’ll see a list of keywords on the next page. If you click on “Related”, the tool will automatically generate a list of related keywords that you can add to your cluster:
You can then send these keywords over to the Keyword Manager tool by ticking all the keywords you want and clicking the “+ Add to list” button:
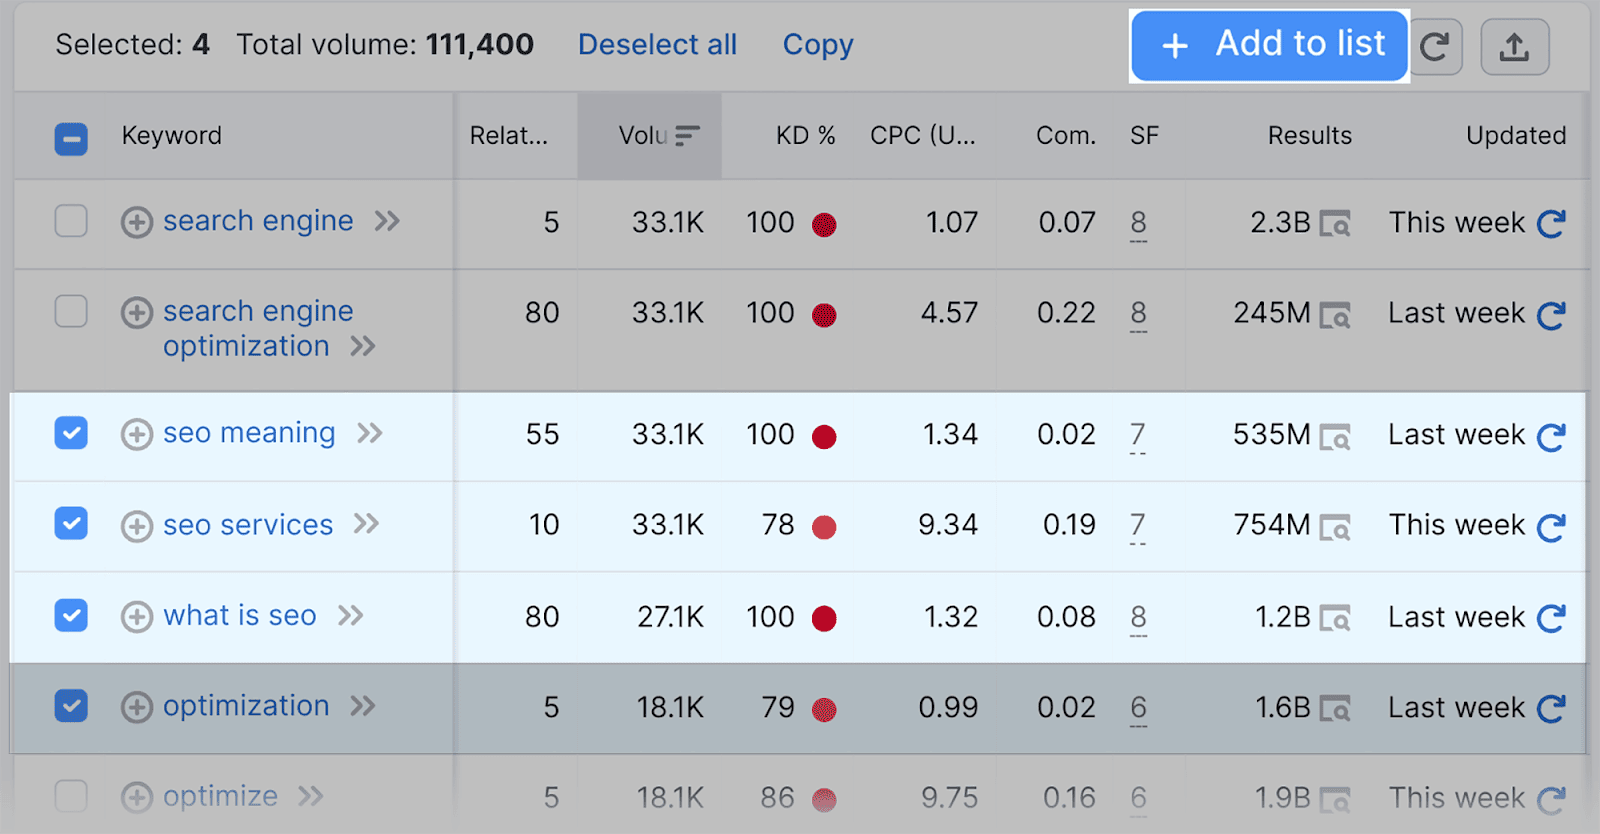
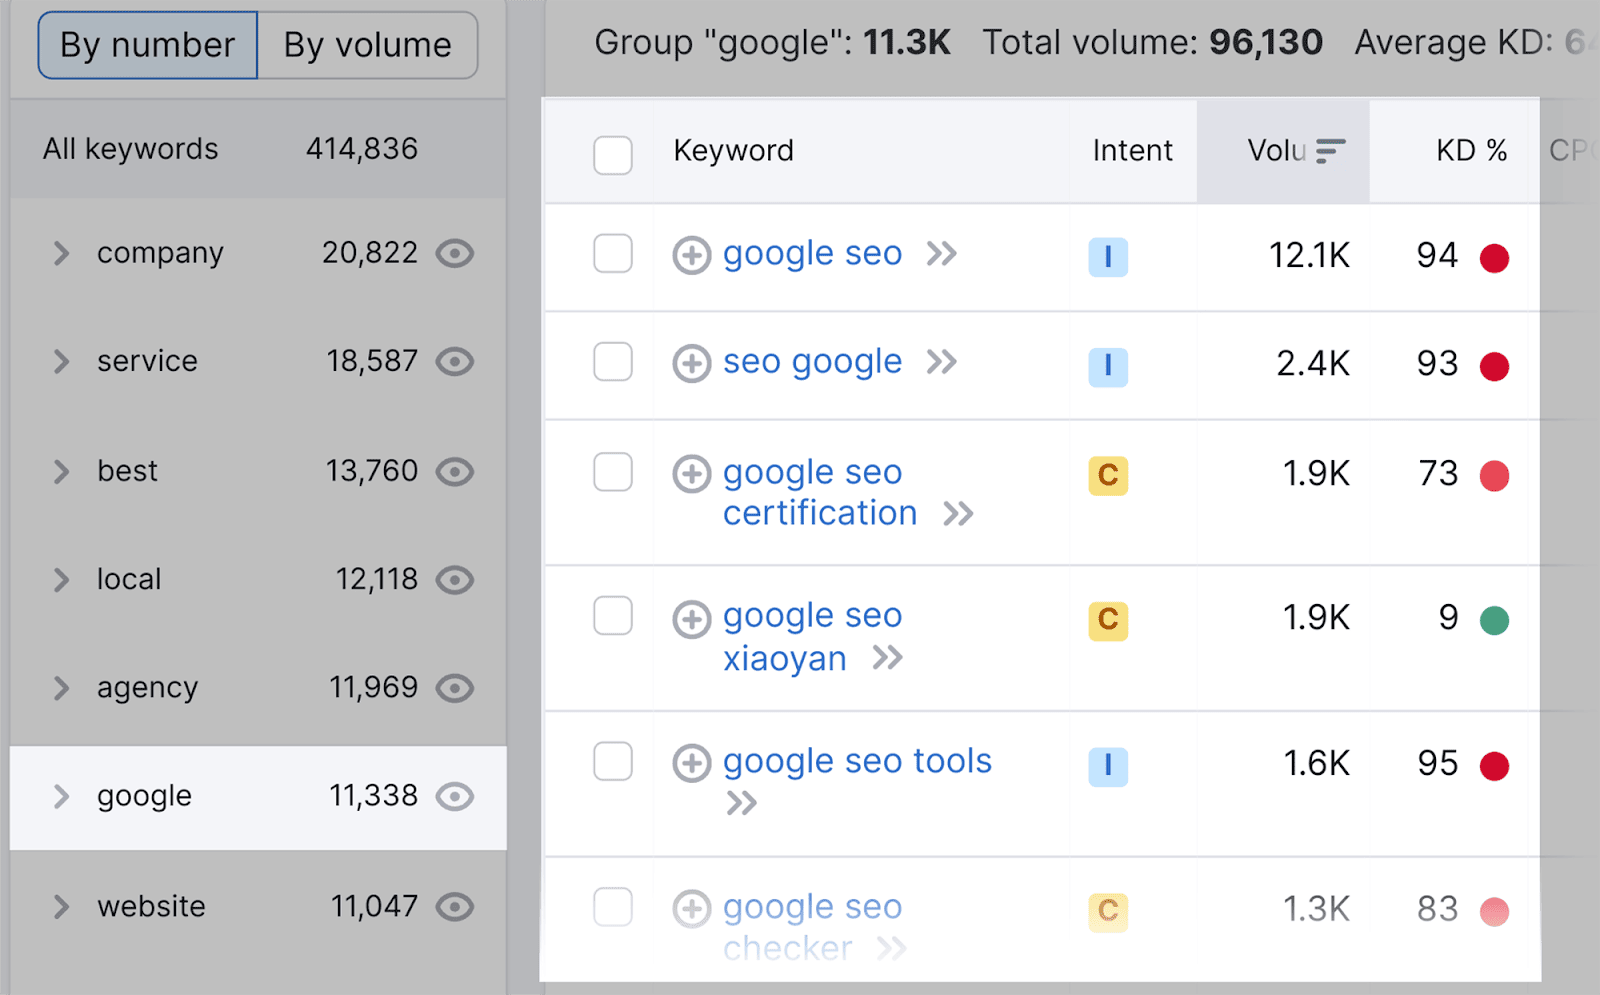
To find semantically related keywords, click on one of the keyword groups listed under “All keywords” on the left-hand side:
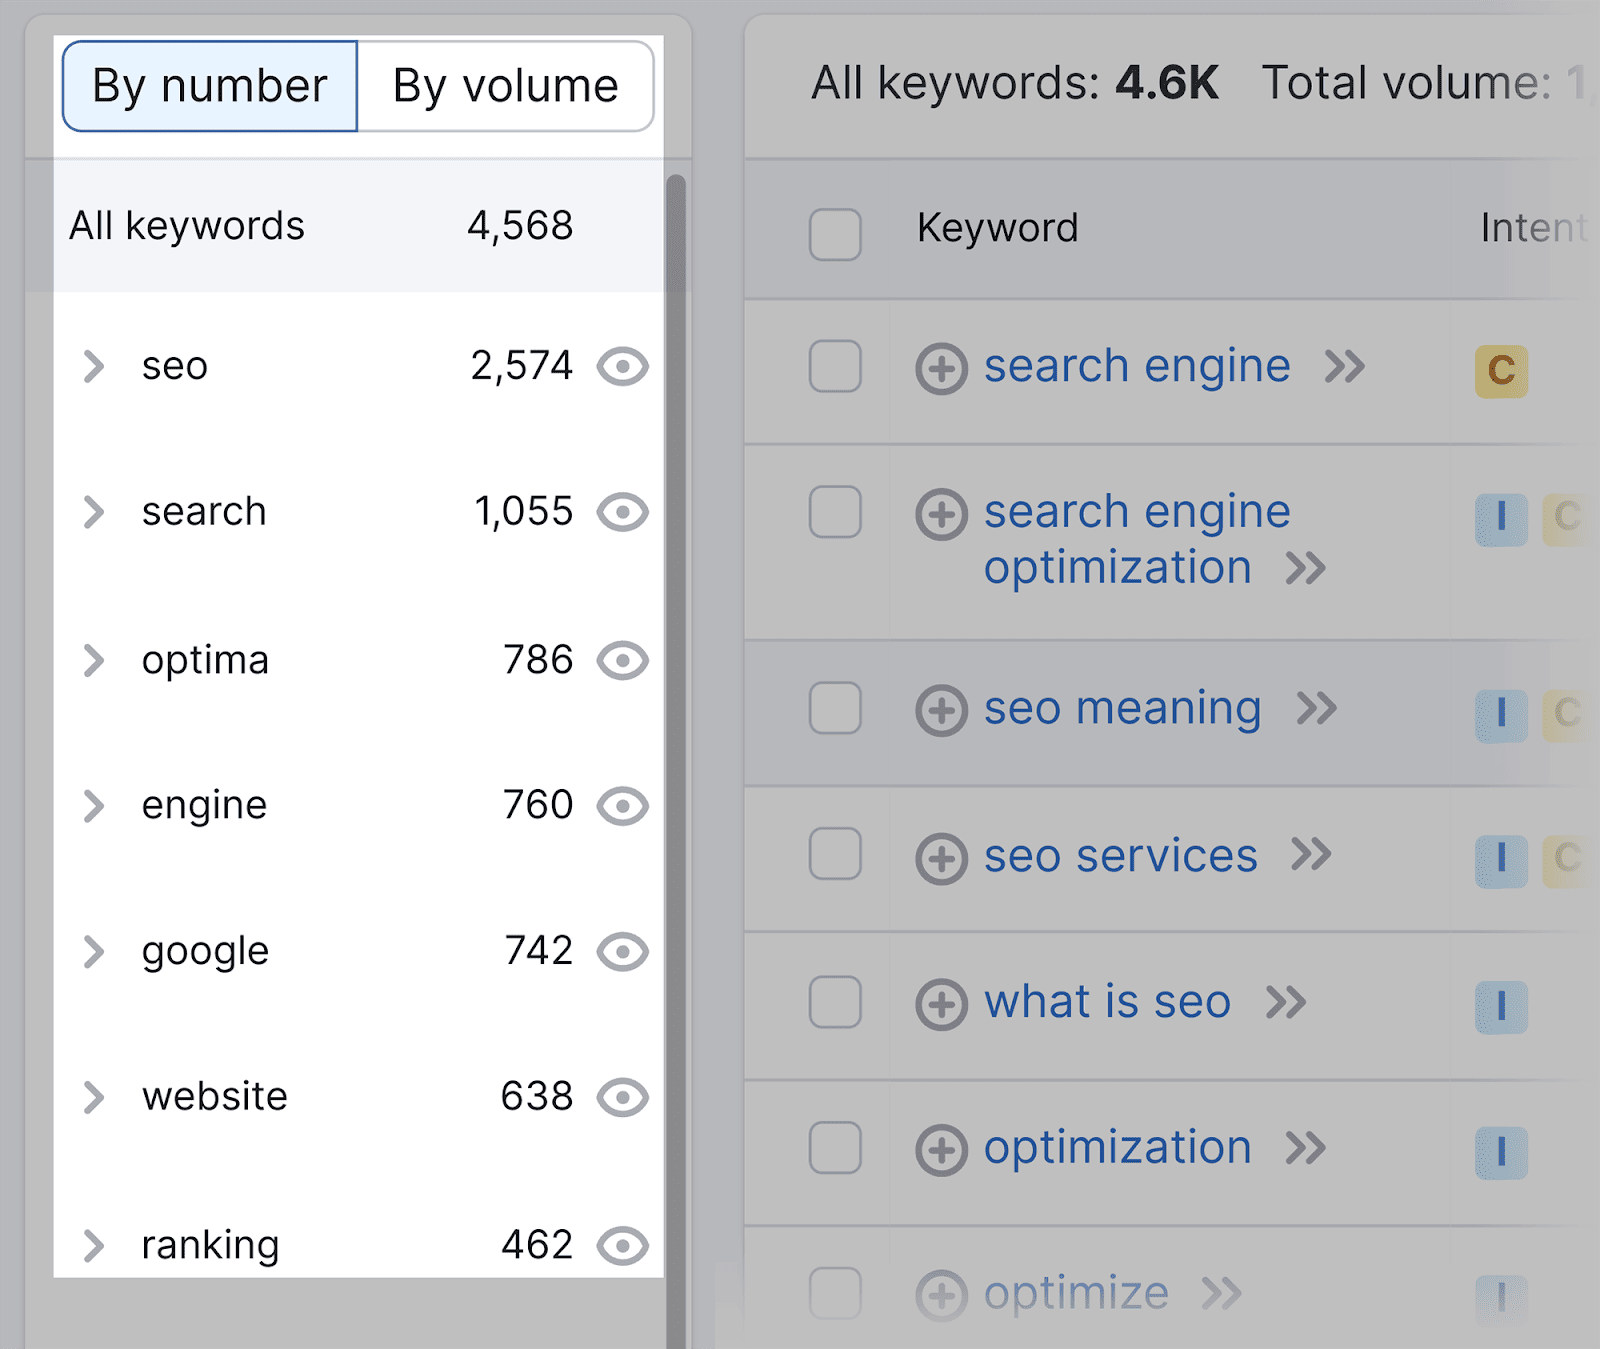
For example, if you click on Google, you’ll then be presented with more keywords that are semantically related to your seed keyword.
If you need more suggestions, head over to Semrush’s SEO Content Template tool:
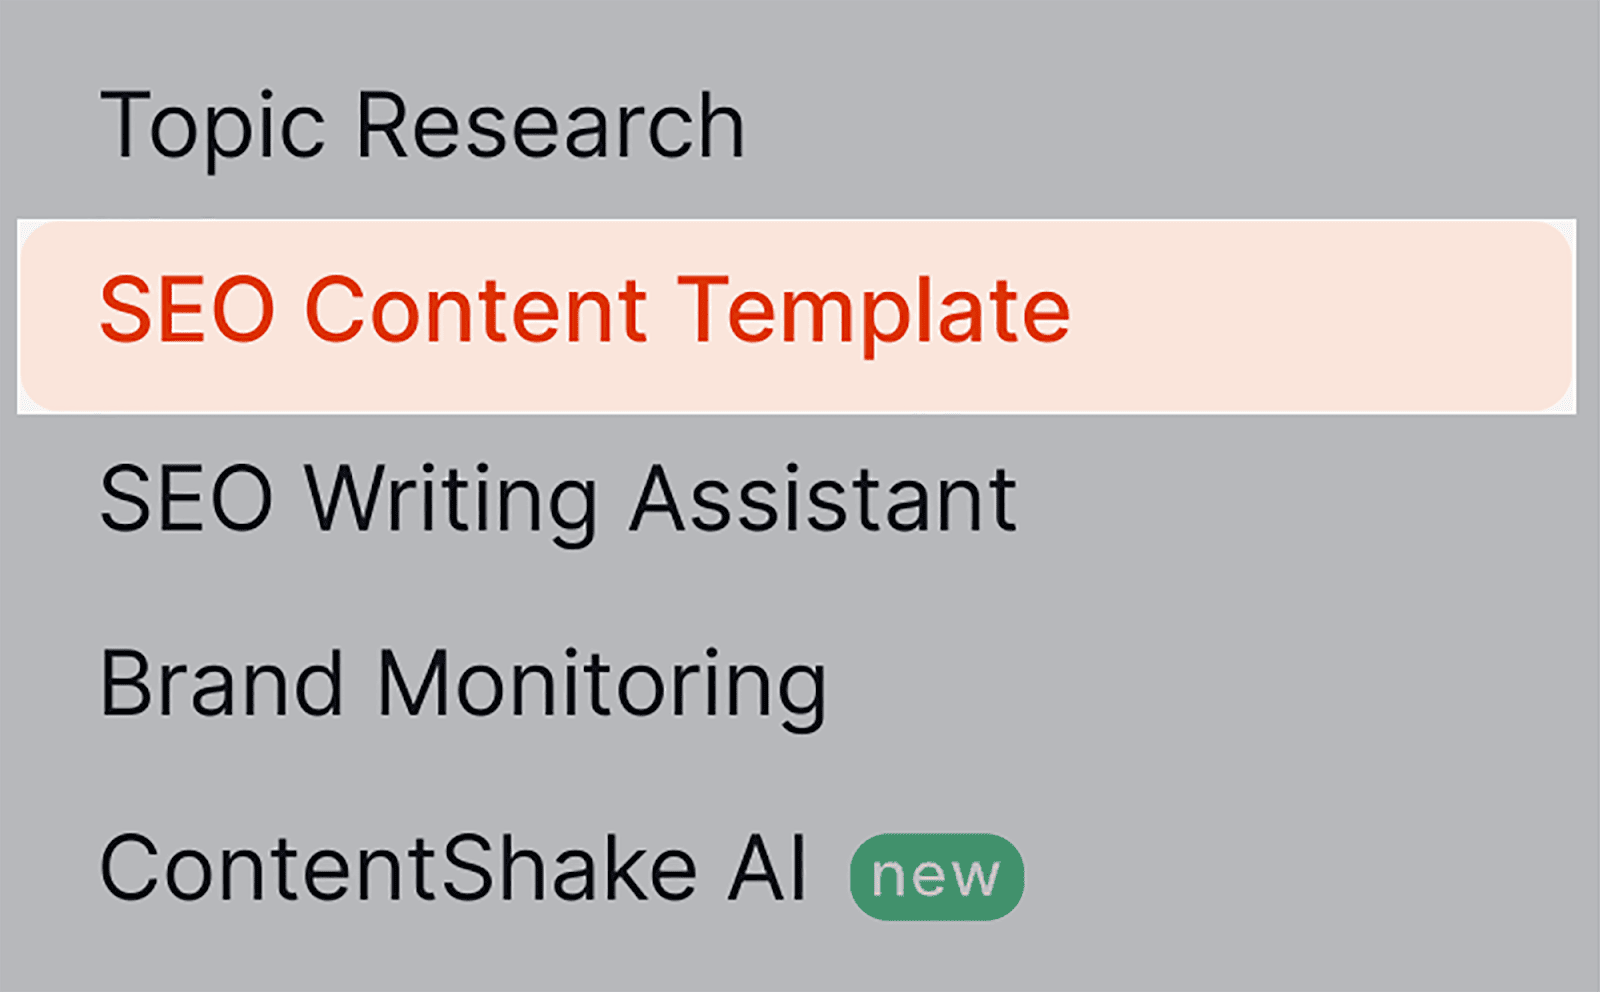
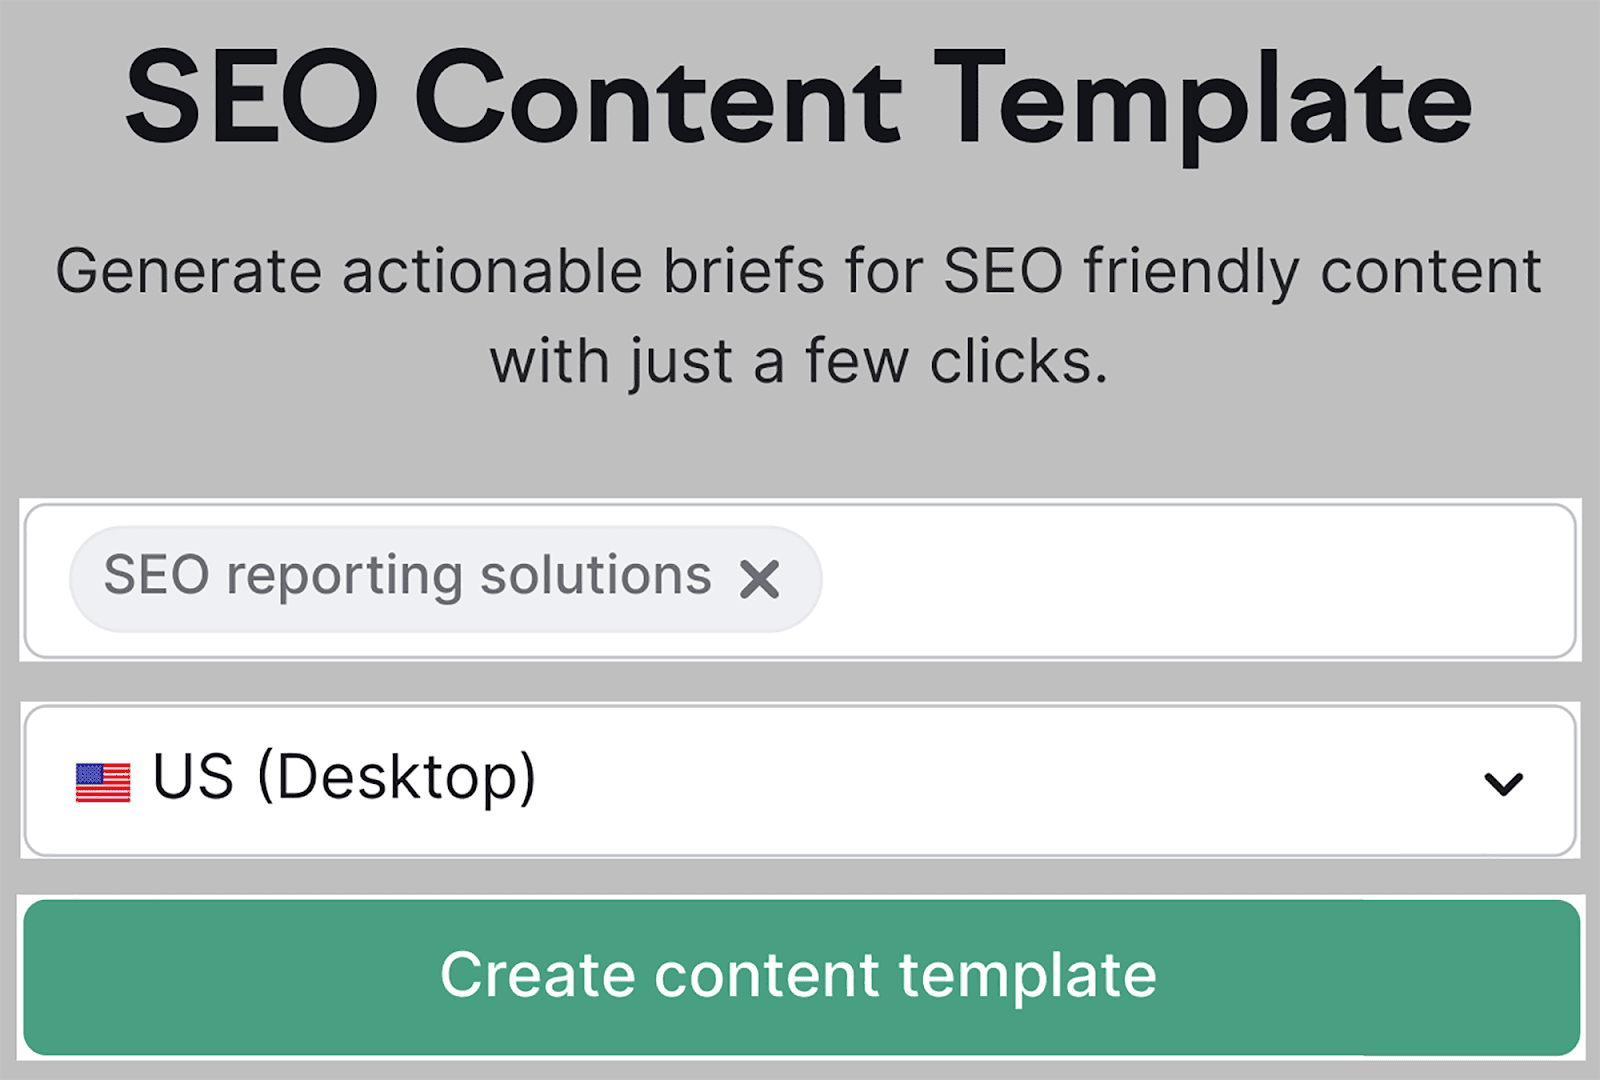
This tool will automate a cluster of semantically related keywords you can add to your article.
To use this tool, type your seed keyword into the search bar and click“ Create content template”:
On the next page you land on, scroll down to the “Key recommendations” section where you’ll find all the semantic keyword suggestions the tool has provided.

If you’ve already written and published your content, you can use Semrush’s On Page SEO Checker to audit your web pages and provide you with semantic keyword suggestions so that you can better optimize your content.
Here’s how to use the tool. Click on “On Page SEO Checker”:
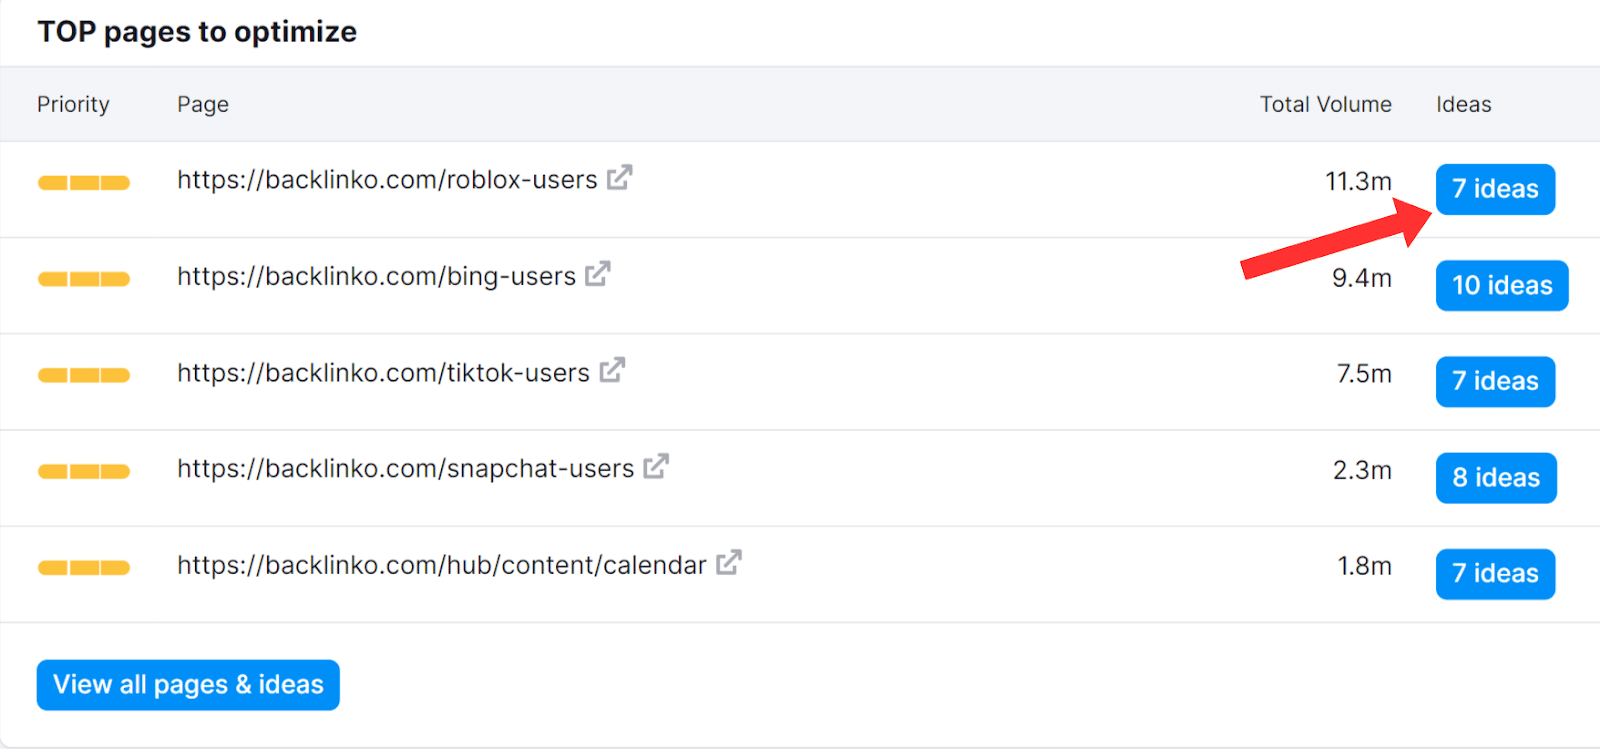
Then, scroll down to the “Top Pages to Optimize” section, and click on one of the “Ideas” buttons next to the URLs:
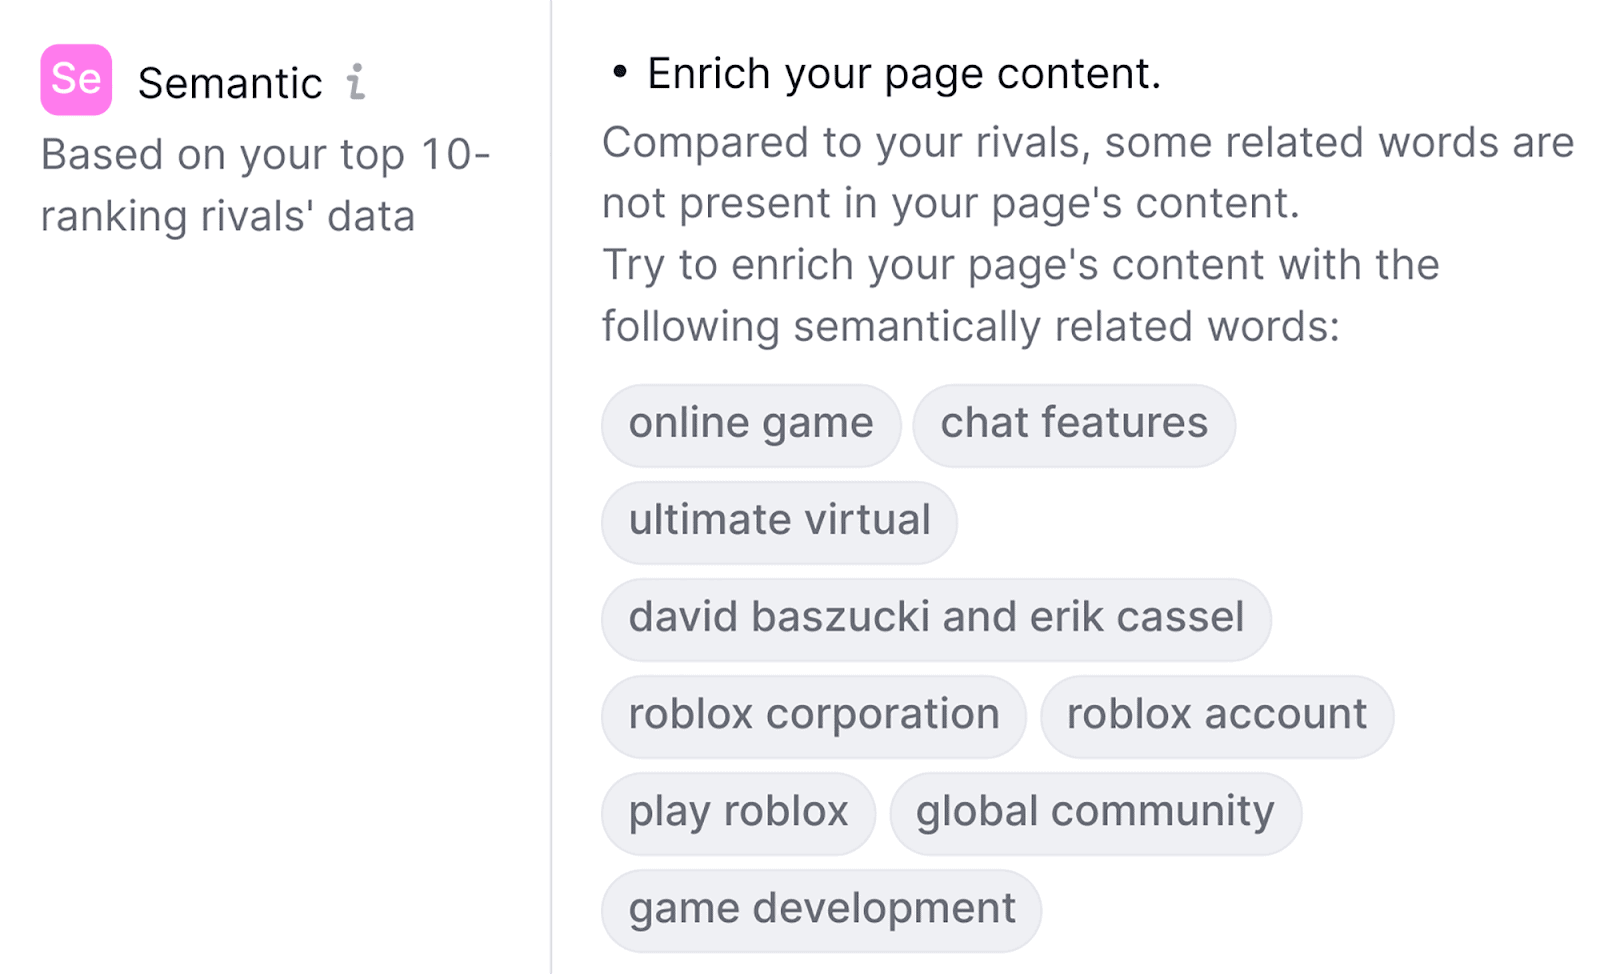
On the next page, scroll down and you’ll see a list of semantically related keywords your competitors are using in their content, but you aren’t using in yours.
Arranging your keywords into groups manually can prove to be quite time-consuming. Therefore, I highly recommend using Semrush to automate this task. You will save yourself a substantial amount of time.
6. Monitor keyword positions
You need to regularly monitor your keyword rankings on the SERPs to make sure your SEO efforts are actually paying off. The internet is an unpredictable place; you could be ranking highly for a keyword one day and then plummet the next.
Checking how you rank for a keyword manually is relatively straightforward. All you’ve got to do is search for the keyword on Google and see where you lie in the search results.
However, this would take a considerable amount of time and effort if you were to do it for every keyword that you’ve ever targeted on your website.
Instead, you can automate the task using Semrush’s Position Tracking tool to check exactly how well (or how poorly) you’re currently ranking for your main target keywords.
To use the tool, click on “Position Tracking” under the Keyword Research section:
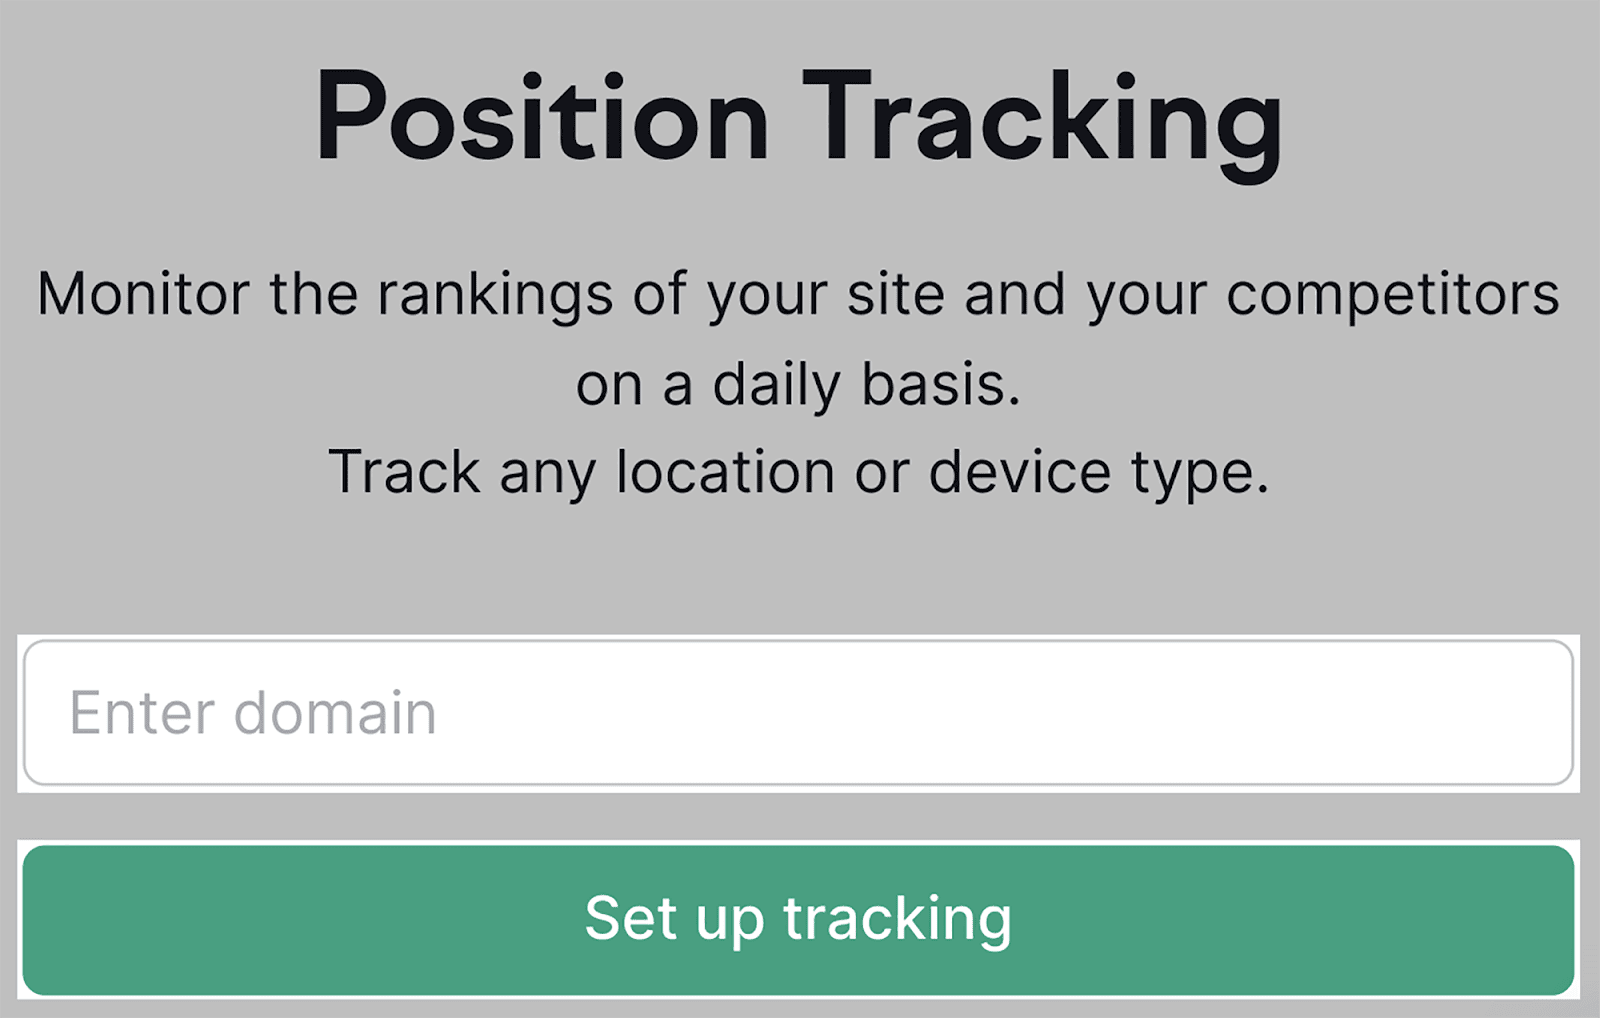
Enter your domain and select “Set up tracking”.
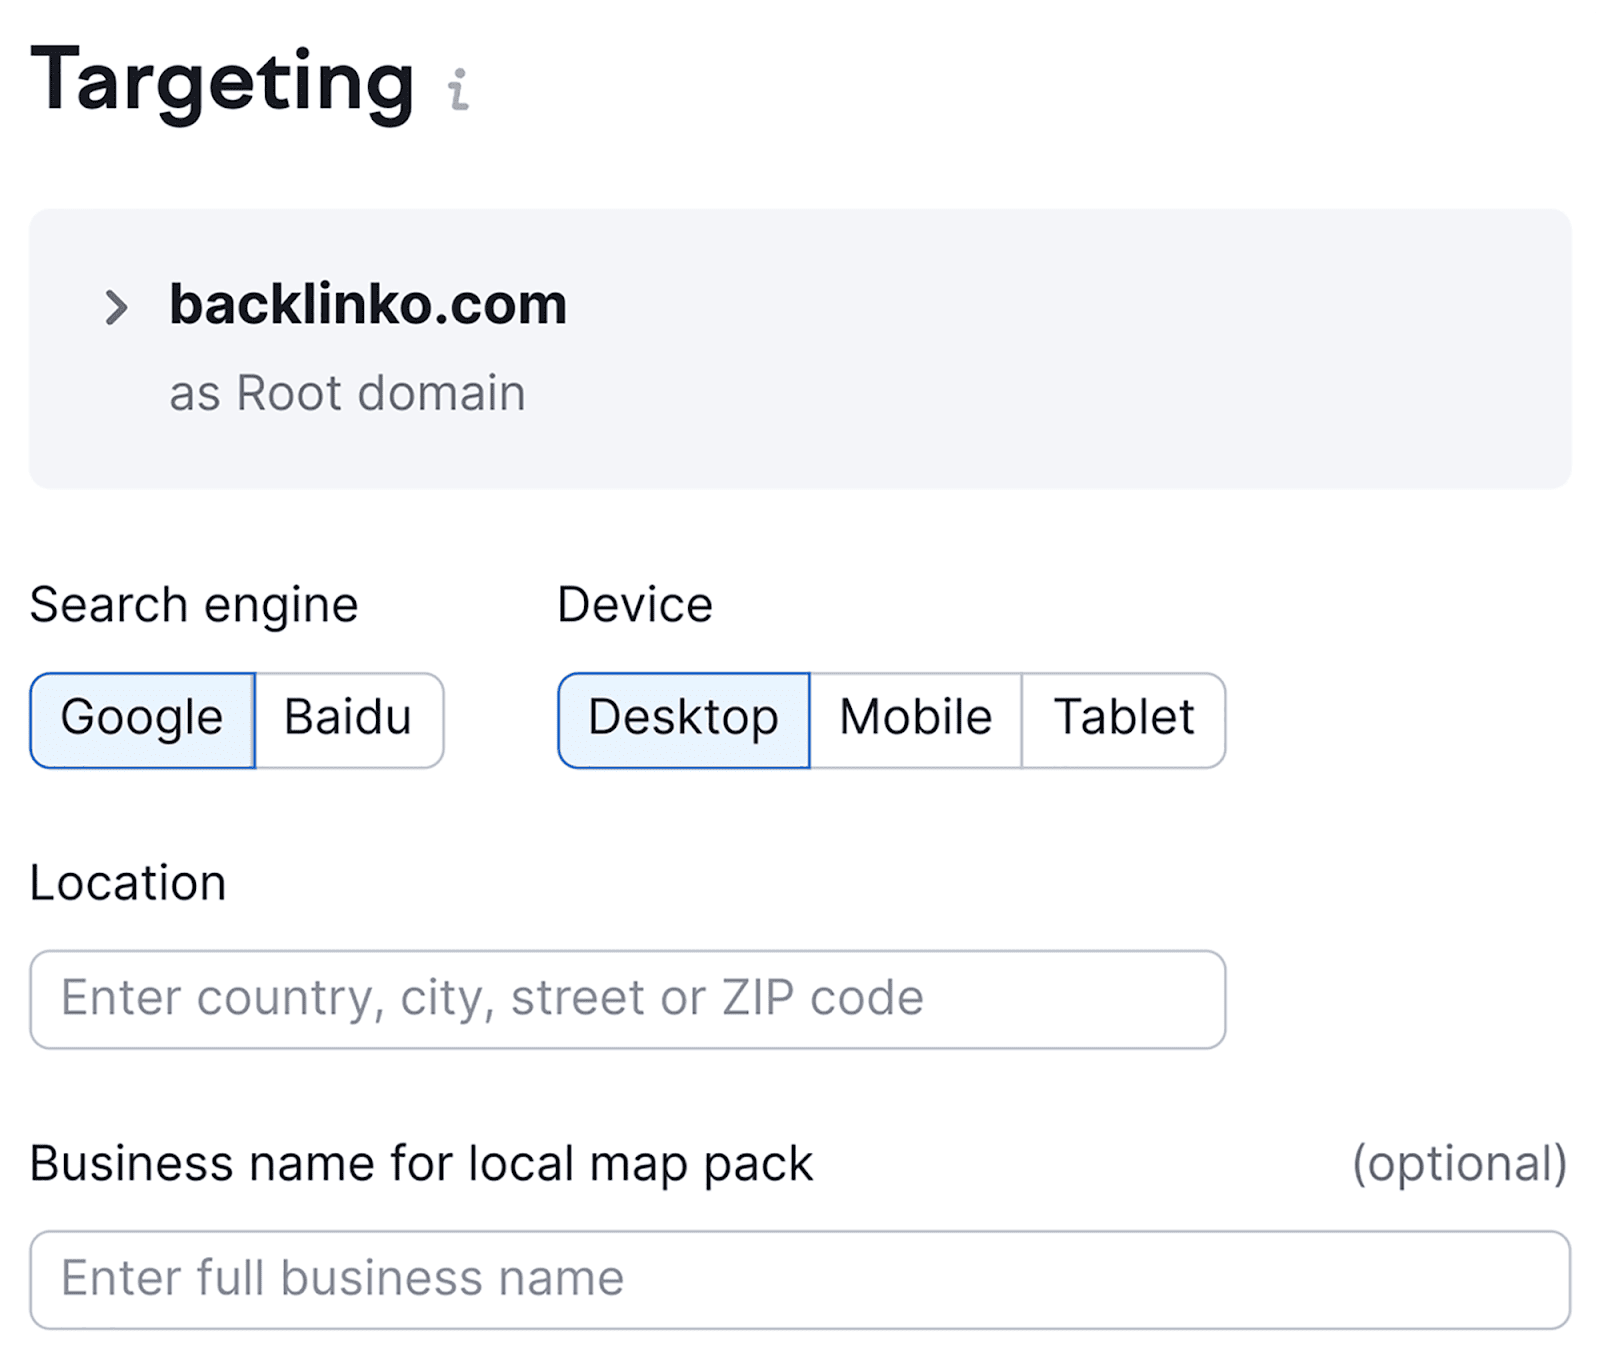
You’ll need to then select a search engine, device, location, and business name:
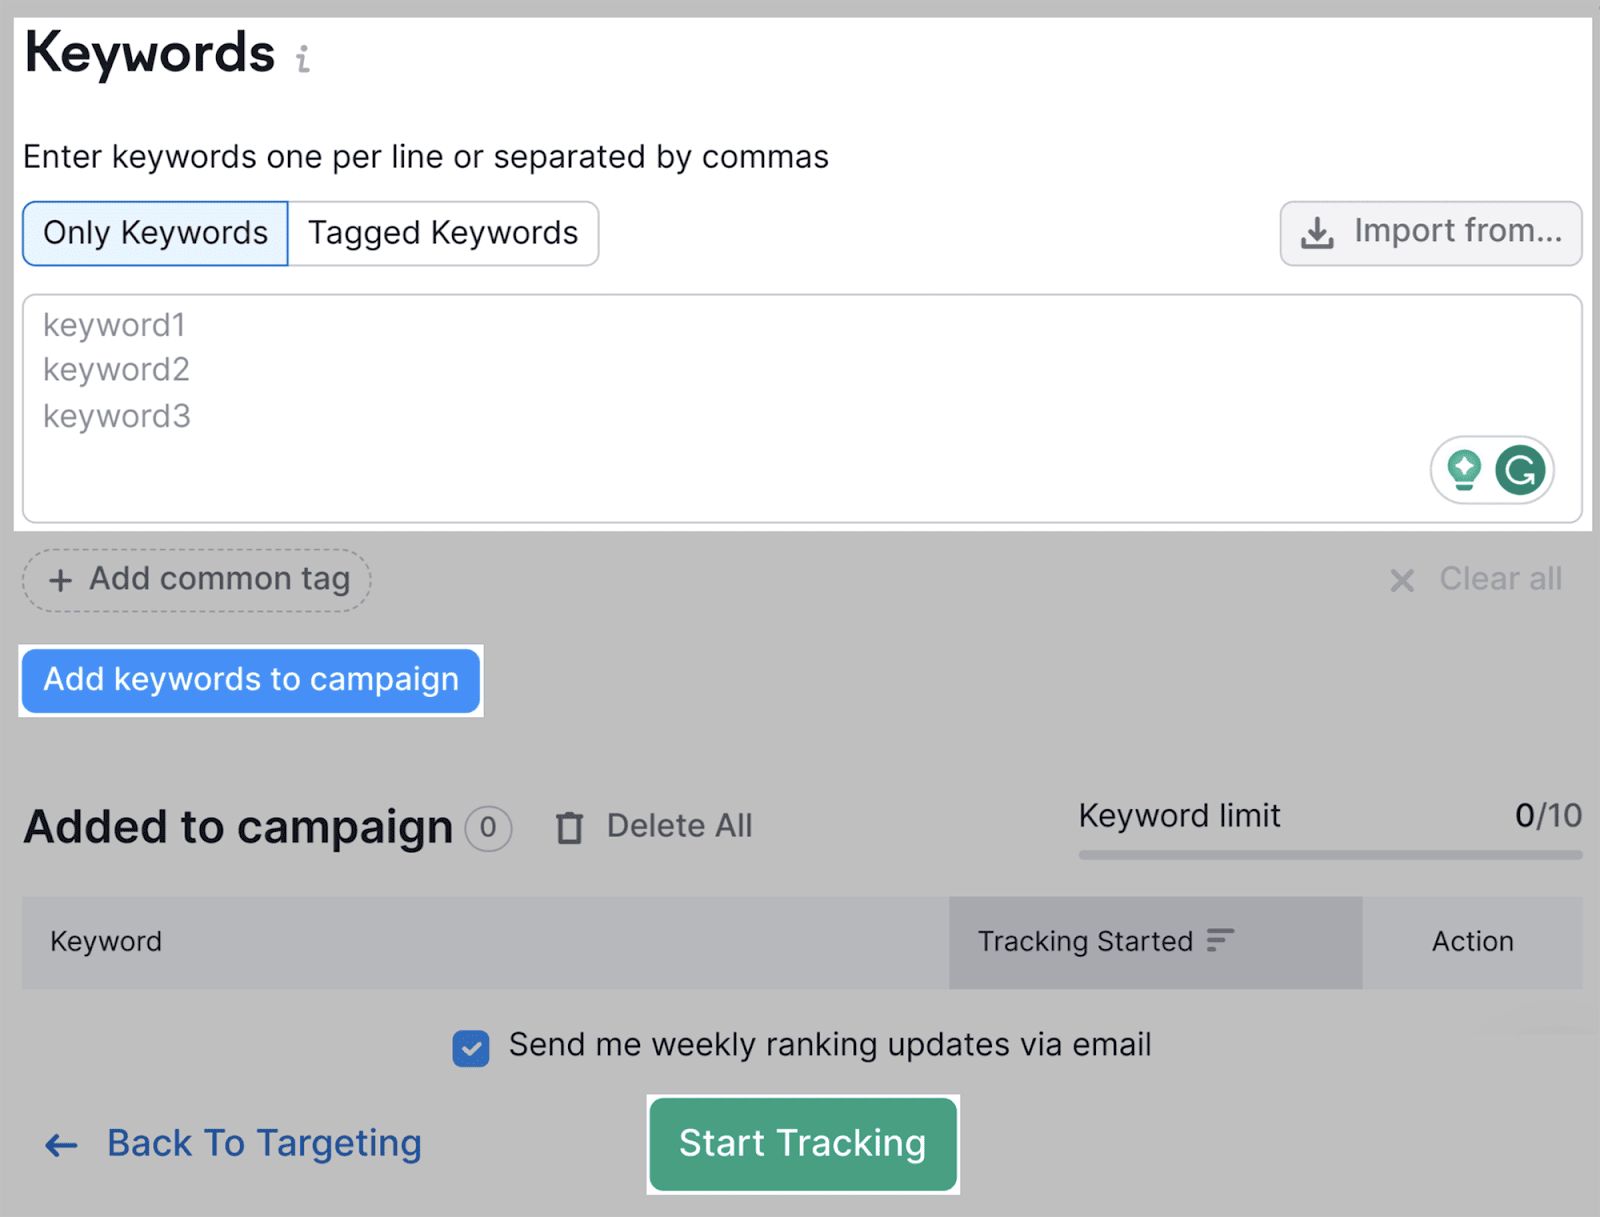
Next, you have to type in the keywords you want to track your positions for in the box below.
After you’ve typed them in, click “Add keywords to campaign”, and then the “Start Tracking” button:
Semrush will then need time to gather your Position Tracking data (this can take a couple of minutes, depending on how many keywords you entered).
Once it’s ready, you’ll land on the Position Tracking dashboard, which will look like this:
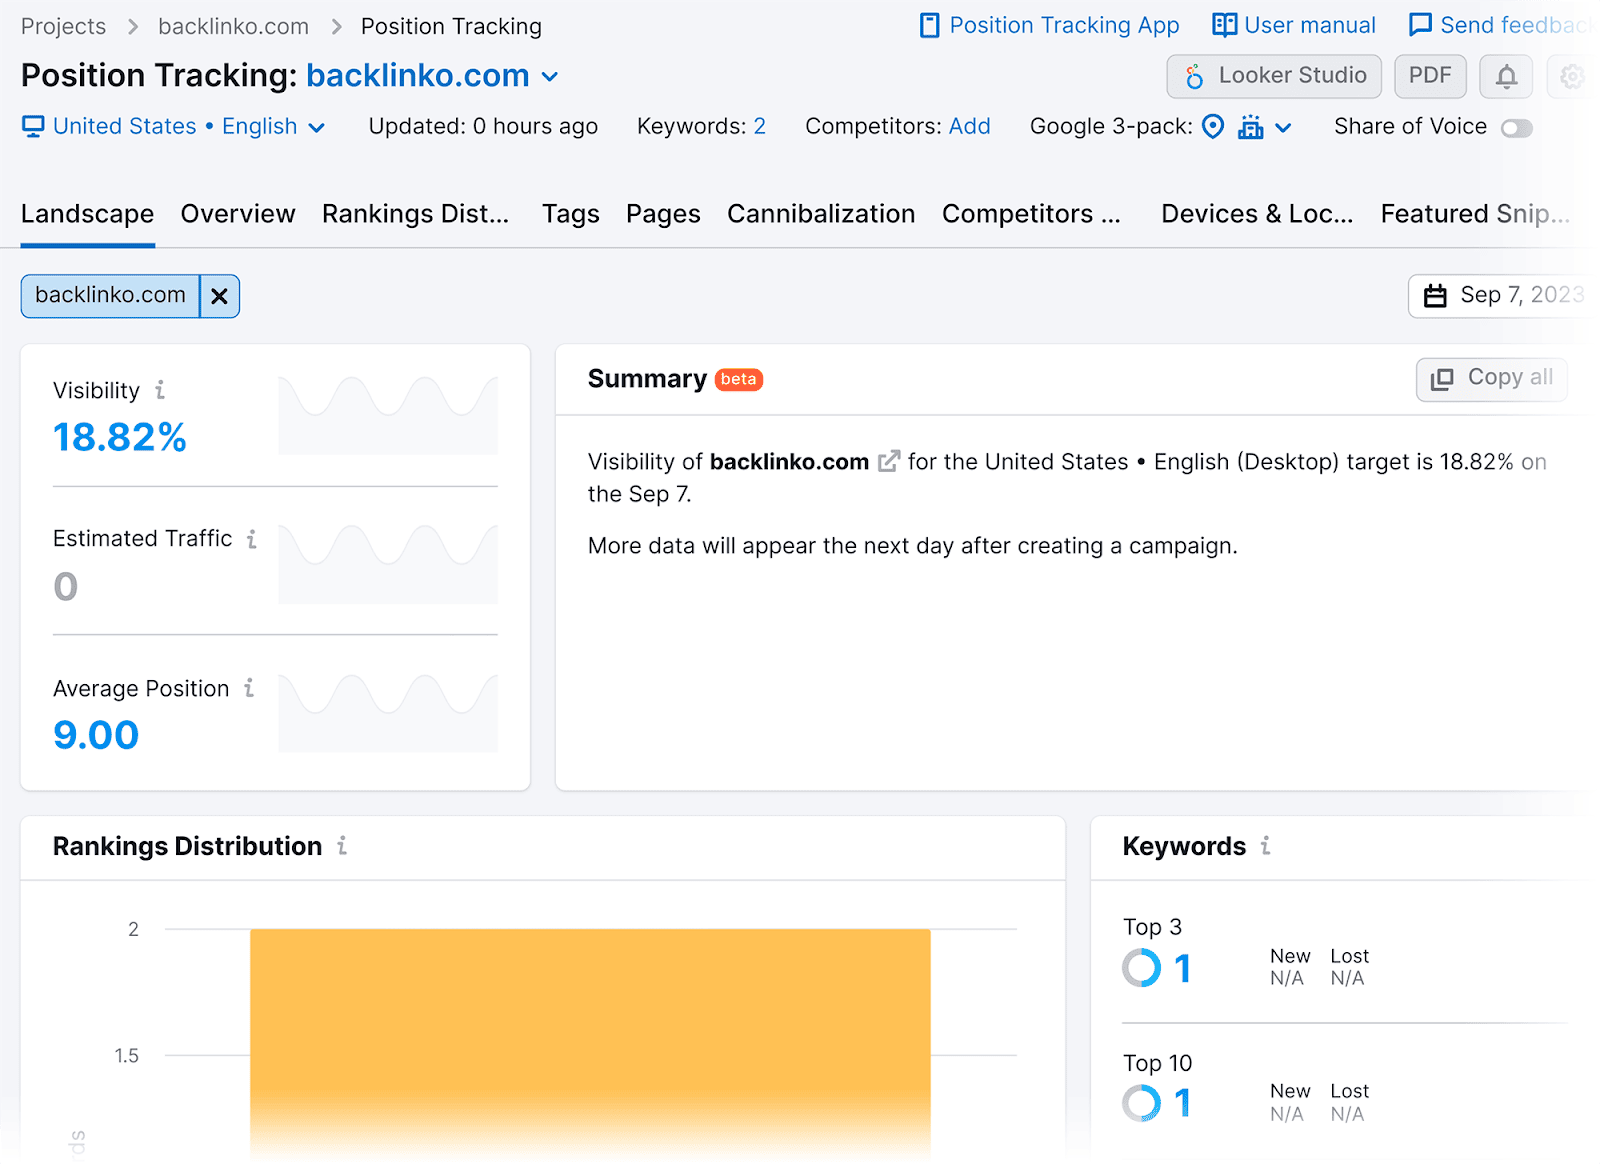
Scroll down, and you’ll see a Position Tracking table.
In this table, you can review where you currently rank (vs. where you ranked at an earlier ****), as well as the estimated amount of traffic those keywords are pulling in:
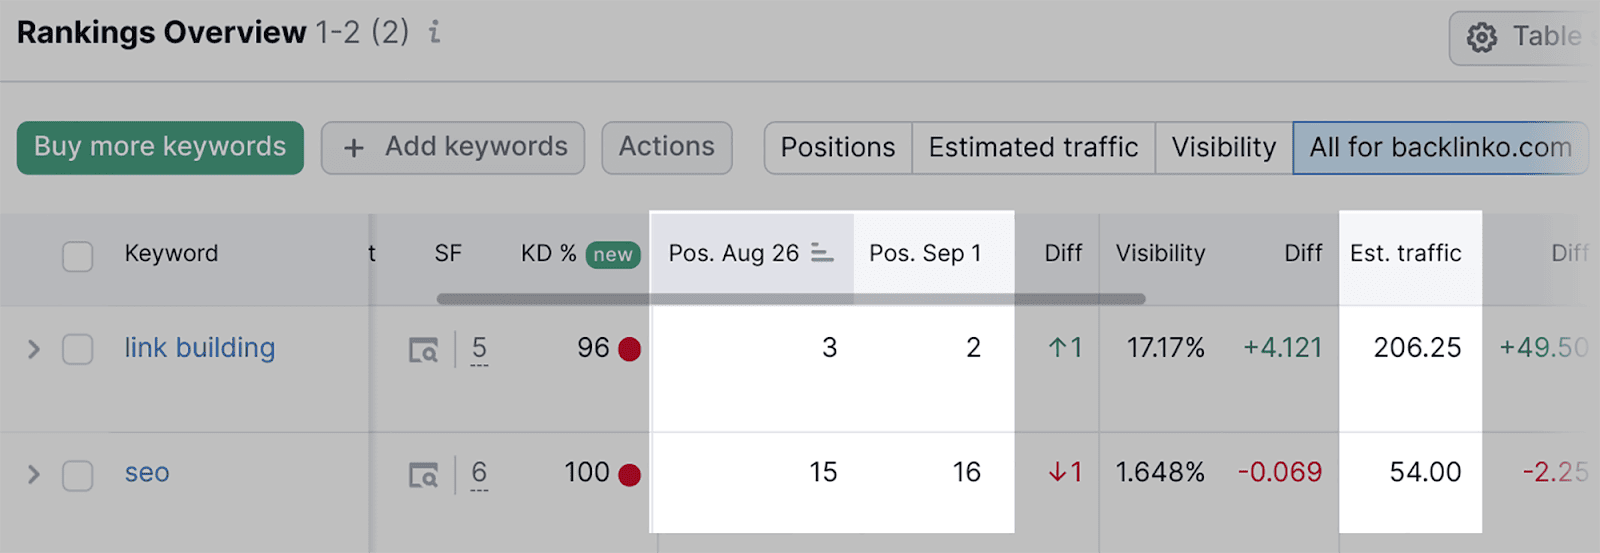
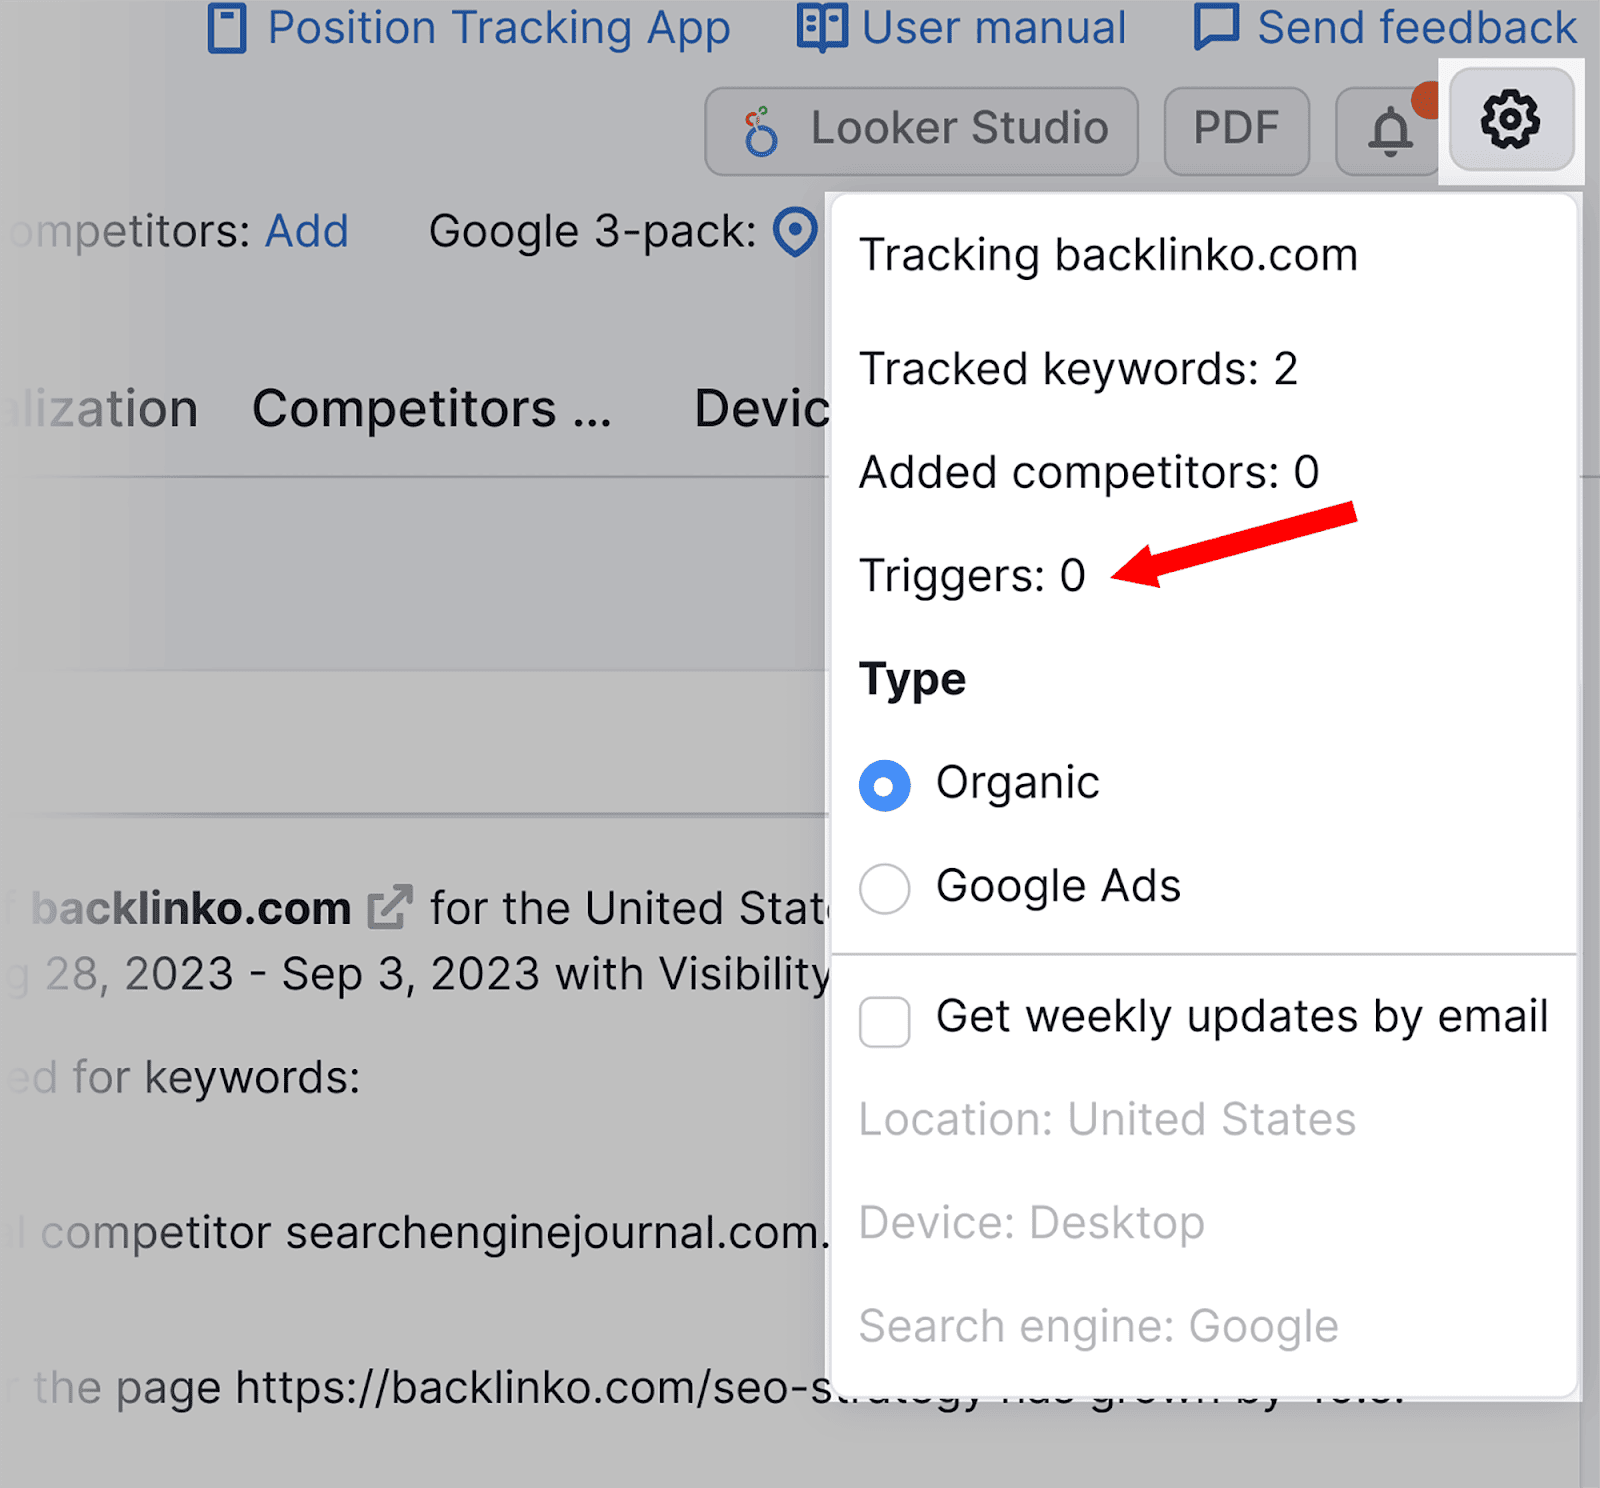
You can also automate alerts that will trigger whenever your keyword positions on the SERPs change.
To do this, click on the settings button on the far right, and select “Triggers”:
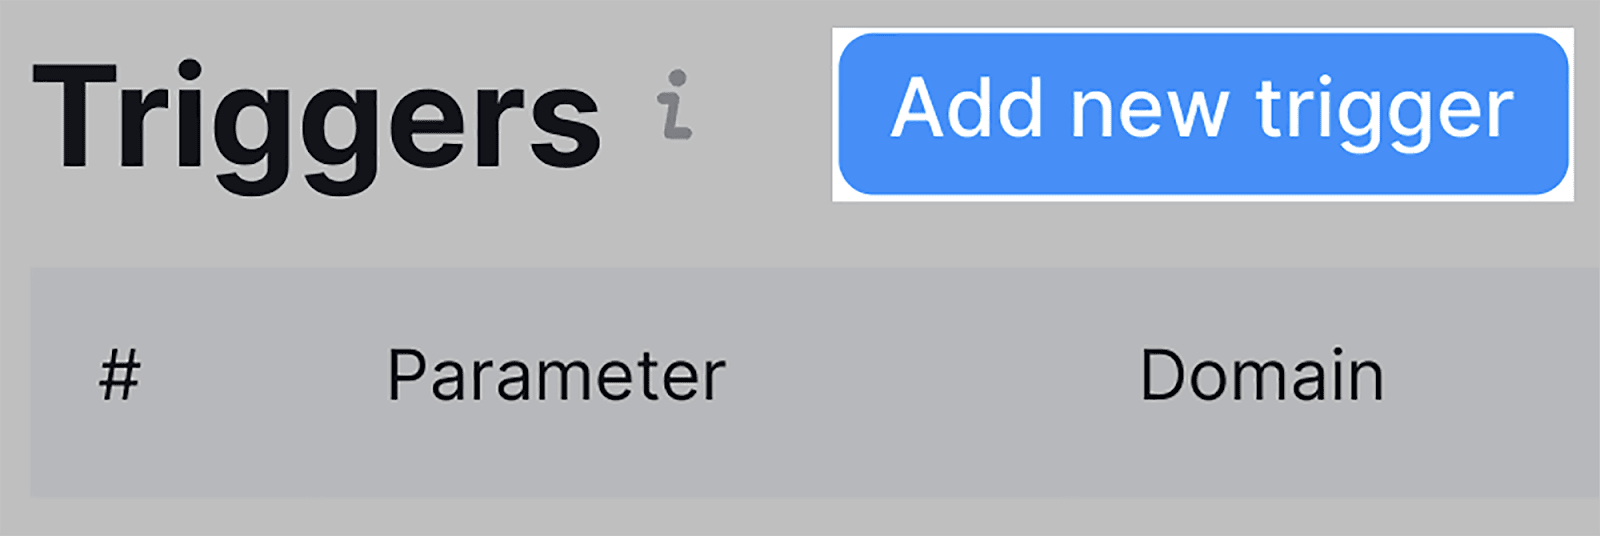
Then, click “Add new trigger”:
You can then select how many positions a keyword would need to move up or down in the rankings in order for you to receive an alert:
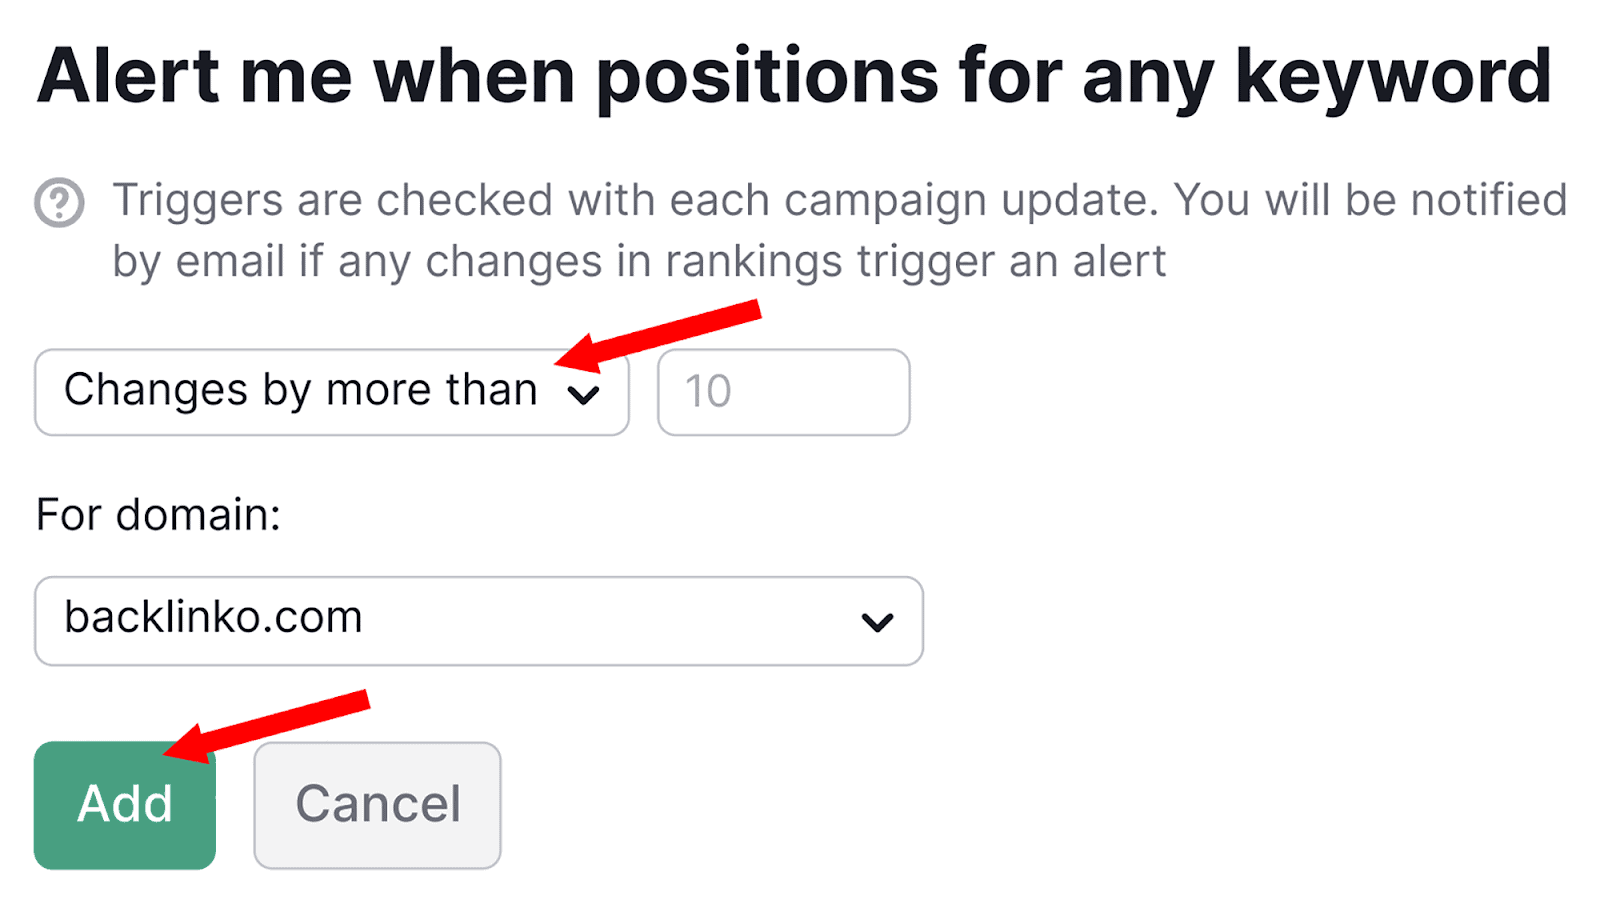
Once you hit “Add”, the alert will be created.
7. Site Audit
Site audits will help you identify all things that potentially impact your site’s performance levels and rankings. These include:
- Broken internal links
- 404 pages
- Duplicate title tags and meta descriptions
- Duplicate content issues
- Pages that couldn’t be crawled
- Redirect chains and loops
- Slow loading pages
- Non Indexed pages
- Backlinks
If your pages take ages to load or if your internal links are broken, your site visitors will likely get frustrated and leave your site.
This will impact their user experience negatively, which means that your bounce rate increases and visits to your site will decrease. Ultimately, this will lead to a drop in your SERP rankings.
However, it’s not only your site visitors that will be affected by these issues.
For example, issues such as broken links can also impact Googlebot’s ability to crawl your site, which could result in some of your web pages not being crawled and indexed. If your pages aren’t indexed, they can’t rank at all.
These issues may not be immediately obvious to you as the webmaster, so you need to conduct regular site audits to ensure that everything is running smoothly.
You could go through the entirety of your domain and look for errors yourself, but this would be very time-consuming, not to mention unreliable.
Instead, you could use Semrush’s Site Audit tool, which will automatically crawl your website and identify errors.
Here’s how to use the Site Audit tool.
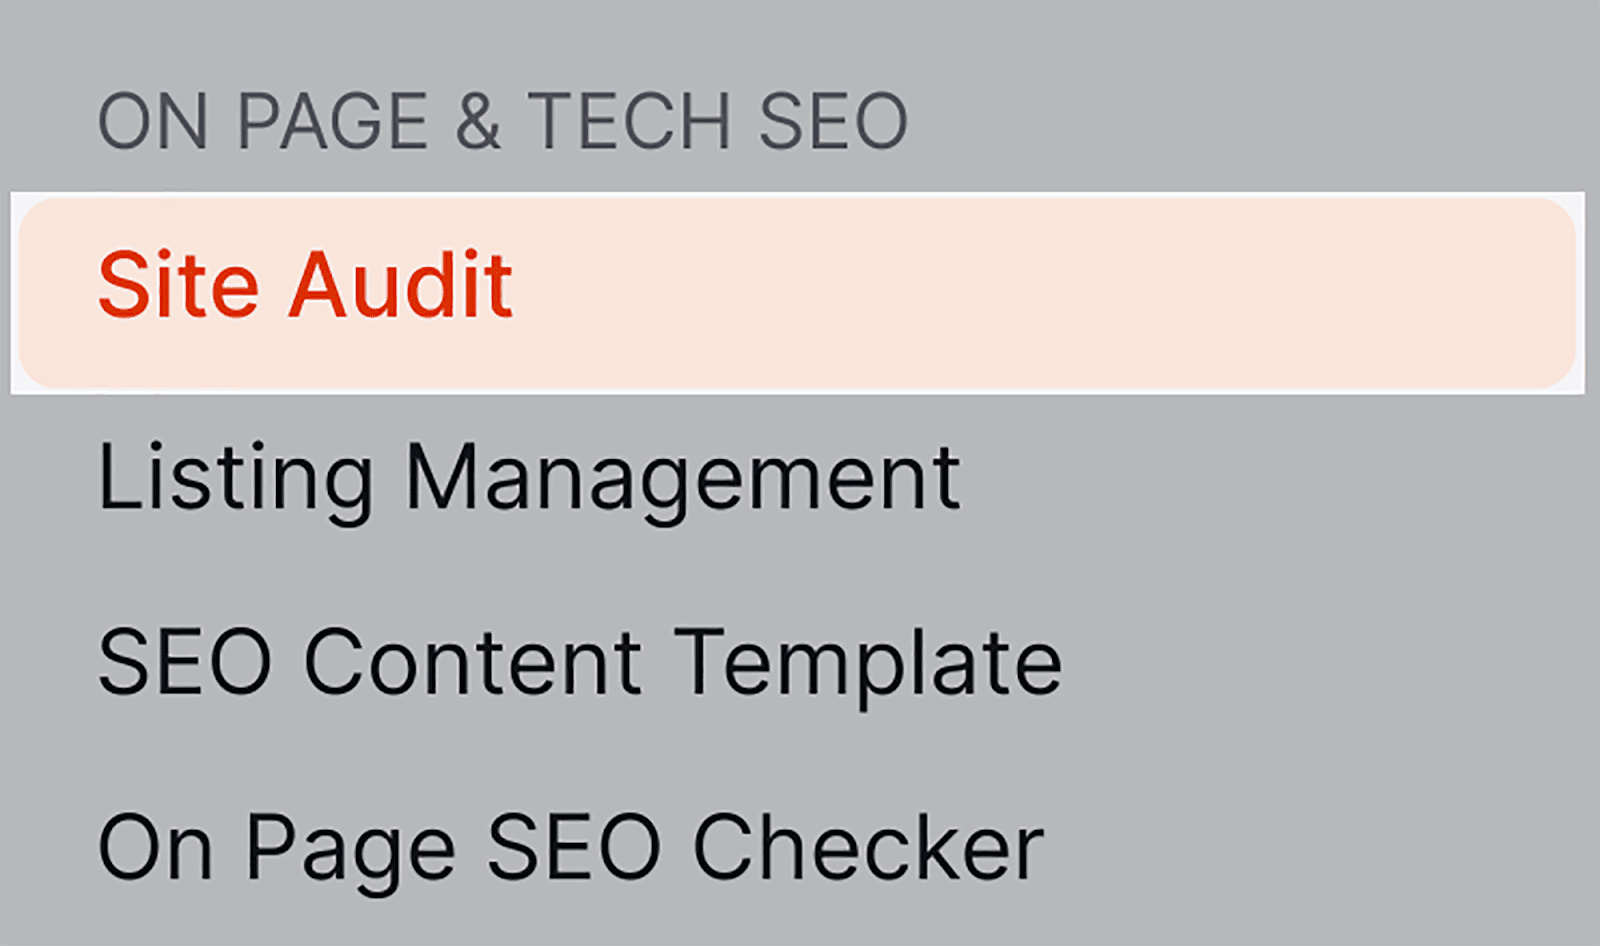
Scroll down till you find Site Audit on the left:
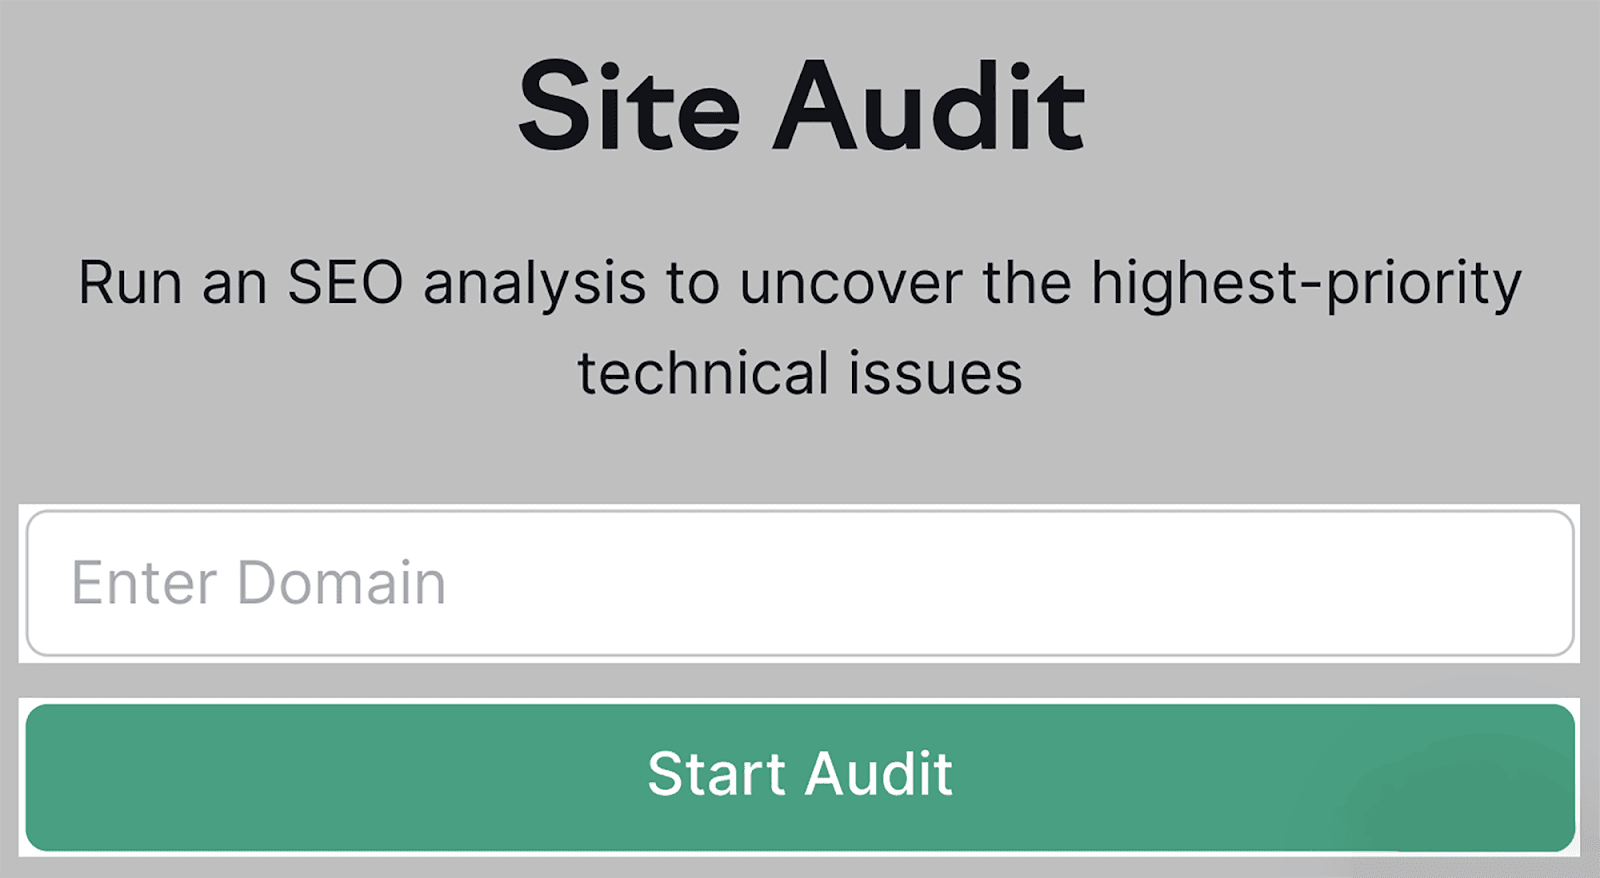
After you click on it, paste your domain in the search bar and click “Start Audit”:
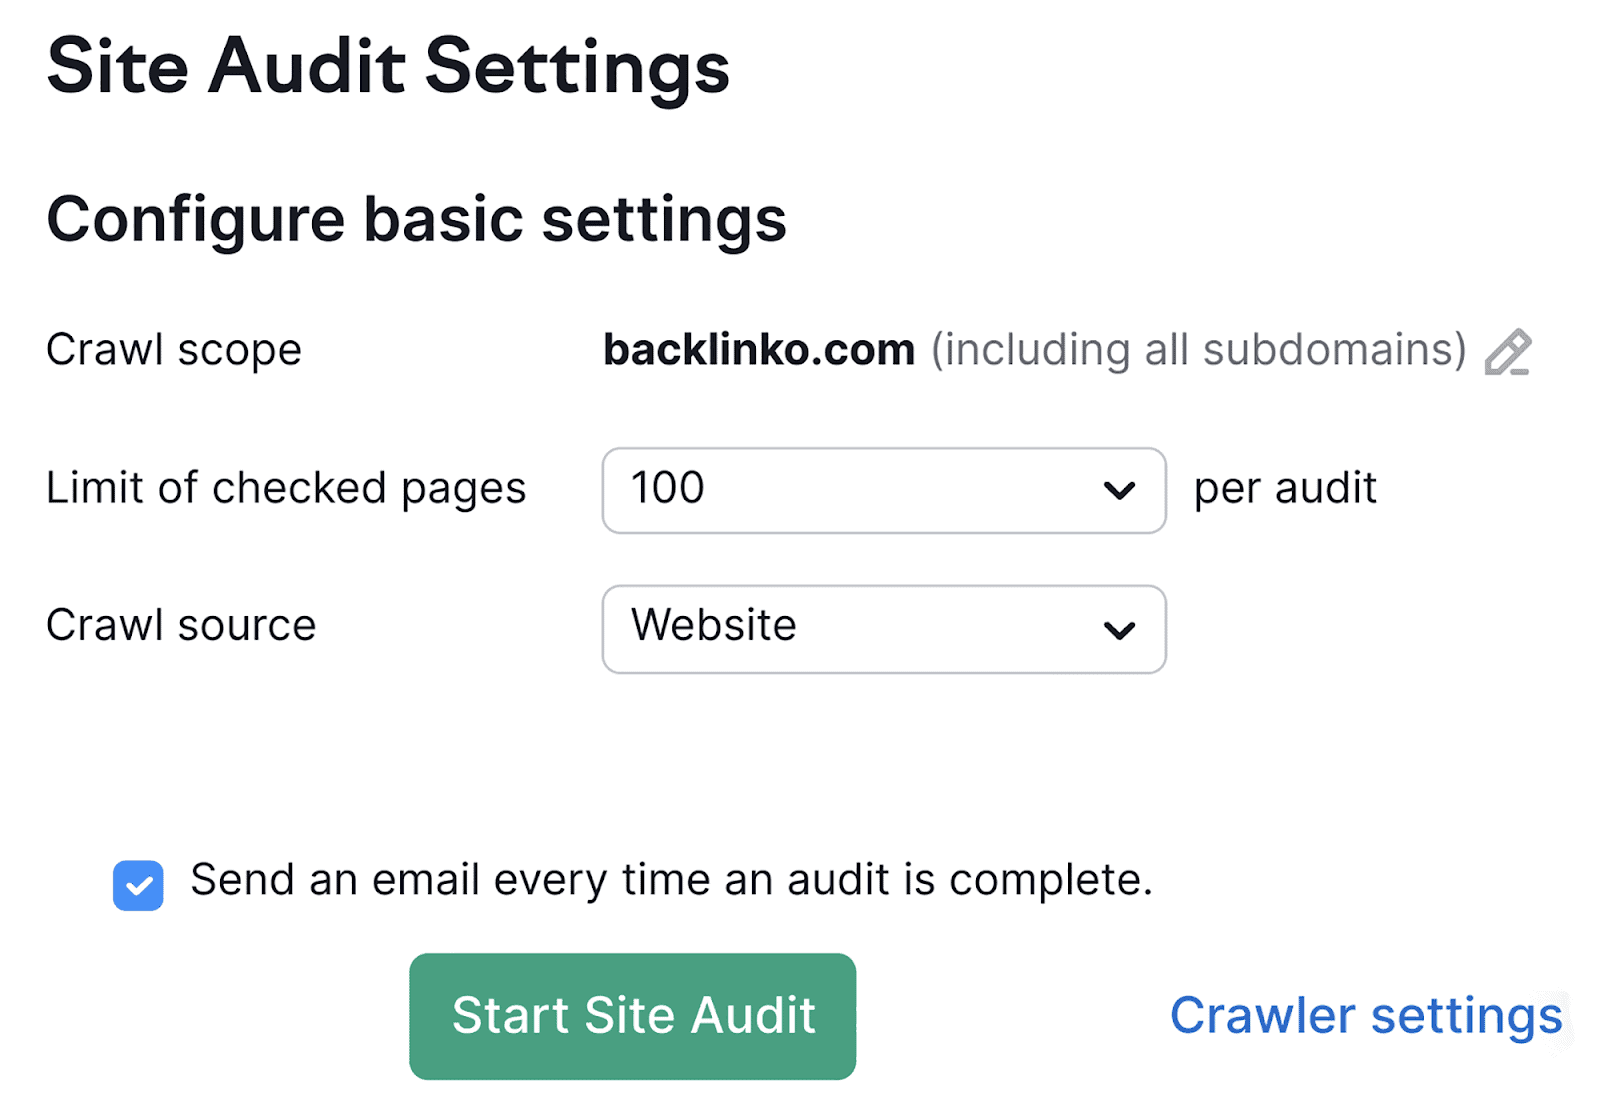
You’ll then need to select a few configurations, before hitting “Start Site Audit”:
Once your site audit is complete, you’ll land on the Site Audit Overview dashboard.
Here, you get a quick snapshot of how your website is performing overall. Most importantly, you should be checking the ”Site Health” and “Errors” graphs:
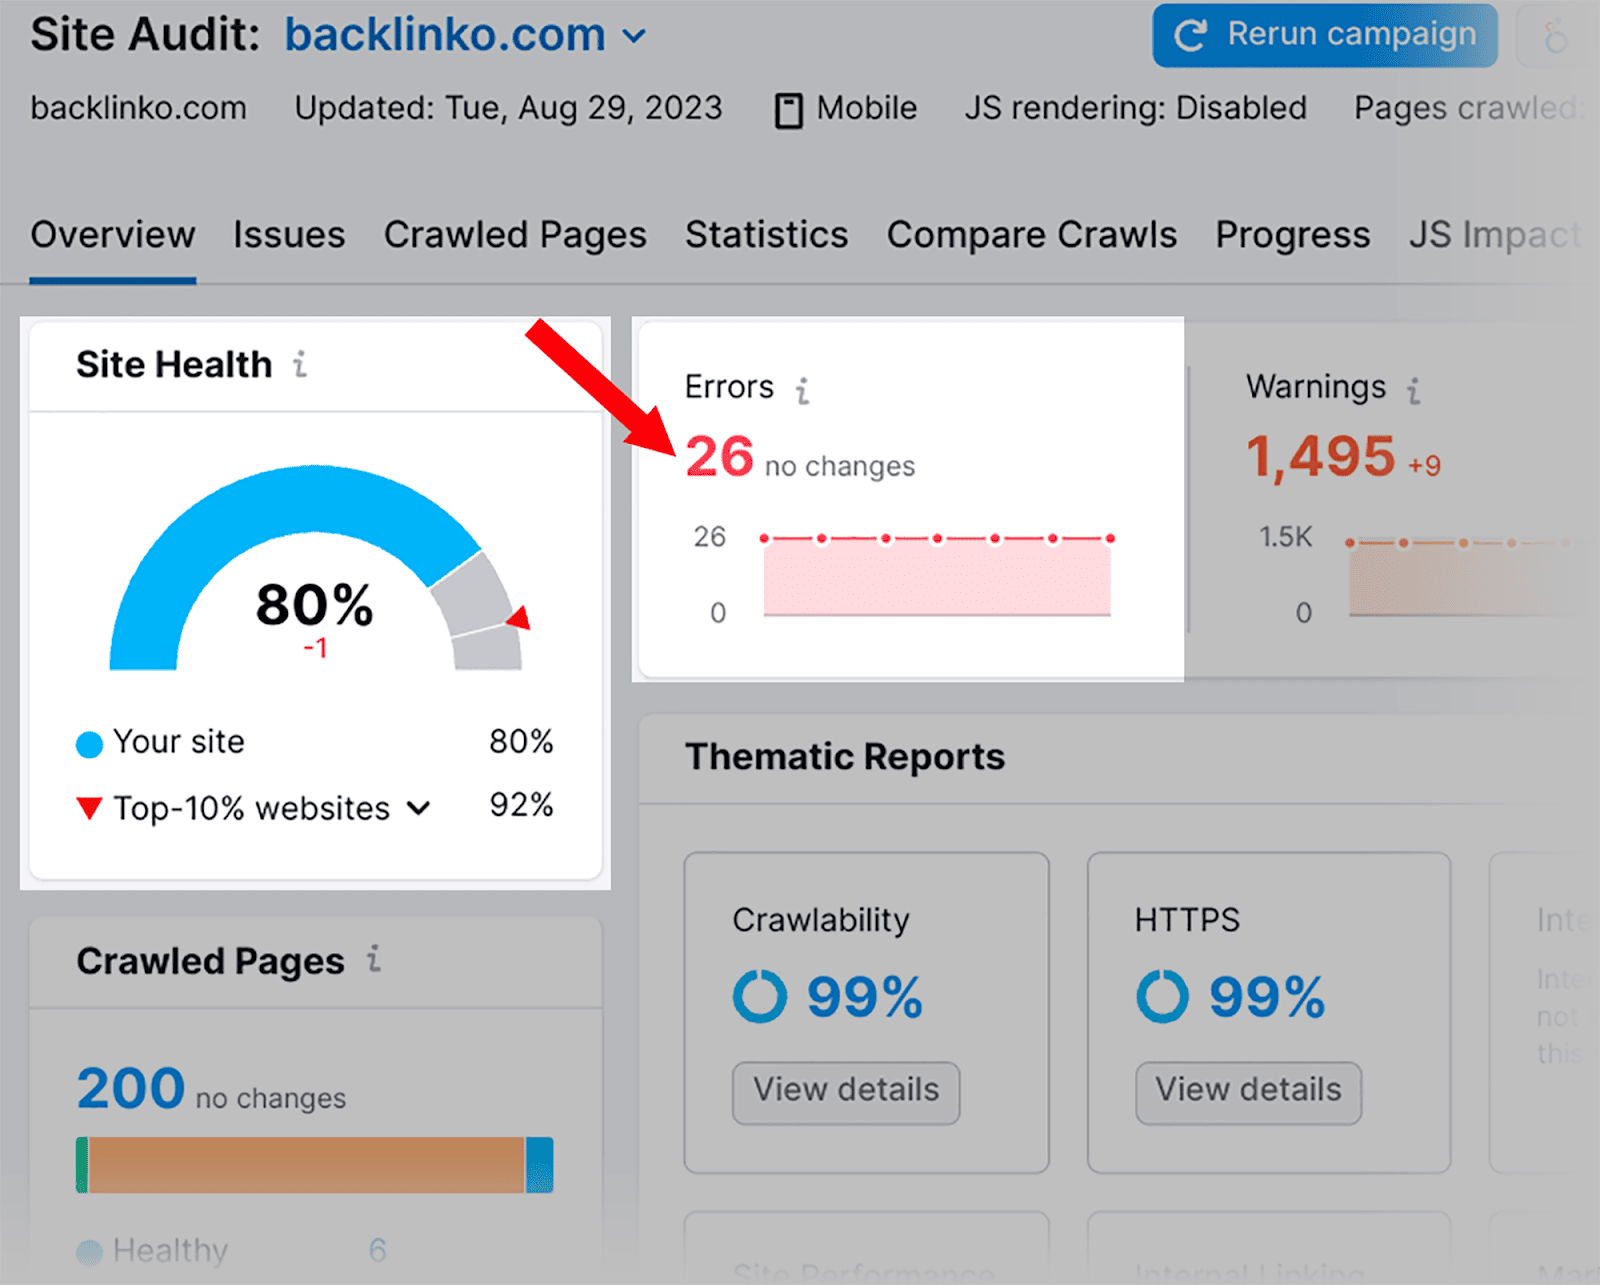
If you click on the number under “Errors”, you’ll be taken to a list of issues that you need to fix ASAP.
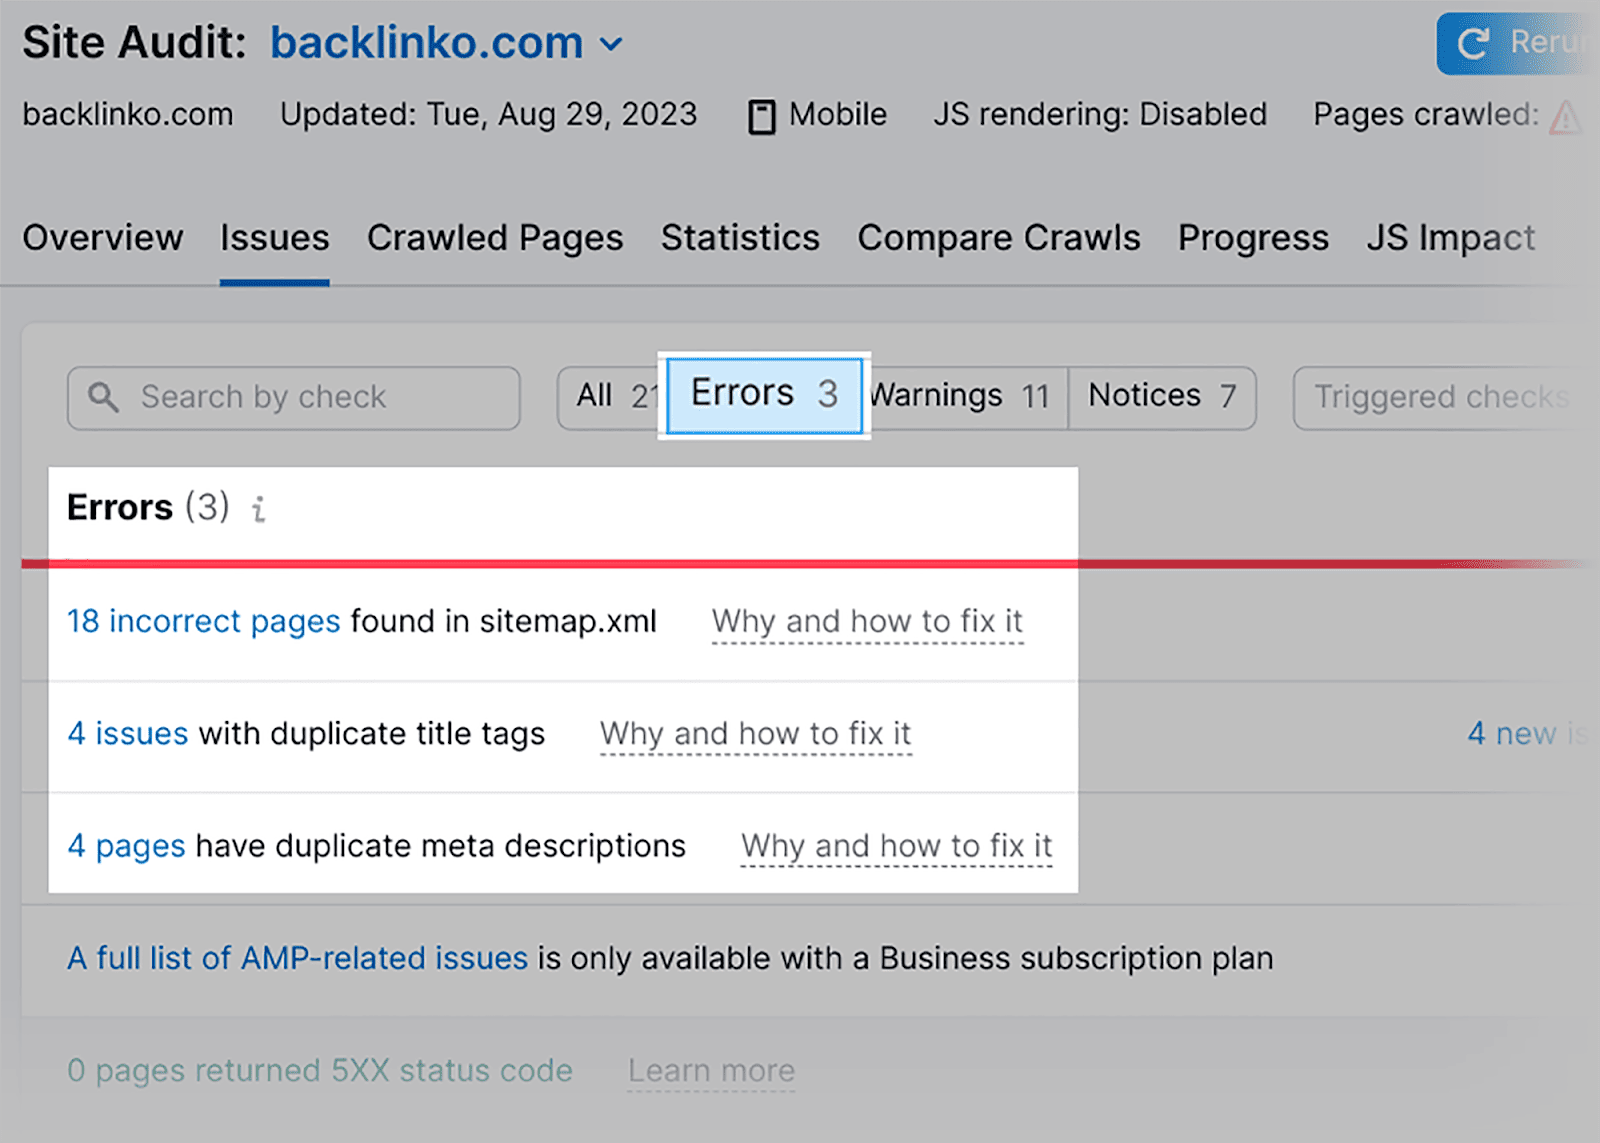
This list will include all your on-page and technical SEO issues.
If you head back to the Site Audit Overview dashboard, you can also review how other specific aspects of your site are performing, such as:
Crawlability
The Crawlability section of Site Audit lets you analyze how easy it is for search engine crawlers to navigate their way around your site.
This section focuses on determining how many of your web pages have been crawled, as well as how many of them haven’t.
It can also provide you with other insights including your page crawl depth, site indexability, crawl budget waste, and sitemap vs. crawled pages report.
If you click on “View details” under “Crawlability”:
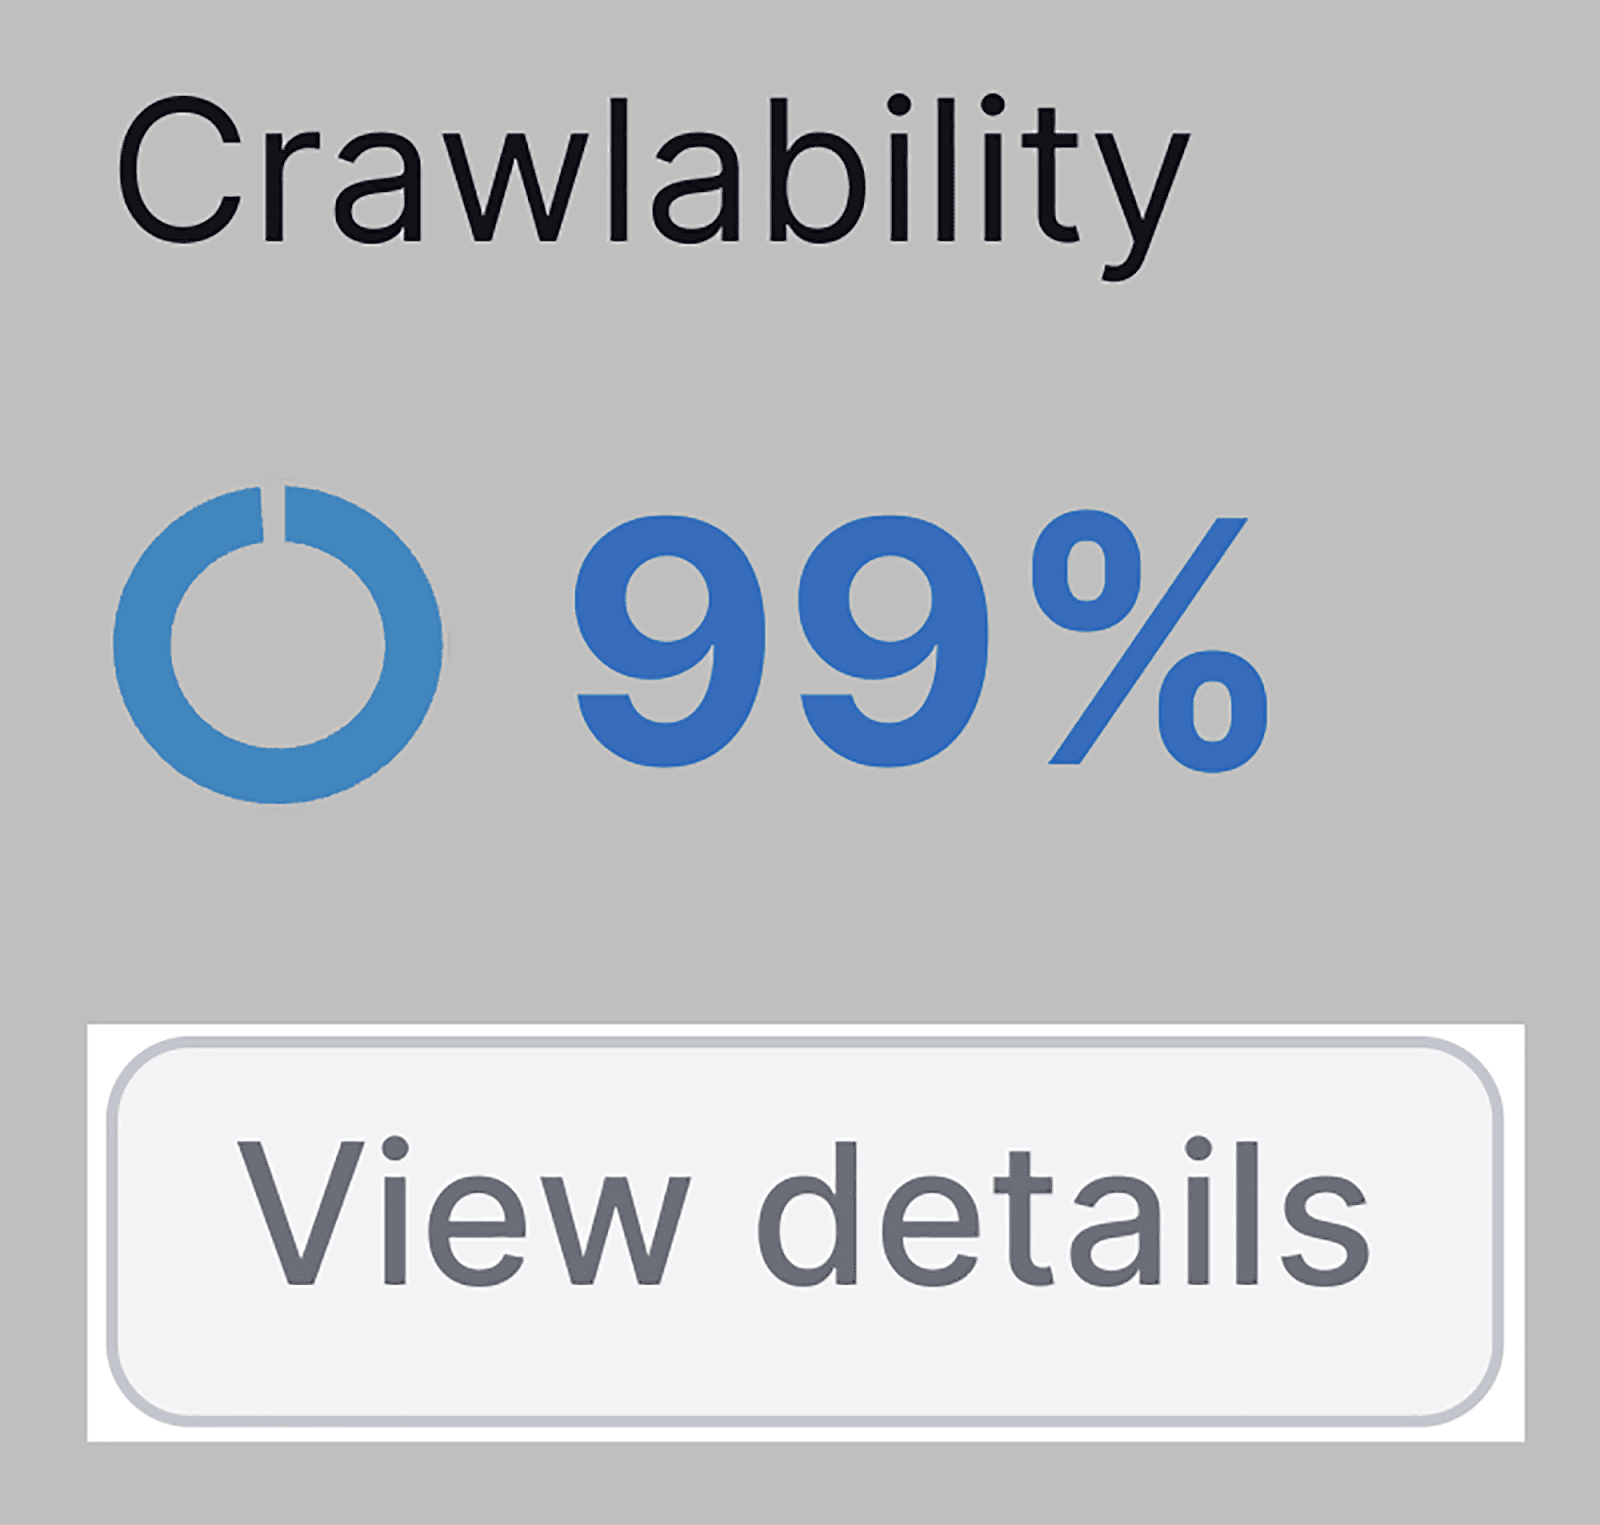
You can review the crawlability of your site at the time of the audit (in my case, it’s 99%), as well as other useful data.
For example, on the left-hand side of the crawlability dashboard, you can view your indexable pages vs. non-indexable pages ratio:
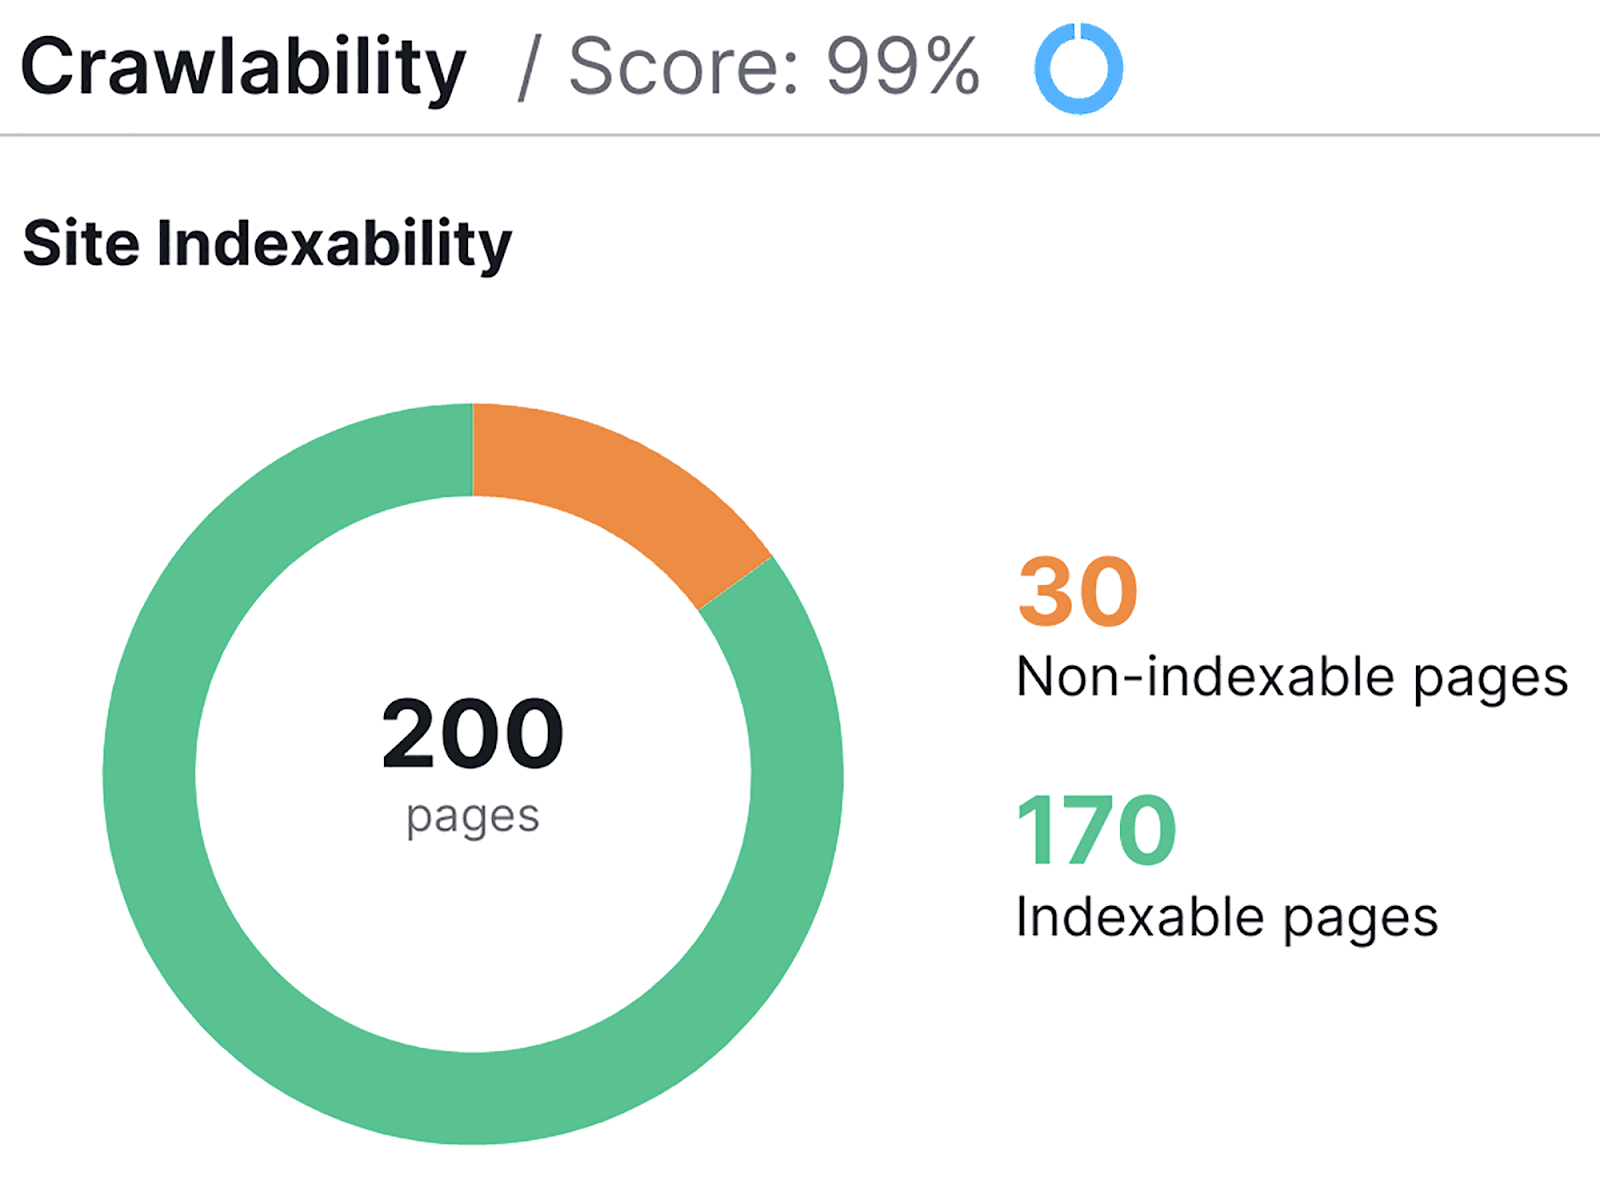
One of the best parts of the Crawlability section is that you don’t even need to manually go and figure out why your pages are non-indexable.
Instead, all you have to do is look at the “Crawl Budget Waste” list on the right-hand side:
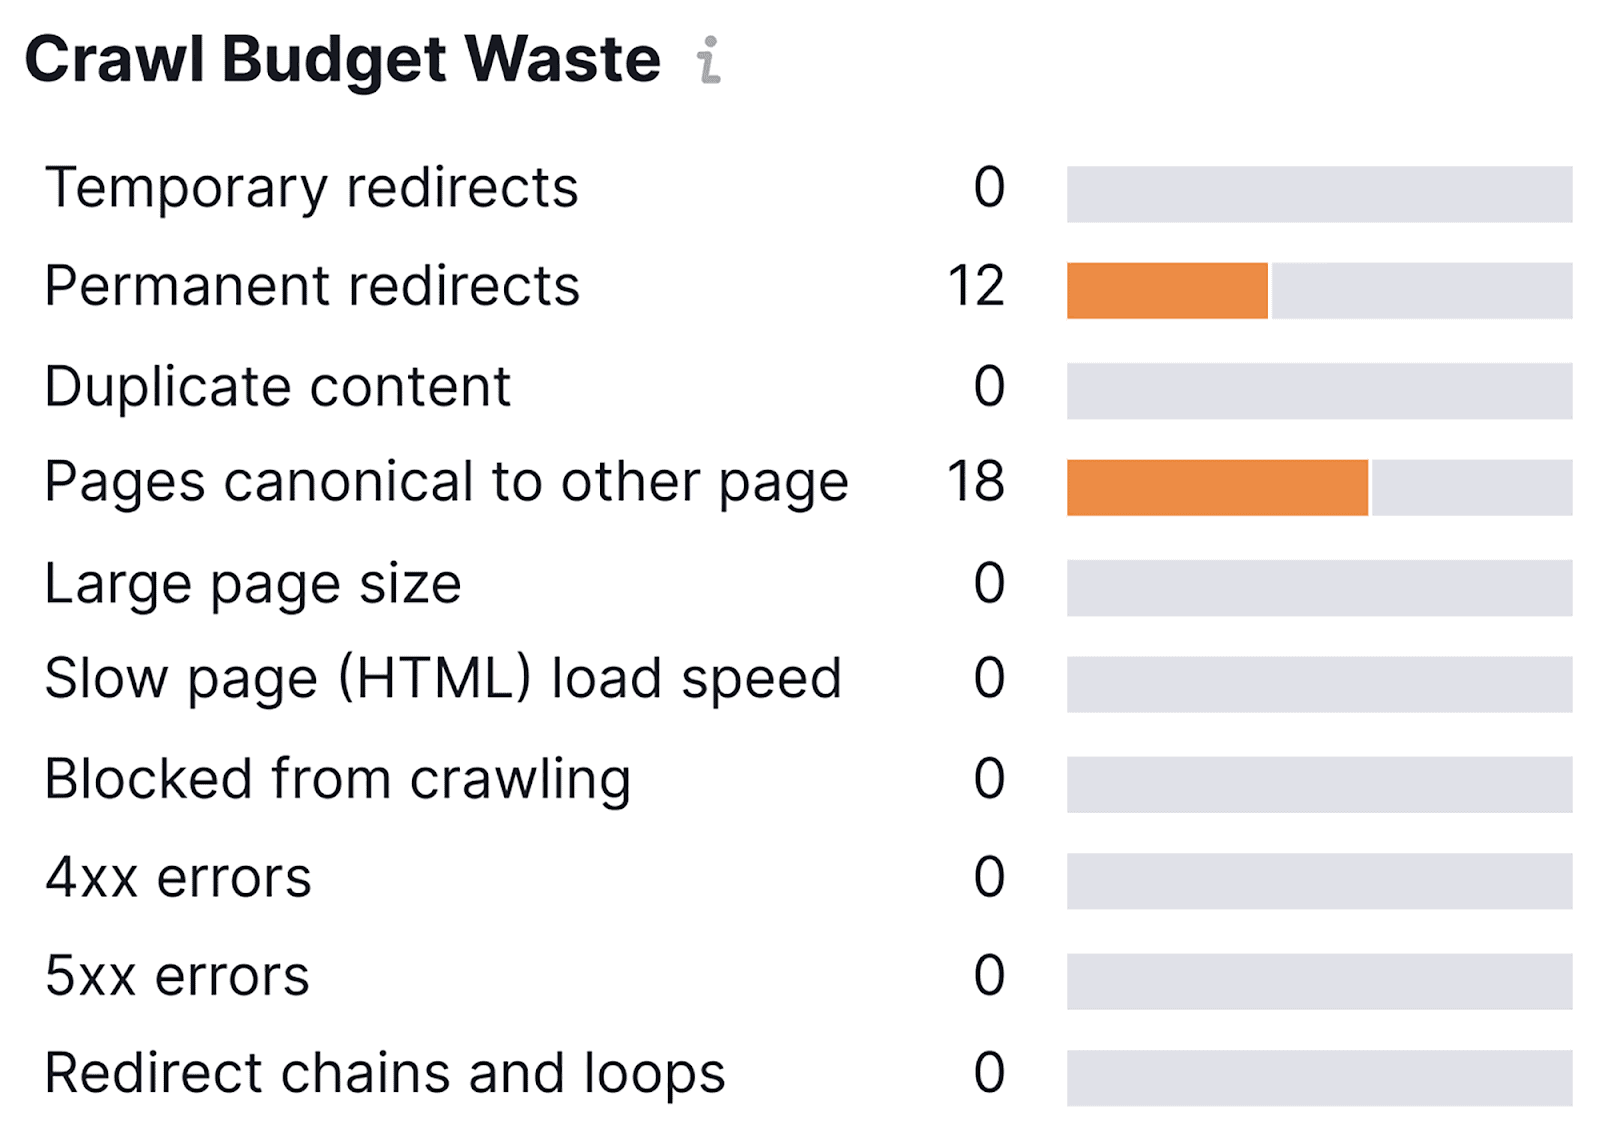
This explains the reasons why 30 of my pages are non-indexable.
The Page Crawl Depth graph displays how many clicks it takes to reach all of your pages from your homepage:
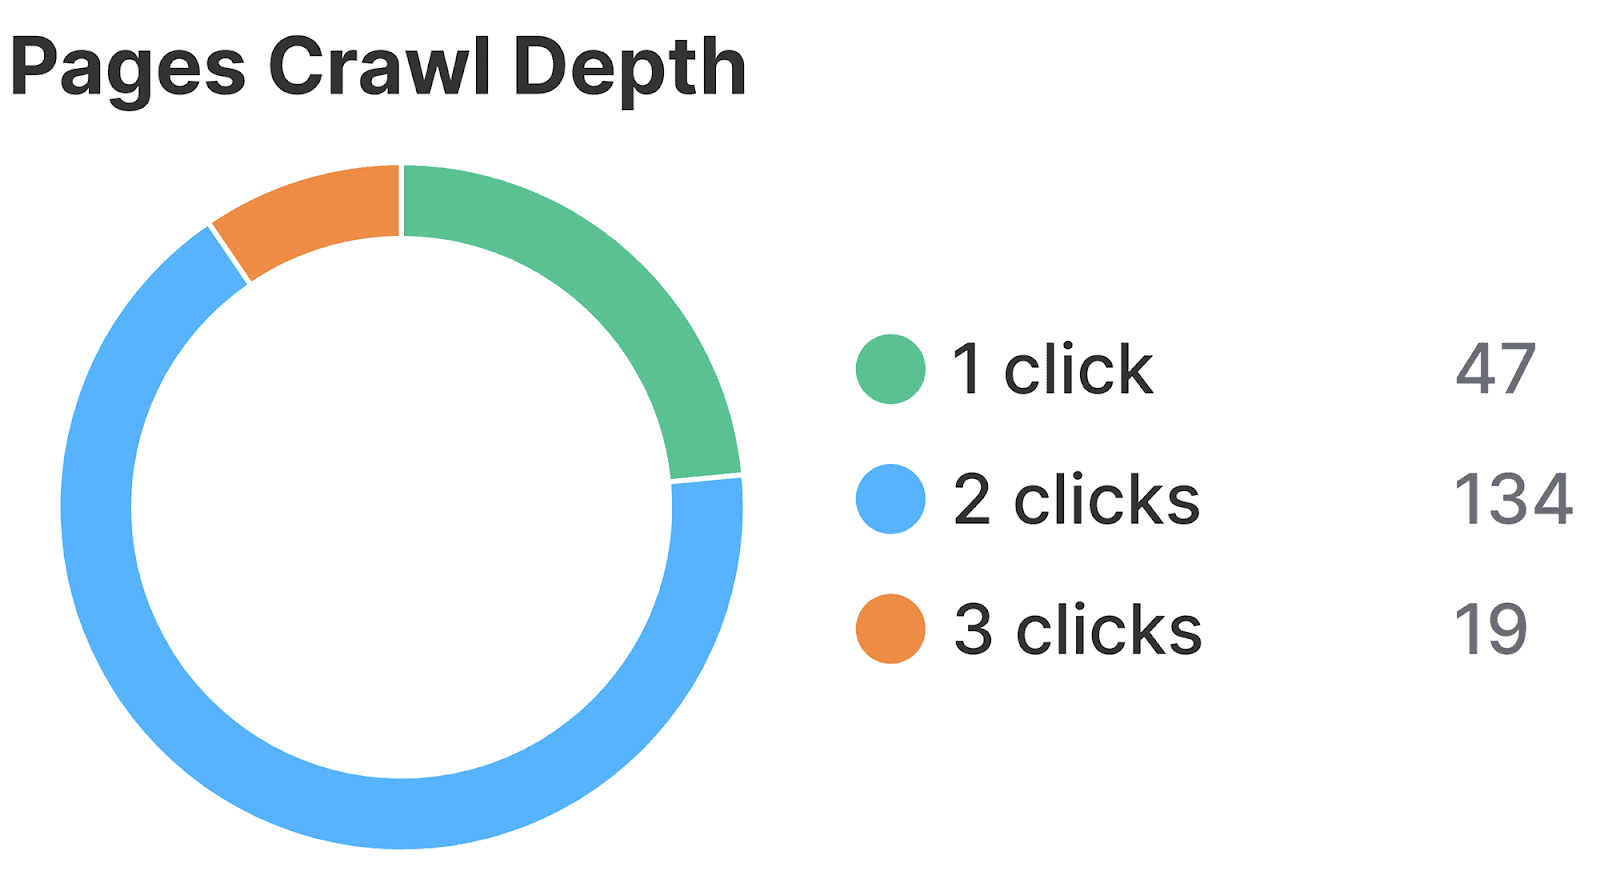
For navigational reasons, you want to make sure all your important pages have a click depth of 1 or 2 clicks. 3 clicks is the maximum recommended click depth you should have for a page. However, this is only suitable for pages of lesser importance.
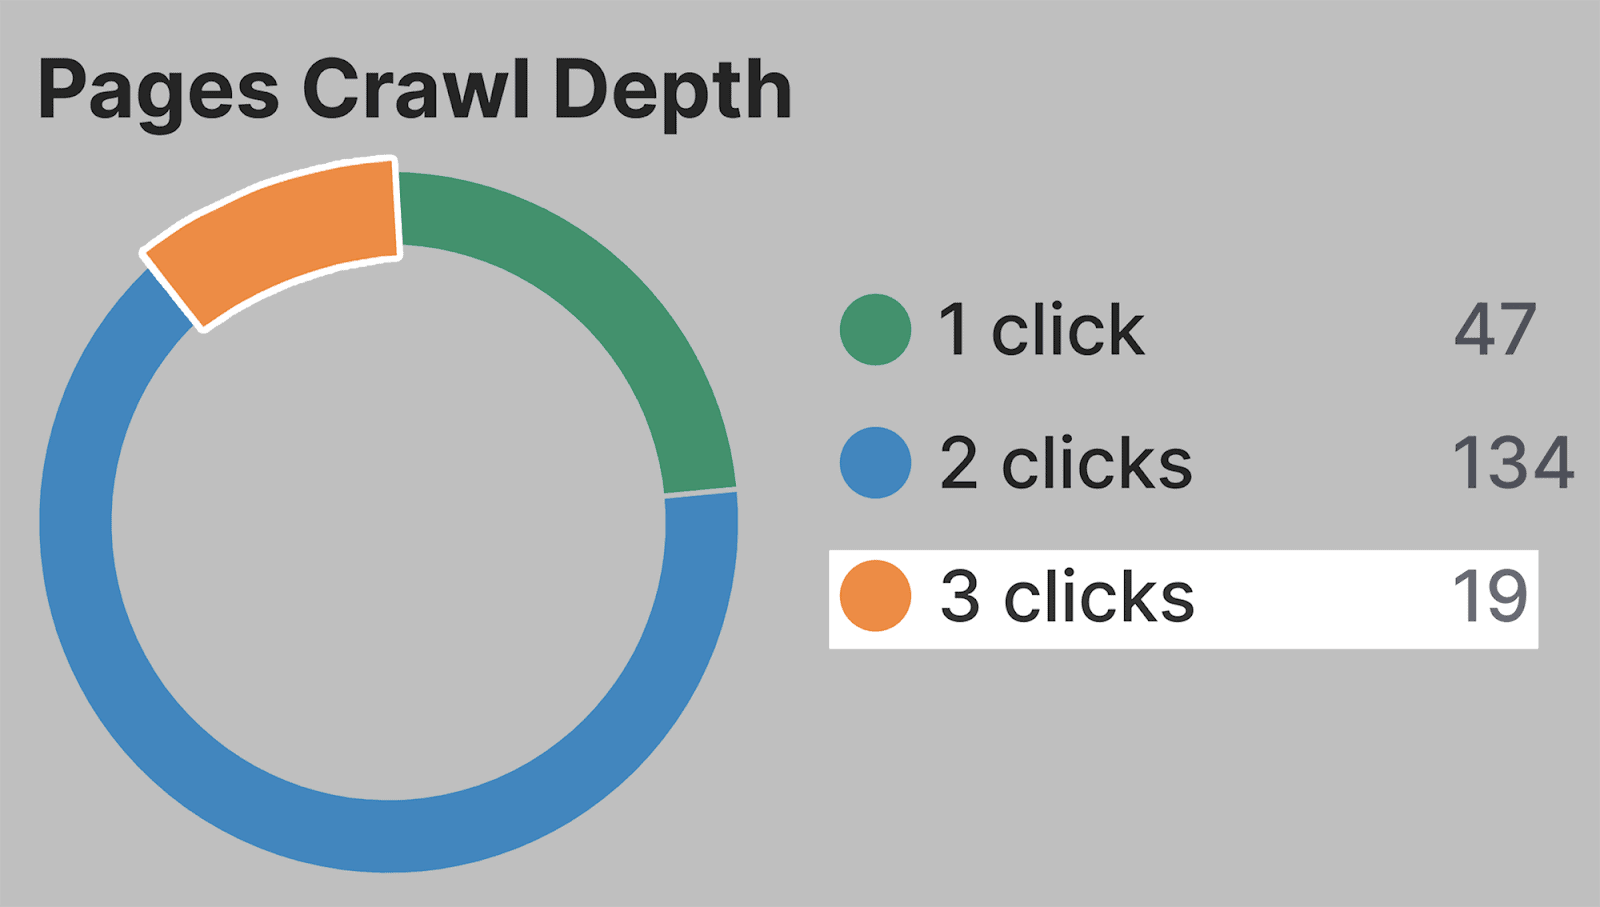
If you’re worried about click depth, you can click right onto the part of the chart you’re most concerned about.
For example, if I wanted to check which pages have a click depth of 3, I can click on the orange part of the graph:
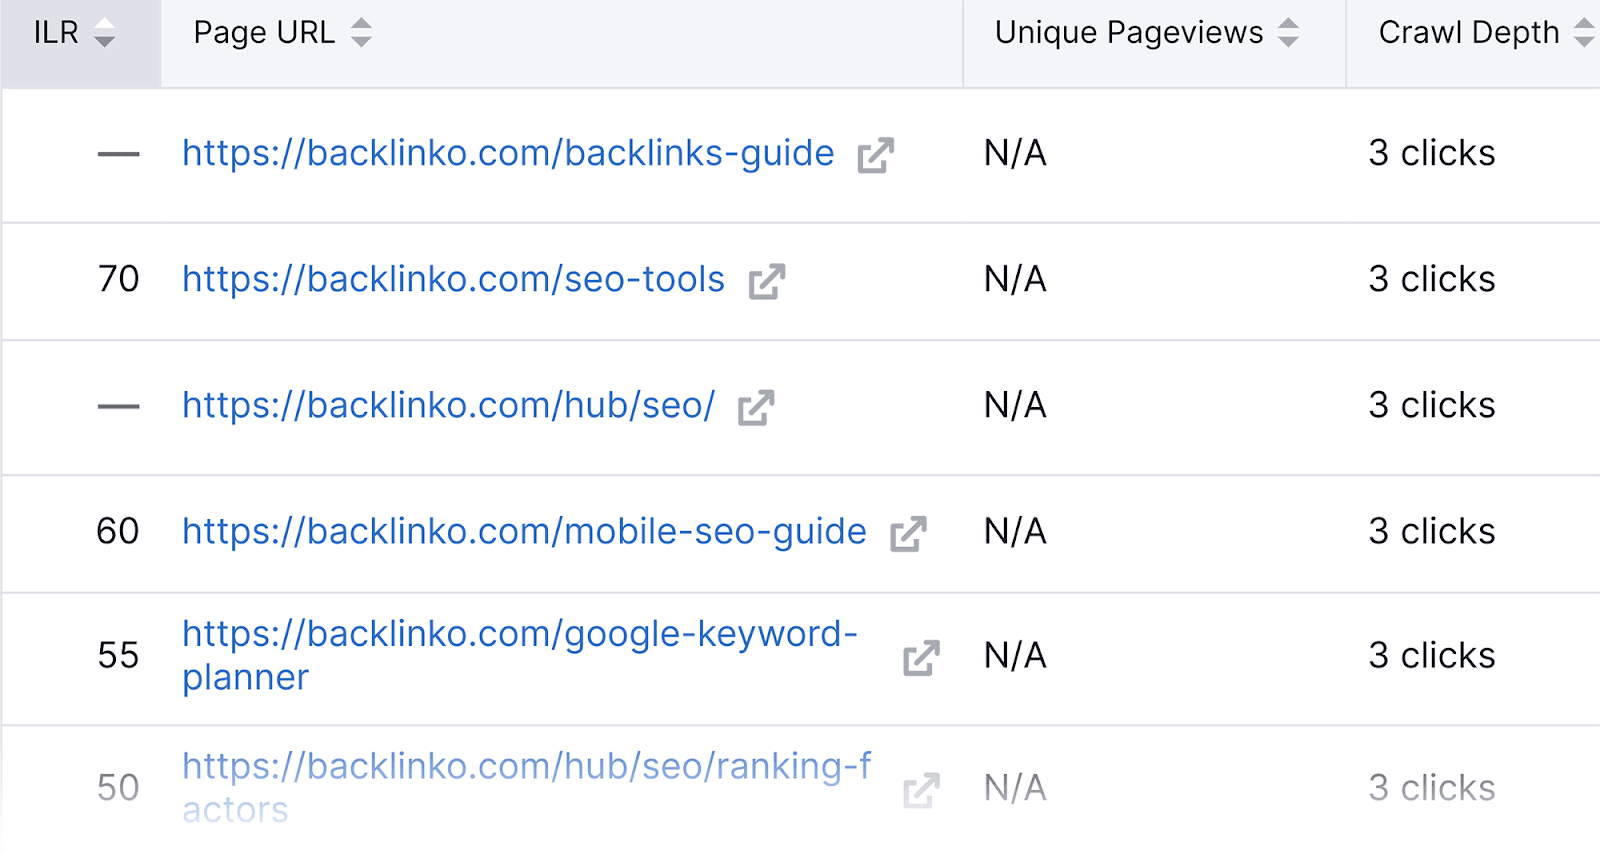
I’ll then be presented with a list of all of my pages that currently have a click depth of this level:
Another useful graph in this section is Sitemap vs. Crawled Pages:
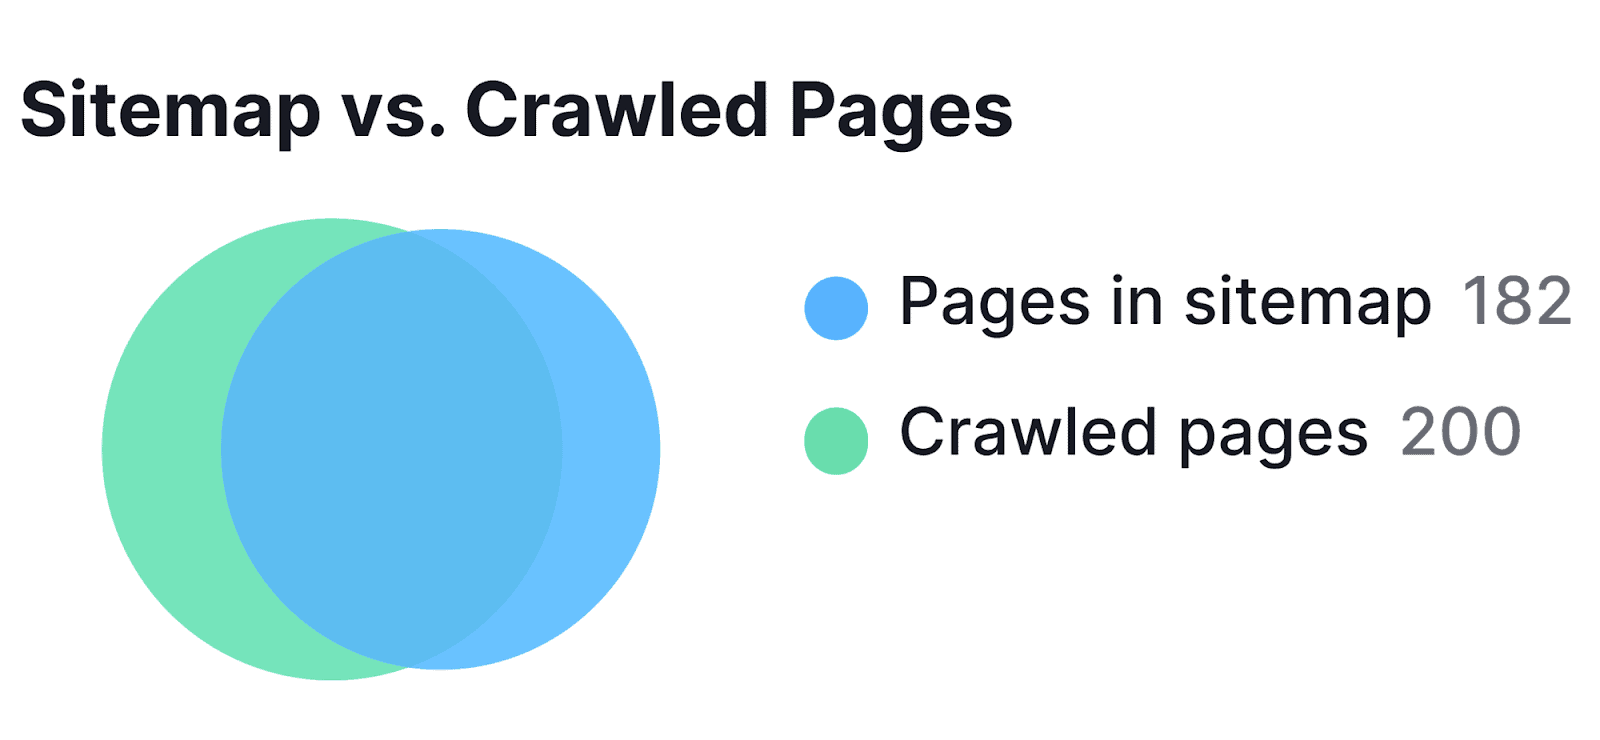
This graph represents the number of pages listed in your sitemap compared to how many pages on your site have actually been successfully crawled.
This means that not all the pages you have intended to be crawled have been crawled. This could be because your site’s crawl budget was finished. If this is the case, you should check the Crawl Budget Waste list I mentioned earlier to find out the source of the crawl issues.
Like most aspects of Semrush, if you need to export the data found in this section, simply hit the PDF button at the top right-hand side of the page:

You’ll even be able to automate daily, weekly, and monthly reports.
HTTPS
Google has long been encouraging websites to switch from HTTP to HTTPS as the latter provides better privacy and security for site visitors.
By implementing an SSL certificate on your website, you transition from HTTP to HTTPS. Therefore, you’re providing a more secure browsing experience for your visitors. Plus, Google will view your site as being more trustworthy, which could help to boost your rankings.
So, it’s important to switch from HTTP to HTTPS — it’s also important to monitor your HTTPS implementation.
How do you do that? You can hit the “View details” button in the HTTPS widget on the Site Audit dashboard.
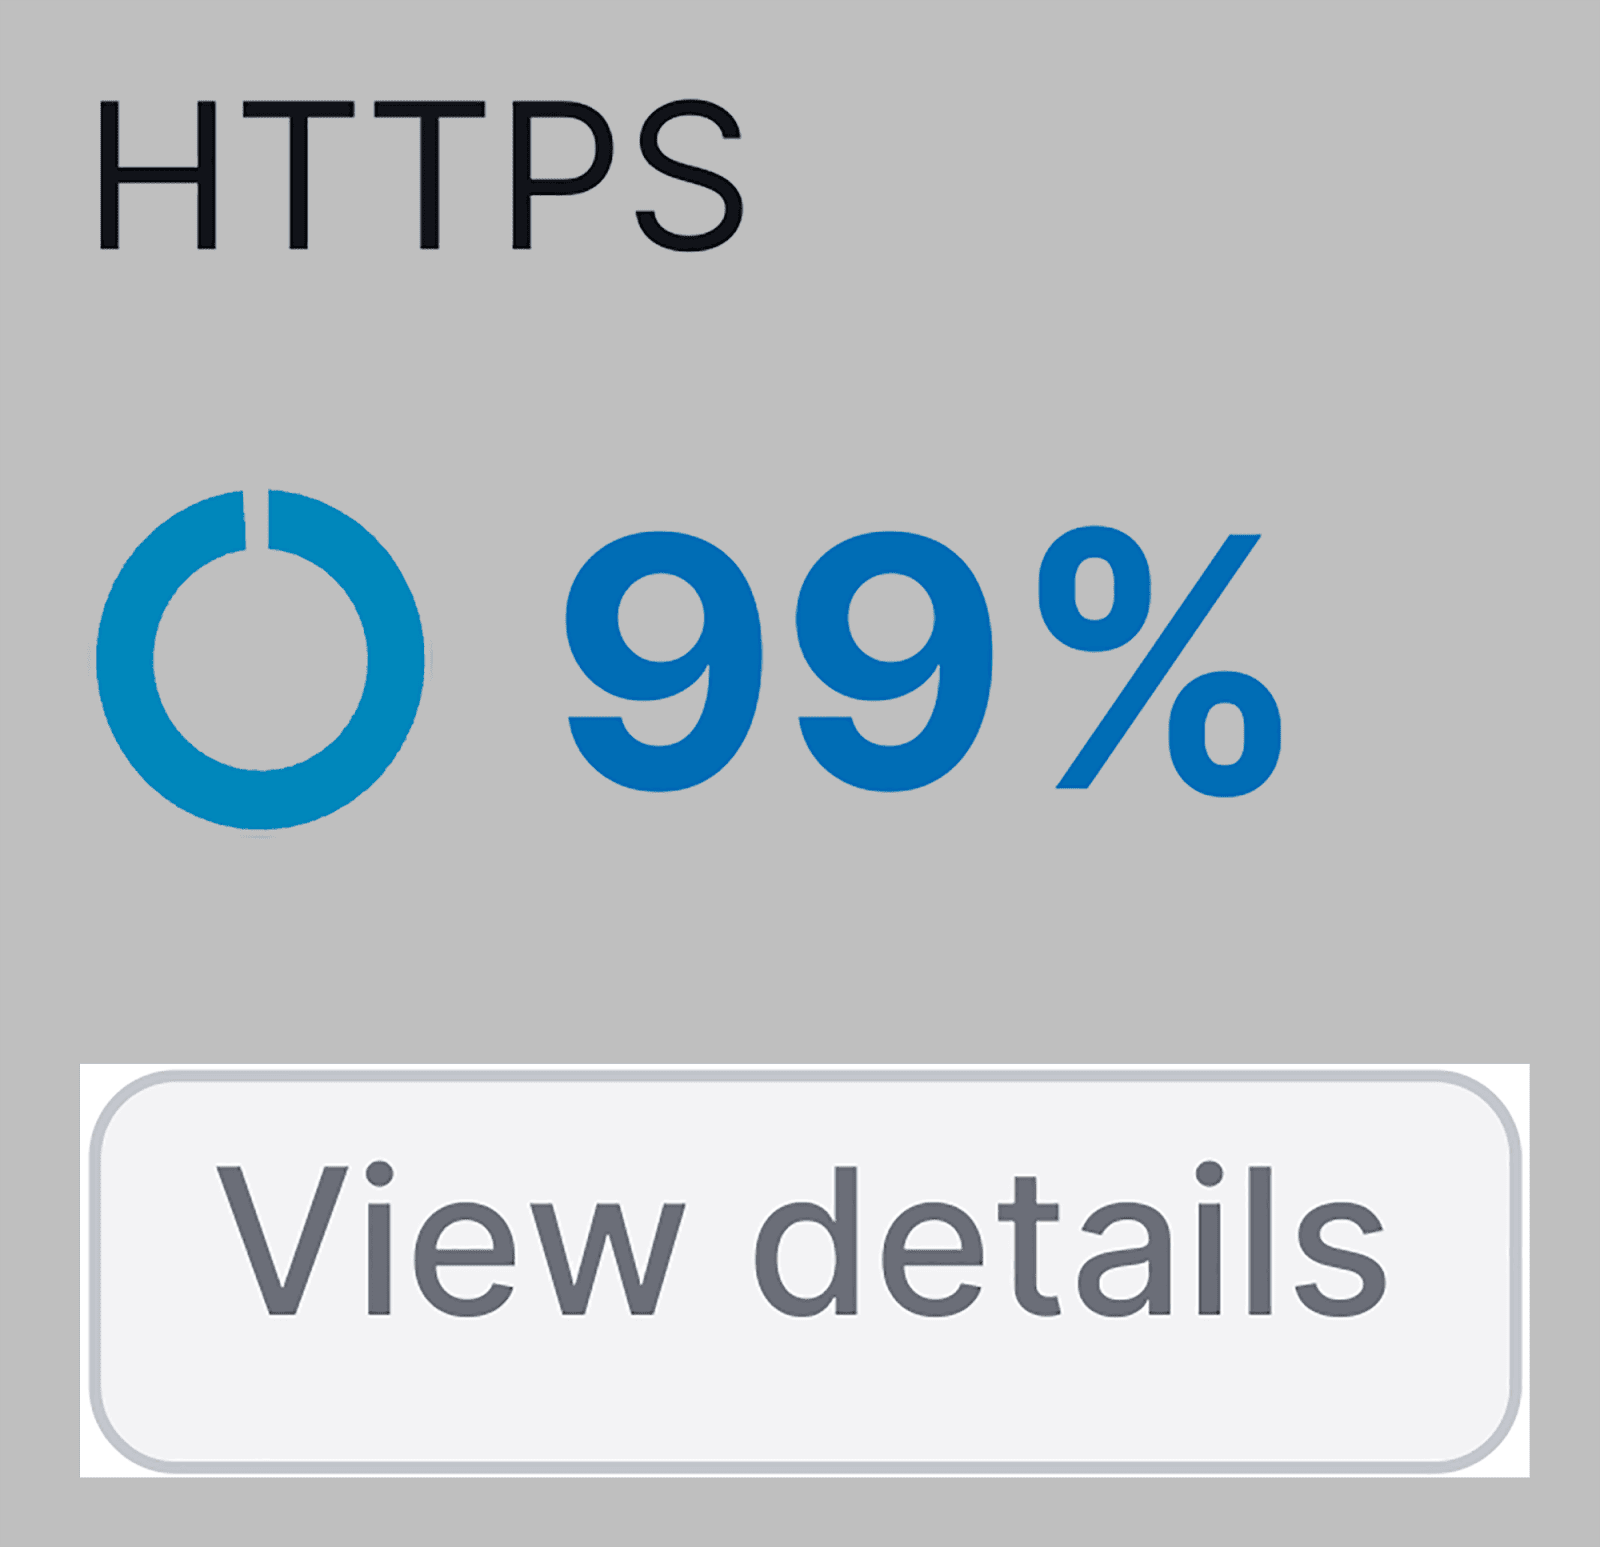
Here, you’ll be given a breakdown of your HTTPS implementation on your site.
For example, I currently have several HTTPs issues under the Website Architecture section:
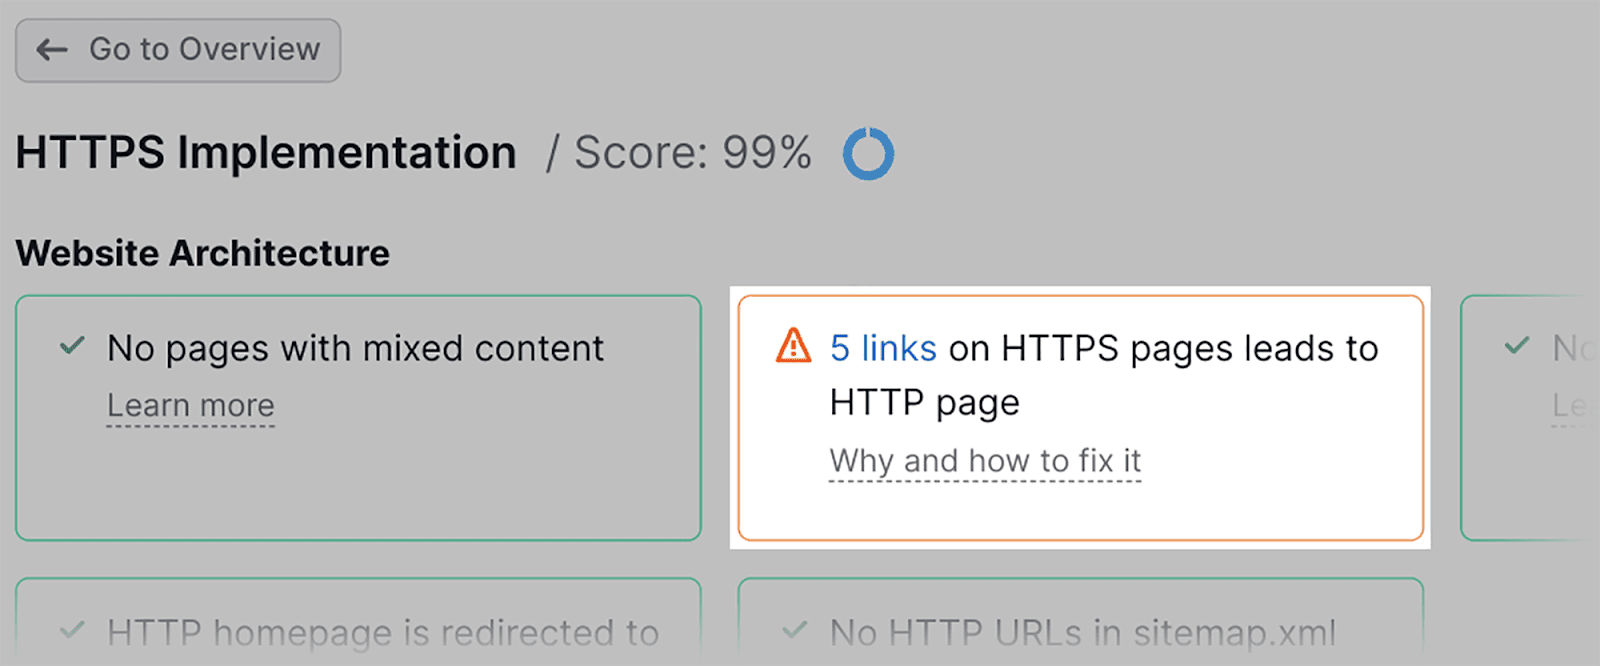
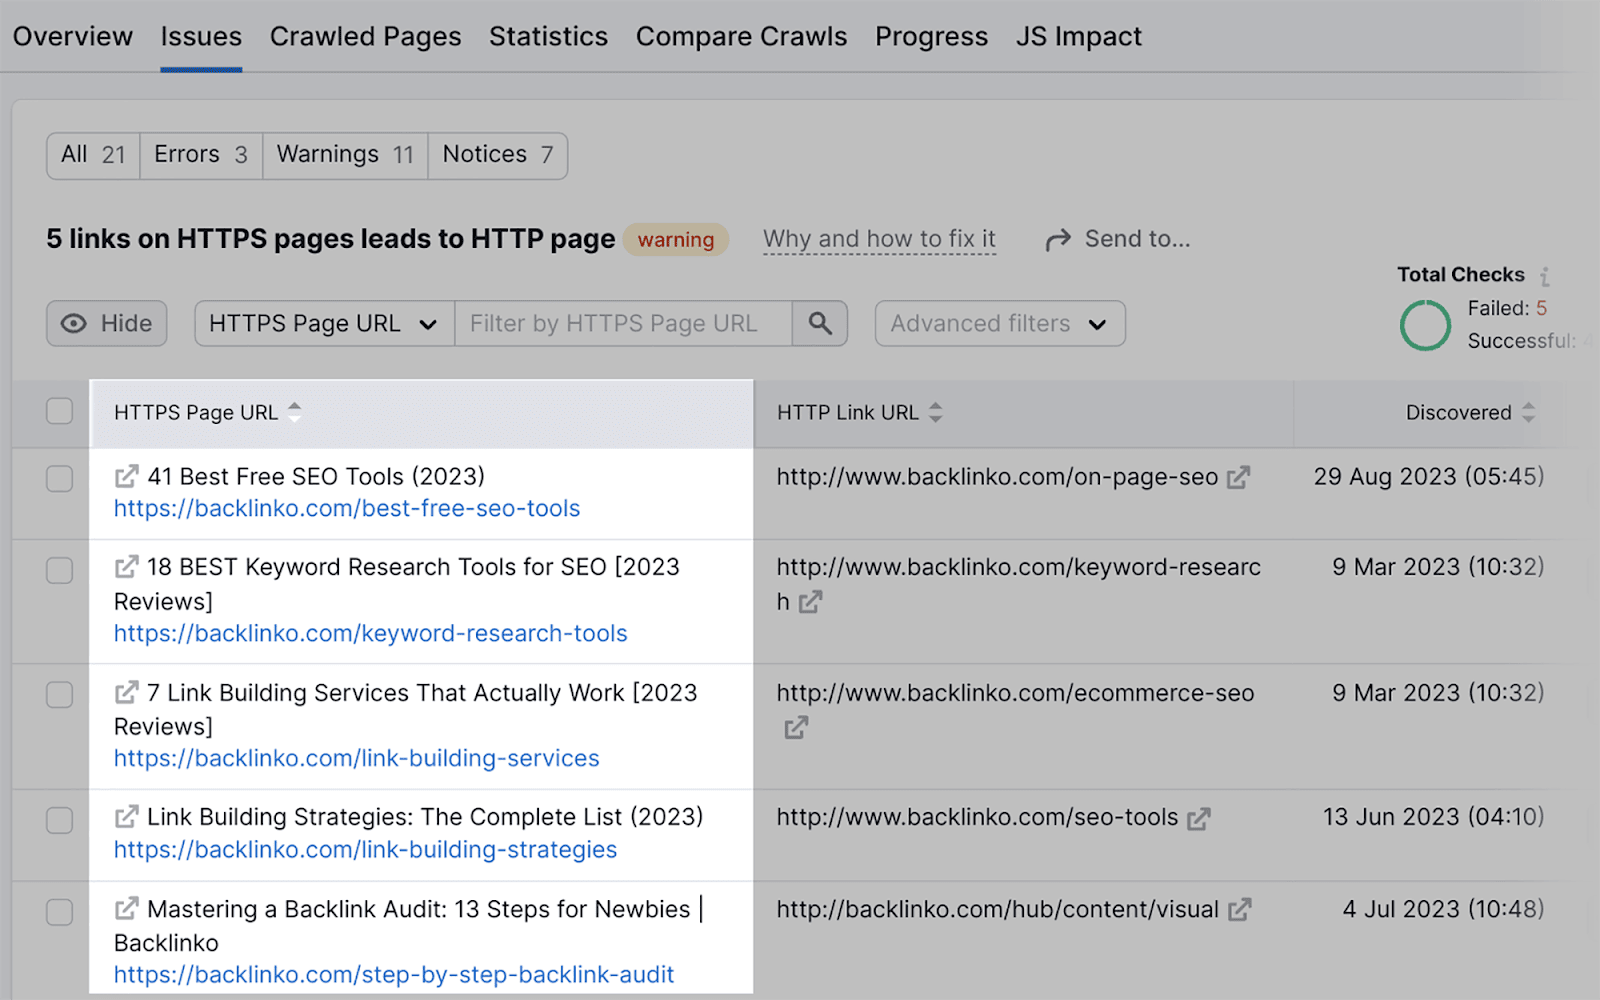
By clicking on this warning, I can identify the specific URLs that require attention and need to be addressed:
Site Performance
When you click on “View details” in the Site Performance widget…
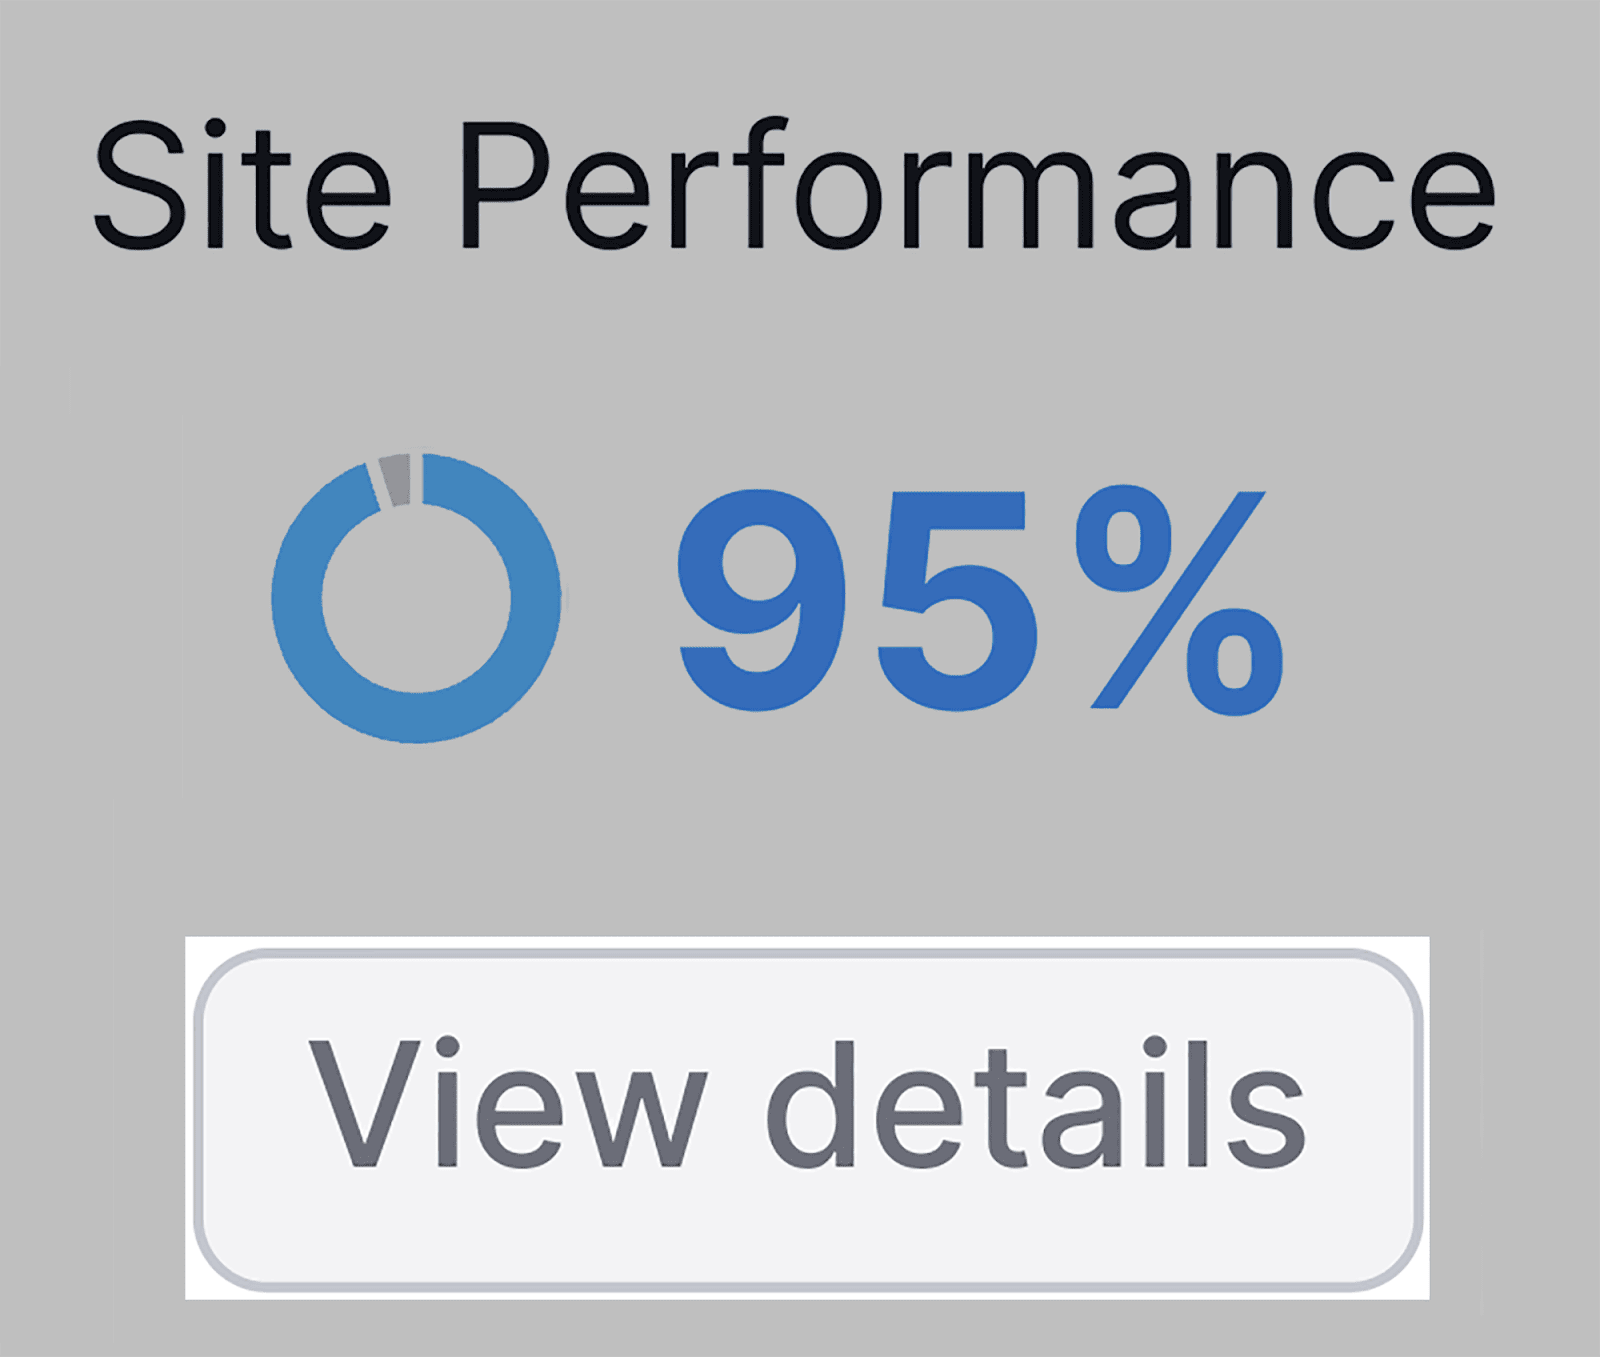
…you’ll be able to view your page load speeds and examine your website’s CSS and Javascript usage in order to determine your page’s current load speeds.
Your total load speeds are displayed in the Page (HTML) load speed graph:
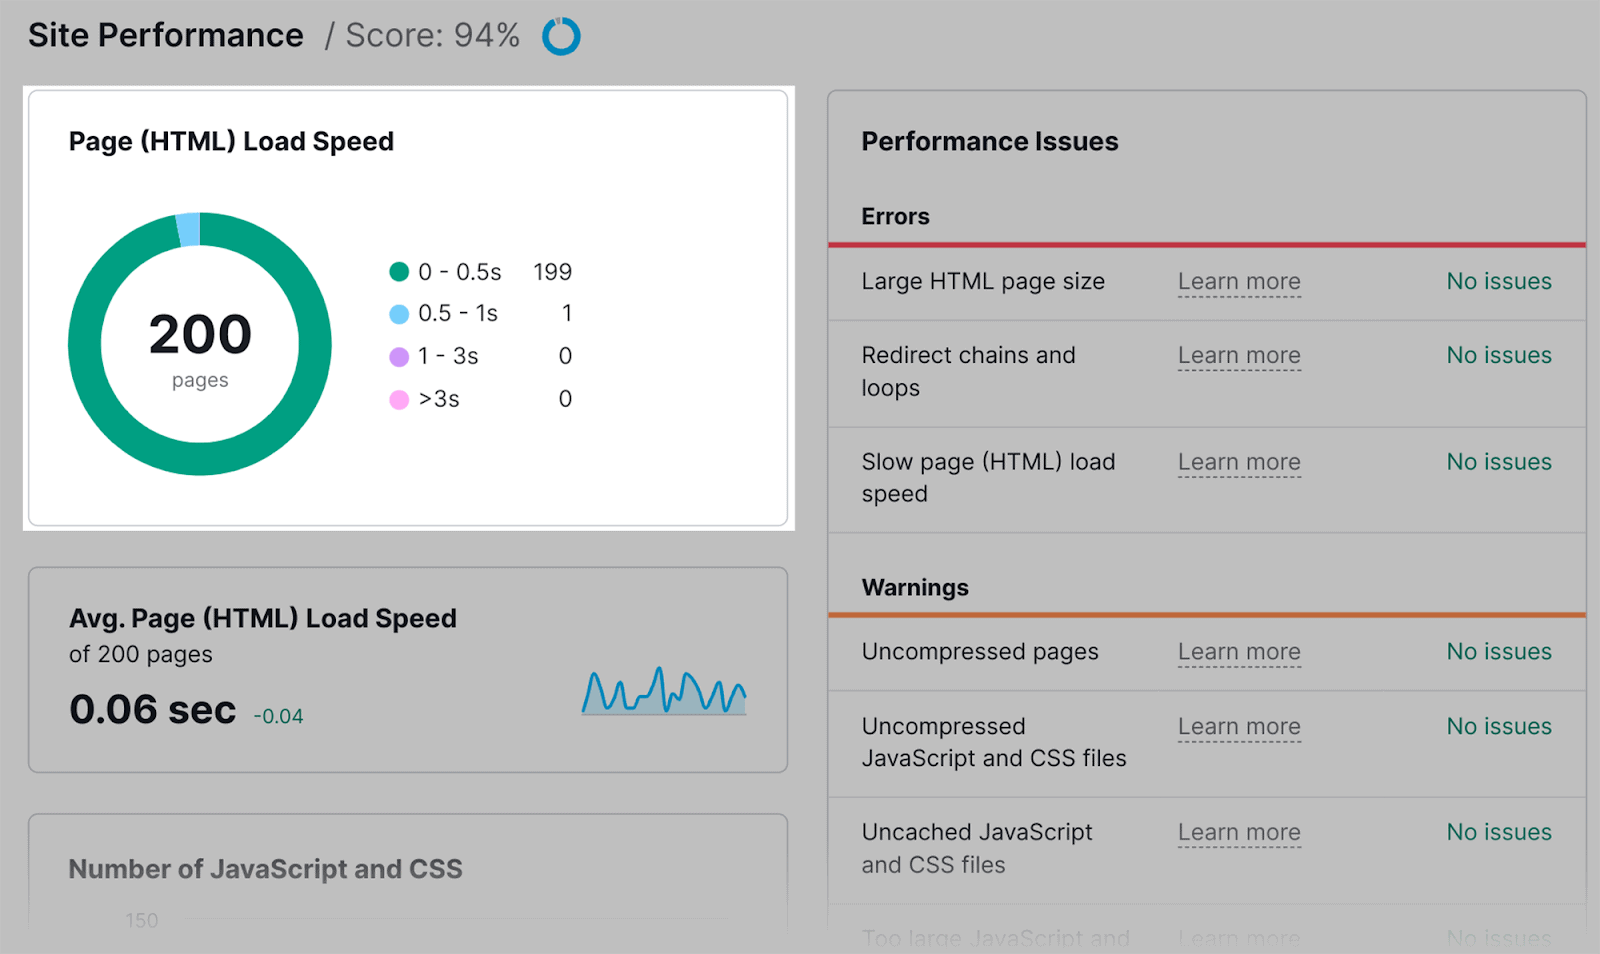
0-0.5s is considered optimal page speed loading time. As you can see, 199 of my pages are in this range.
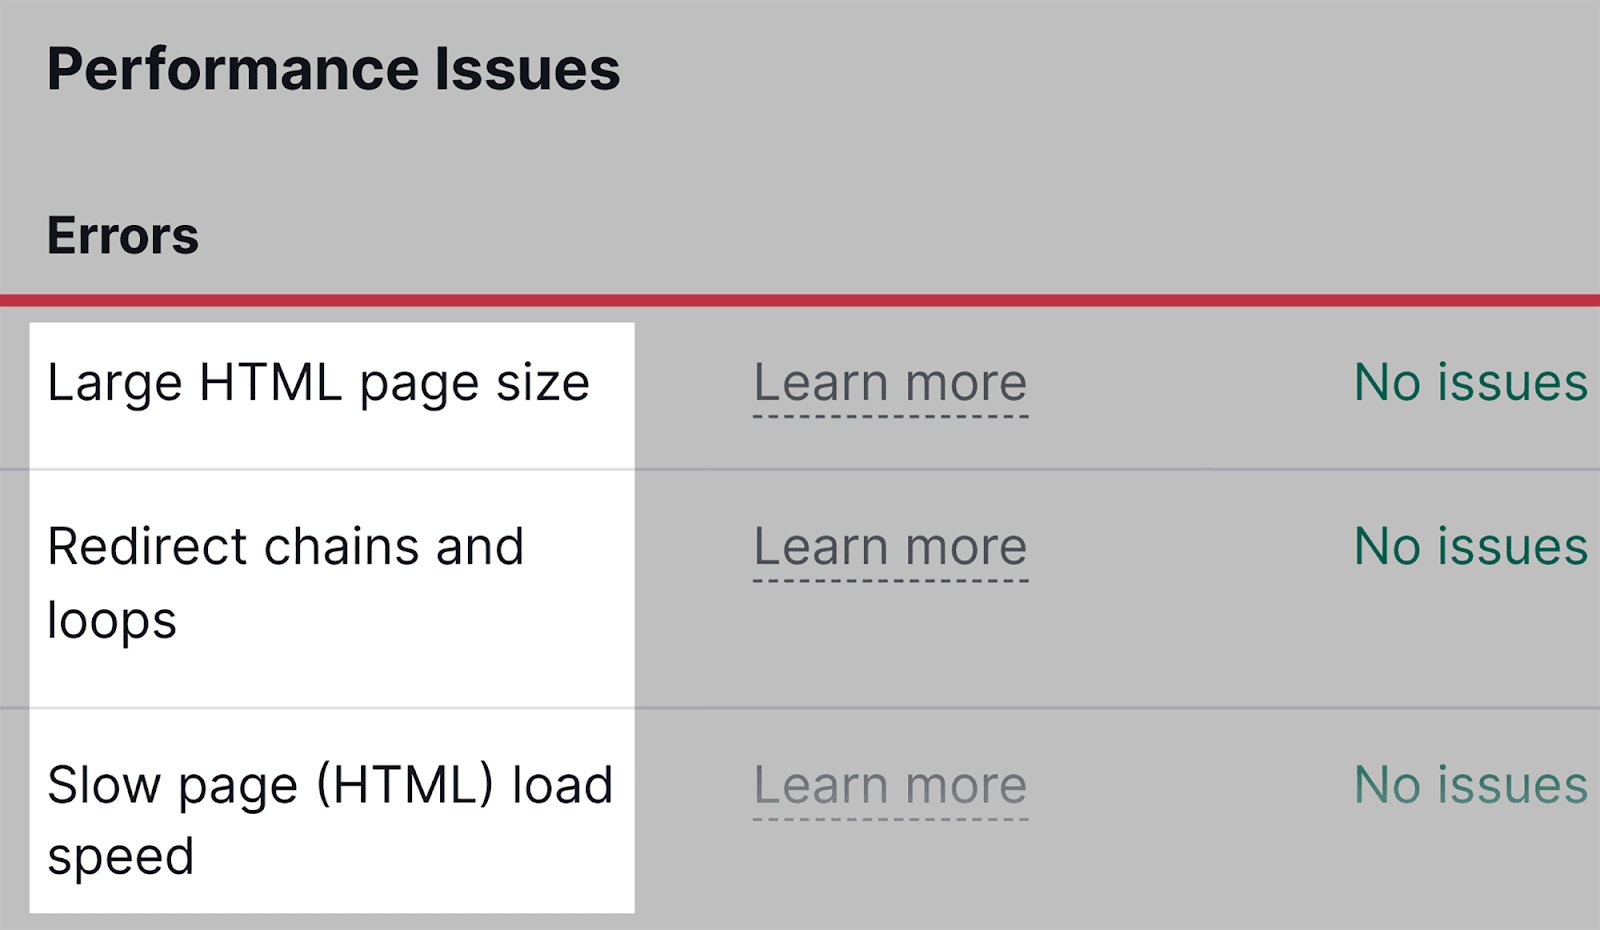
In the Performance Issues table on the right, I can review any issues my site is experiencing.
For example, I can identify which of my site’s pages have large HTML page sizes, redirect chains and loops, or slow page (HTML) load speeds:
Internal linking
I’ve already shown you how the Site Audit tool can help you find and fix broken internal links. Now, I’m going to show you the other Errors, Warnings, and Notices you can analyze in the Internal Linking report.
Firstly, click “View details” in the Internal Linking widget:
In the “Warnings” section, you can review errors that may cause issues for your domain at some point down the line. This includes:
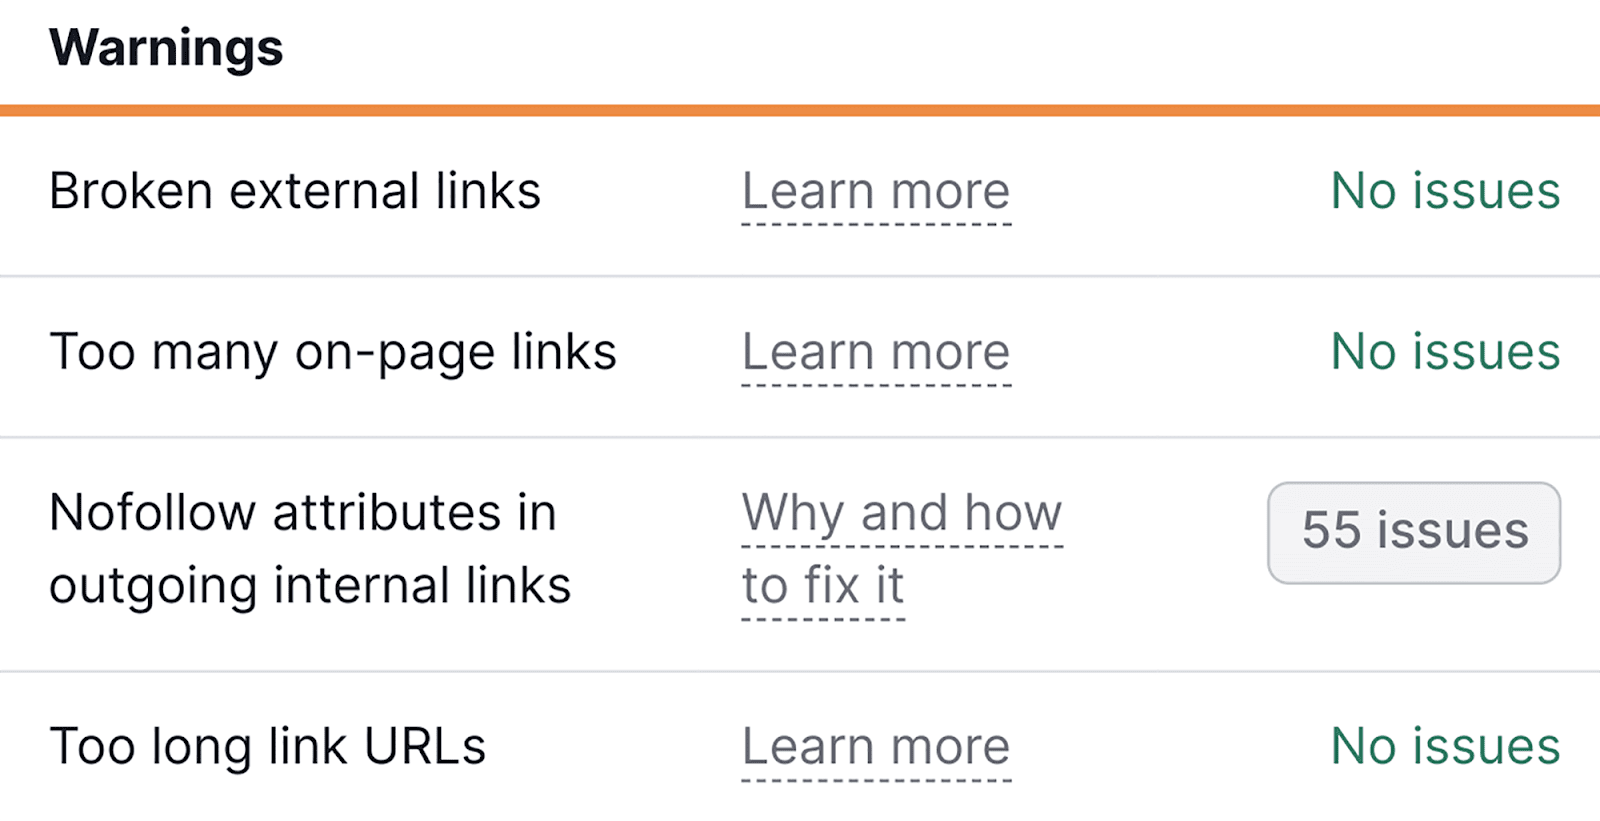
- Having too many links on one page — Overstuffing internal links into your content can make it appear spammy and confuse the user. Ideally, you should only have between 5-10 internal links per 2,000 words.
- Nofollow attributes in outgoing internal links — If one of your internal links has the rel = “nofollow” attribute set, then web crawlers will not follow this internal link. This would be bad if you’re trying to get the linked page indexed.
- Having too long link URLs — You need to make sure that your URLs aren’t too long. Real issues occur when your URLs exceed 2,000 characters. They can cause load issues, crawling, and indexing problems, and also make them difficult for web users to read and share.
Below, you’ll also be able to review the “Notices” section:
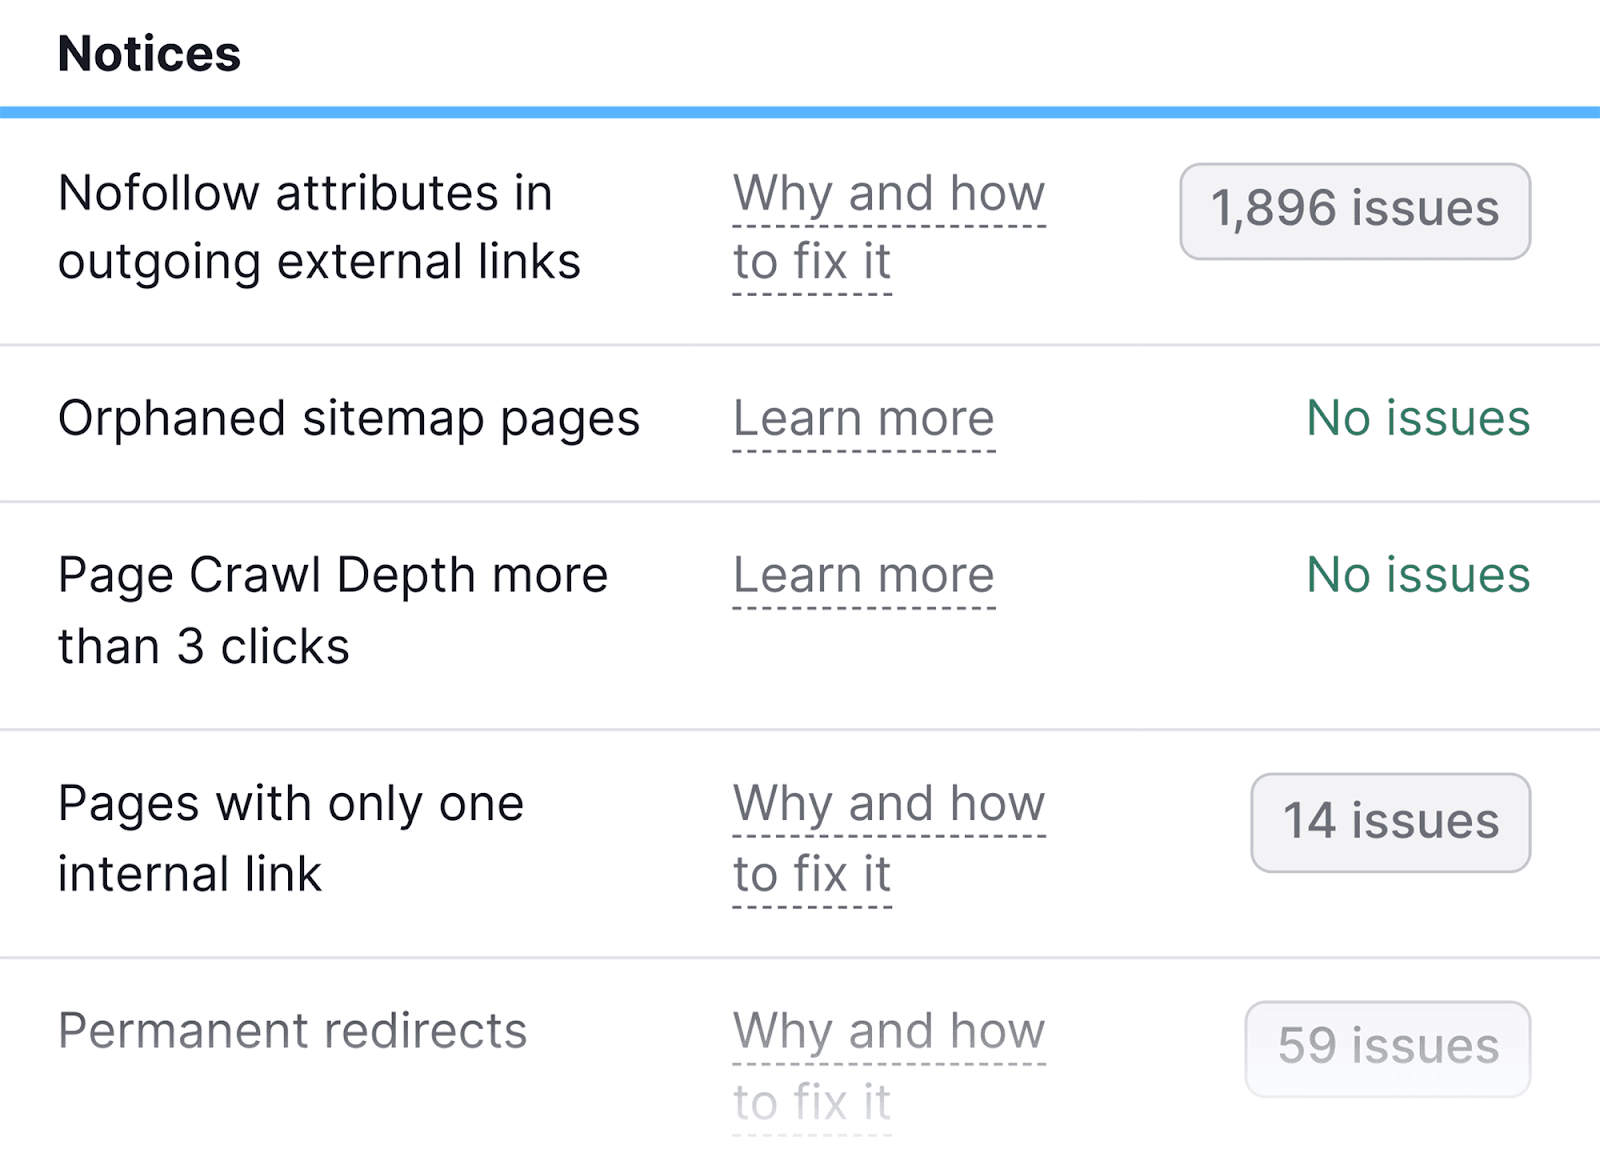
Notices, like Warnings, aren’t as pressing as your internal link errors, but are still worth adding to your to-do list.
Markup
Schema markup is a microdata language that search engines can interpret. It can be used to create rich snippets in the search results, such as:

If you’ve attempted to implement schema markup on your web pages, you’ll likely want to know if the implementation was successful.
Instead of manually searching for each blog post you’ve added schema markup code to, you could automate your check by going to the Markup section of Semrush’s Site Audit.
On the “Markup” widget, click “View details”:
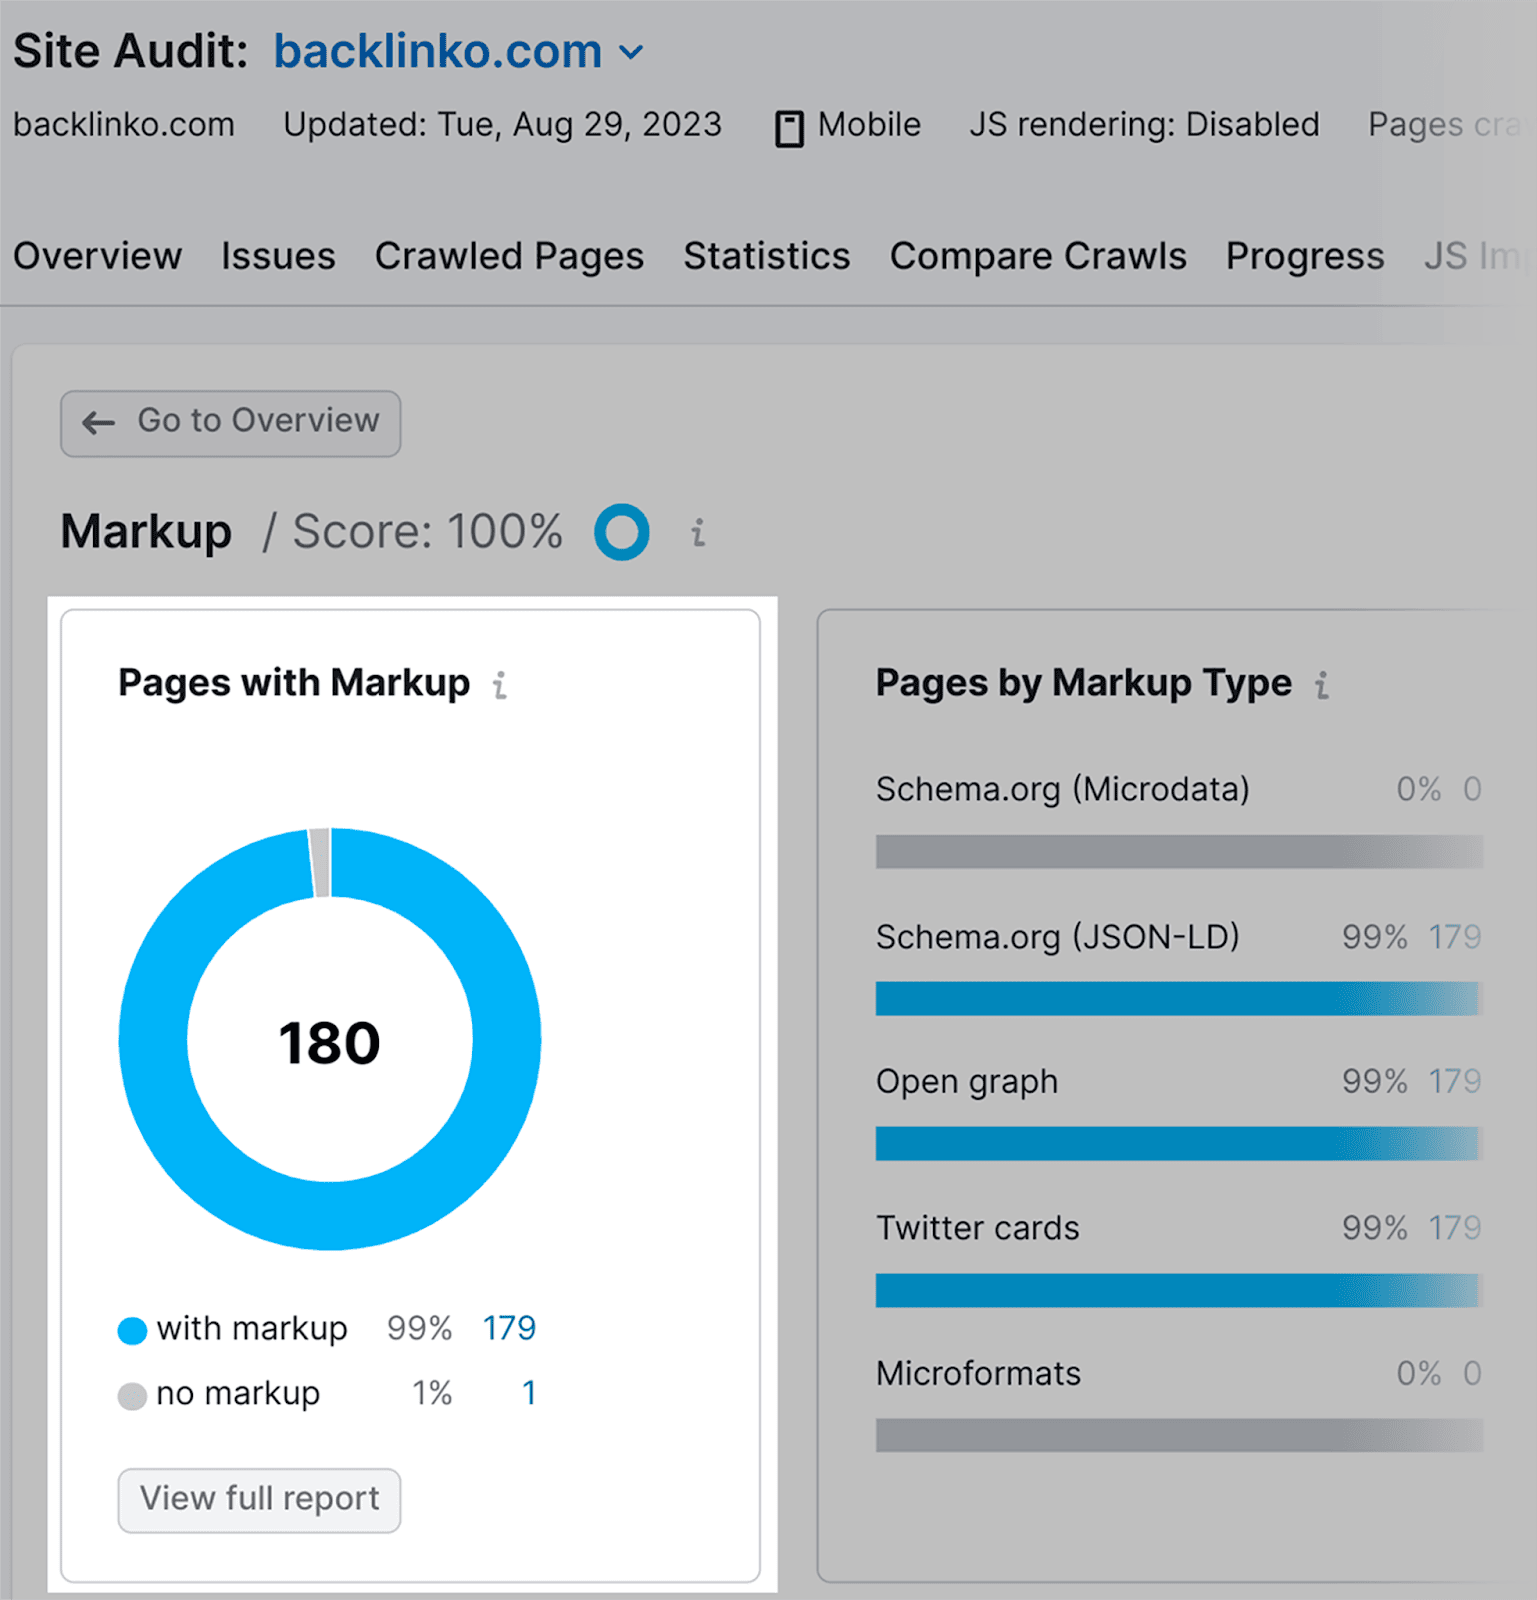
You can now check which pages have schema markup and which ones don’t:
Click on the “with markup” number:
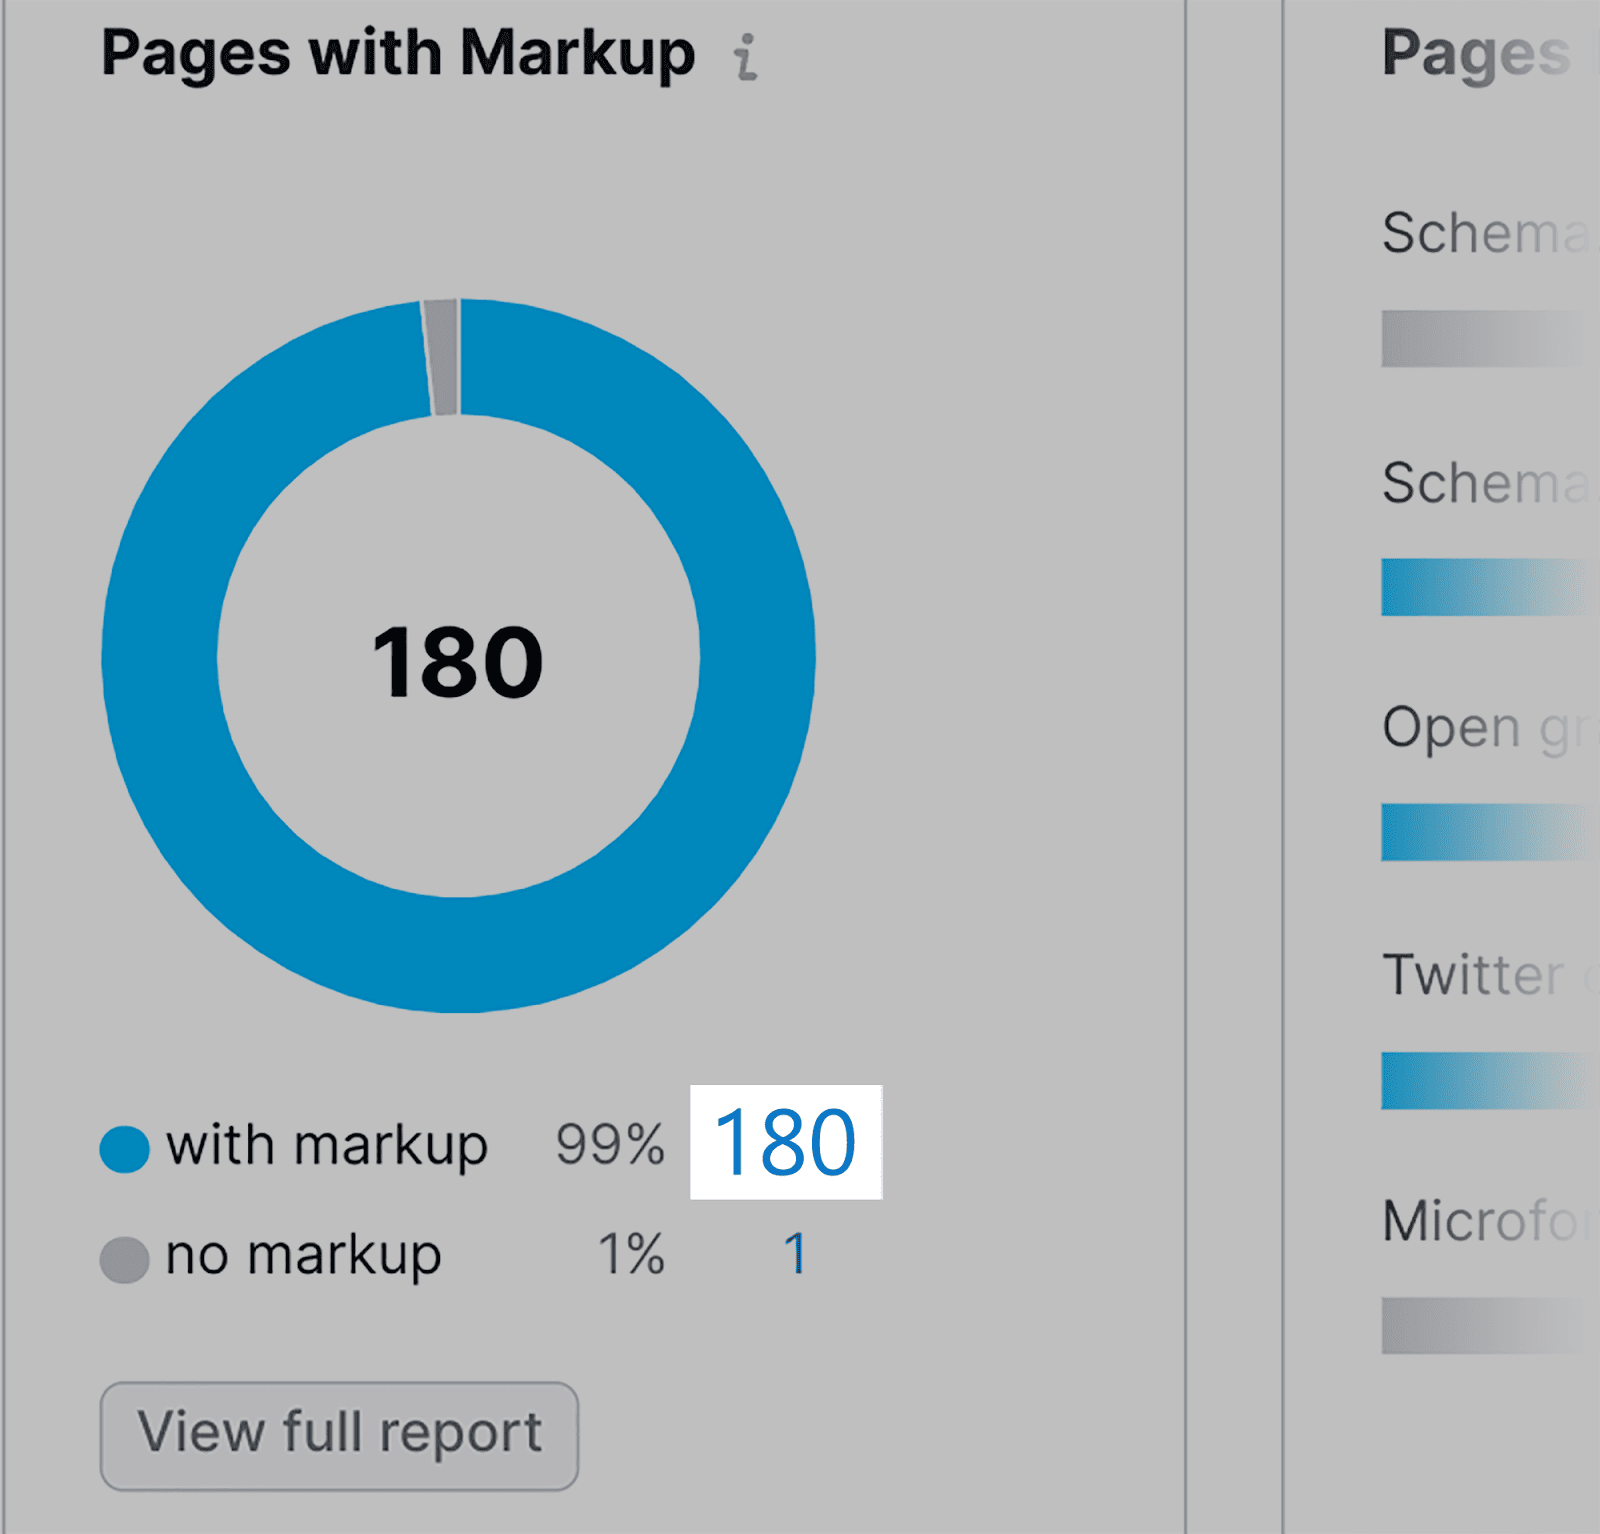
You’ll be able to review all the pages on your site that feature markup:
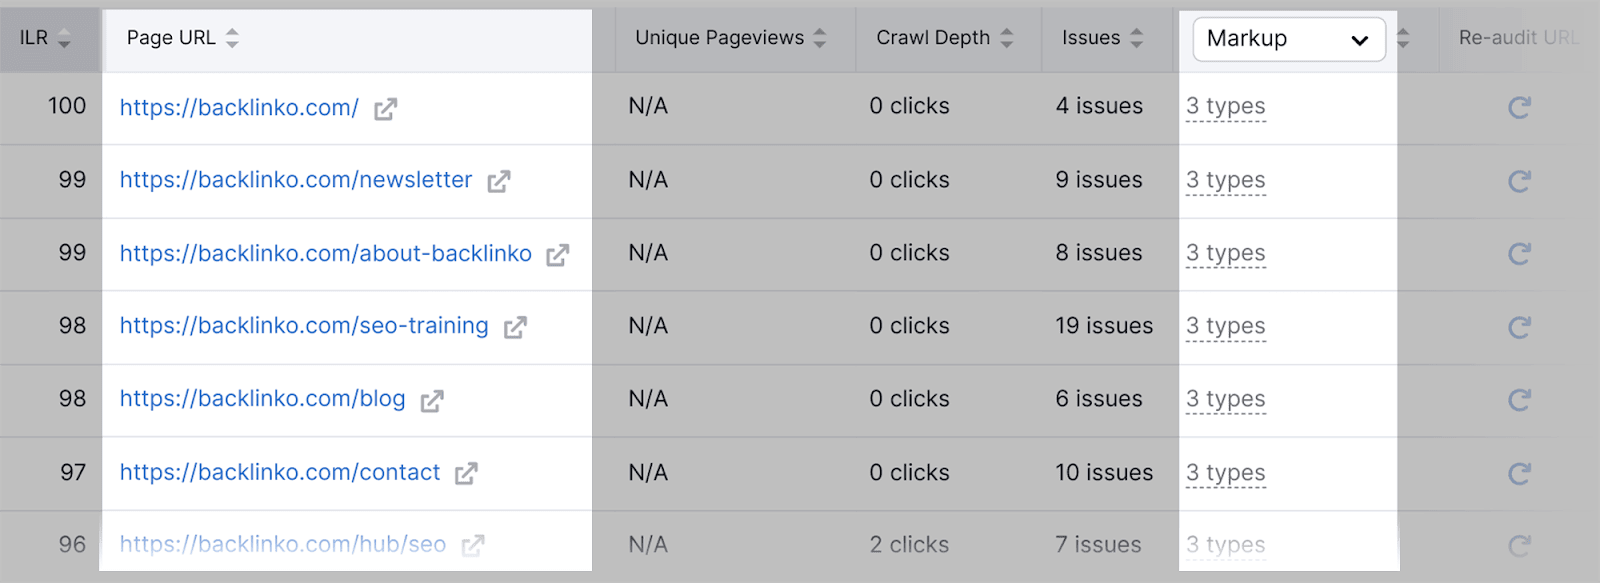
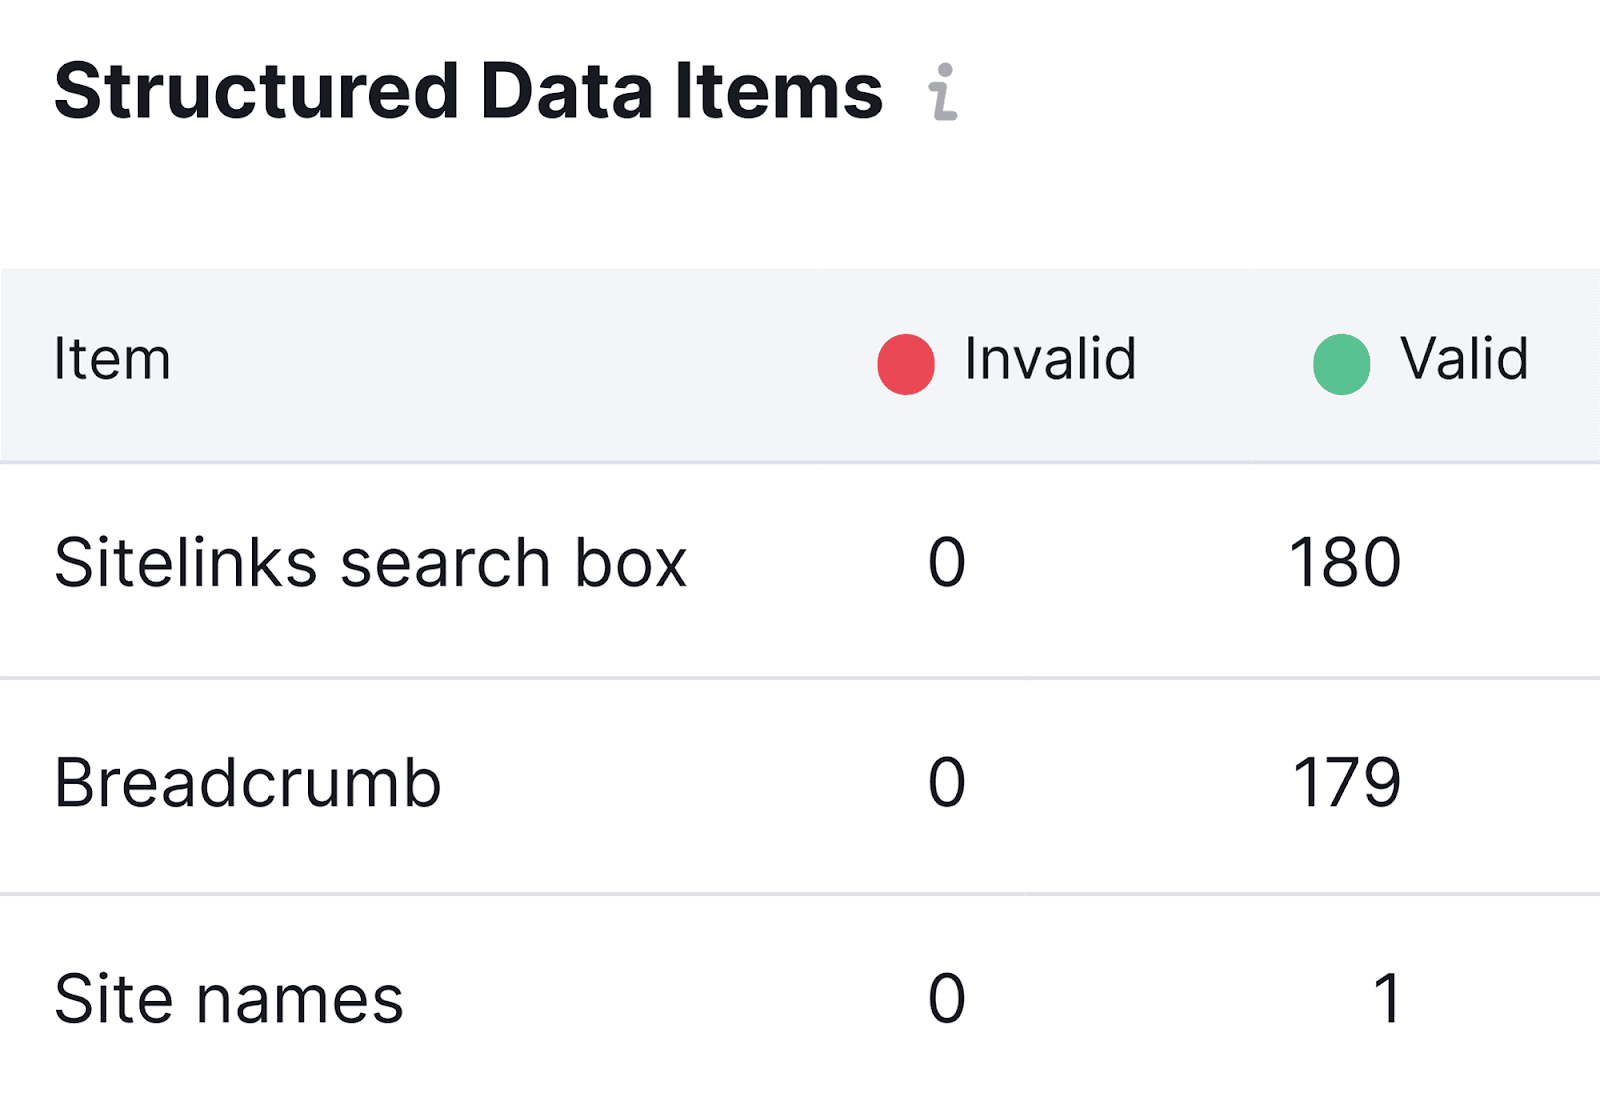
Markup issues, if you have any, will be listed in the “Structured Data Items” table, which can be found at the bottom of the main Markup dashboard:
The Warnings report
Another useful feature of Semrush’s Site Audit tool is the “Warnings” tab, which you can find at the top of your Site Audit dashboard:
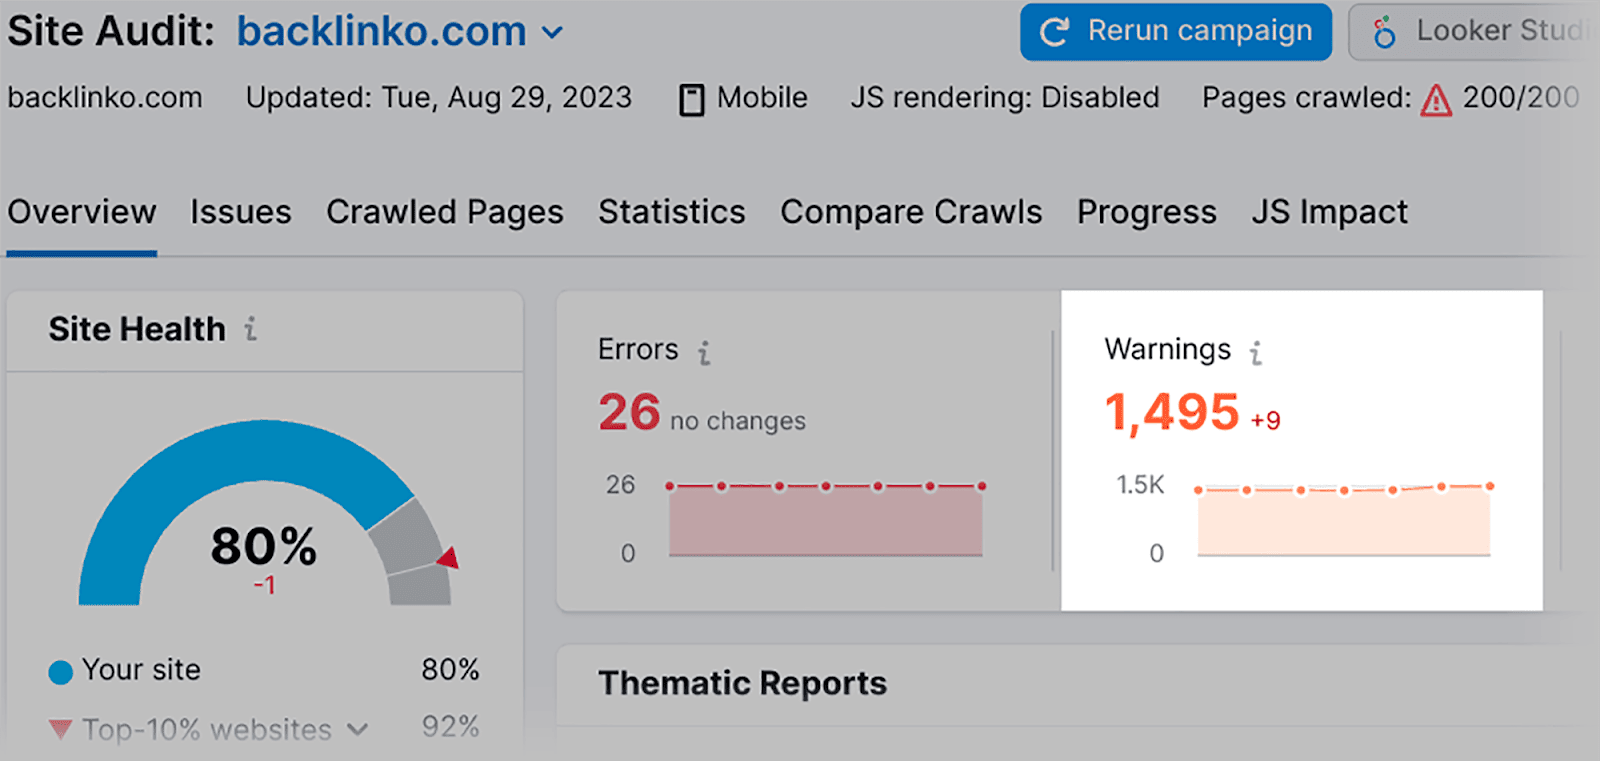
…which provides you with a list of issues that could be hindering the performance of your site.

Although they’re only “warnings”, you should still aim to fix them ASAP. Especially if your Warnings list includes any of the following:
- Images don’t have alt attributes — If your images don’t have alt attributes, search engines can’t understand what they contain. On top of that, people with visual disabilities rely on screen readers, which pick up alt attributes to give the user an idea of what the image is about. Therefore, without alt attributes you can’t rank in image SERPs, as search engines don’t know how to index your image, and users might leave if they don’t have a clear view of your site’s content.
- Duplicate H1s and title tags — Here you can find out if multiple pages on your site feature the same H1s and title tags. If you find instances like this, you need to solve this issue ASAP by implementing unique H1s and title tags for each of your pages.
Too much text within title tags — If your title tags exceed 70 characters, they’ll likely get truncated in the SERPs. Truncated title tags can look unclear to web users, and it’s not appealing. - Low word count — An article’s word count is usually an indicator of content quality to search engines. For example, if you created a blog post on a meaty topic like “how to do keyword research”, but you only wrote 200 words, then you’ve probably not written enough to cover the whole topic. This is known as “thin content”. Semrush’s Site Audit tool records instances of thin content with a low word count warning. It’s important to note that Google’s algorithm is shifting towards content relevance over word count, but it still prefers higher word count articles.
- A low text-HTML ratio — If you have a text-HTML ratio lower than 10%, you should really add more text to the relevant web pages. Google prefers the text level to outweigh the HTML level of each web page.
8. Core Web Vitals
Core Web Vitals are SUPER important metrics that track the real-world experience of users when they interact with your pages.
They measure the performance of your site in terms of:
- Page loading speed
- Visual stability
- Responsiveness to user input
By tracking your Core Web Vitals metrics, you can identify issues on your site that are hampering its user experience. You can then address these issues which can lead to reduced bounce rates and a much more positive UX.
In my Core Web Vitals guide, you can find all the information you need to effectively track and improve these metrics.
9. Page crawls
As an extension of your technical SEO audit, you can use Semrush’s Log File Analyzer to review exactly how search engine bots interact and navigate around your site.
Web crawlers are designed to crawl web pages to understand what the content is about. These bots navigate their way around sites by following links found on the pages themselves.
Given how regularly bots crawl pages, how well they are able to crawl a domain is a good indicator of the website’s overall health.
Crawls are recorded in the domain’s log files. These files keep track of whenever a web crawler accesses web pages. With this information, you can determine exactly how crawlers navigate around your domain.
Specifically, you can identify the pages they spend the most time on, as well as the pages they visit least frequently.
You could analyze these log files manually but it requires a high level of expertise in understanding:
- server logs
- web protocols
- and data analysis techniques
not to mention it can be very time-consuming due to the meticulous review and interpretation of log data.
By automating your log file analysis, you can streamline the process, saving time while still obtaining valuable insights.
You can do this by using Semrush’s Log File Analyzer tool.
With this tool, you can automatically get data on:
- Mobile bot activity
- Structural and navigational issues within your domain
- Opportunities to better spend your crawl budget
Here’s how to use the tool.
Head over to Log File Analyzer:
Browse for your log files (you should be able to download your log files onto your computer from your website cPanel) and upload them here:
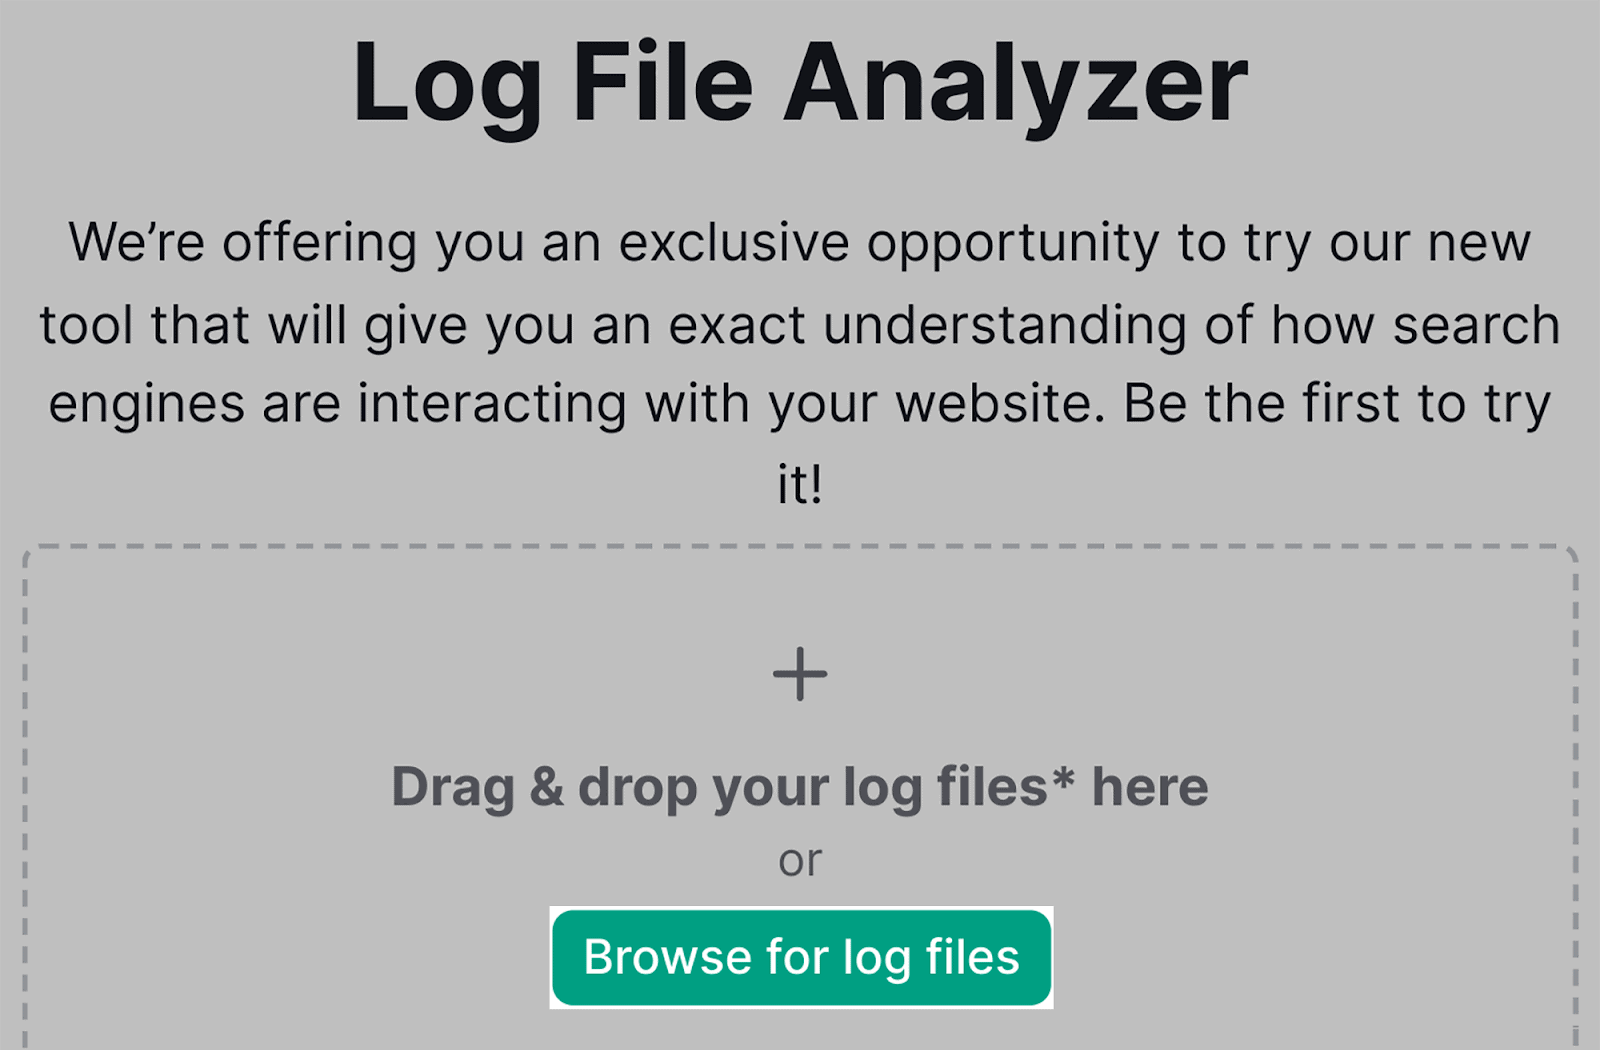
Once uploaded, the tool will reveal if there are currently any crawlability issues.
It will determine these issues by examining how your crawl budget is being spent.
Once you’ve determined these crawlability issues, you can devise a roadmap for how to fix them to make your site more crawlable.
For example, if your crawl budget is not being evenly distributed, perhaps you need to reconsider your website architecture and internal linking. Especially if some of your pages aren’t being crawled at all.
Best of all: the Log File Analyzer tool will keep you up-to-**** with page crawls automatically.
Whenever you need to check the latest report on how your crawl budget is being spent, all you have to do is head over to Log File Analyzer. Once you have submitted your log files once, you won’t need to submit them again.
10. Track your brand mentions
Your brand could be mentioned both positively and negatively on any social media platform or website at any time of day.
Monitoring brand mentions is useful for several reasons. It can help you identify new target audiences, and find out whether your customers are enjoying your product or web content.
If there’s a spike in web users discussing your brand negatively, it could highlight an issue with your website or product that several customers are experiencing.
However, the internet is a big place, and monitoring all of your brand mentions would be next to impossible to do manually.
To monitor all of your web mentions in one place, you can use Semrush’s Brand Monitoring app which will find and record all current and new mentions of your brand around the web (including social media).
You can find Brand Monitoring in the Semrush app store:
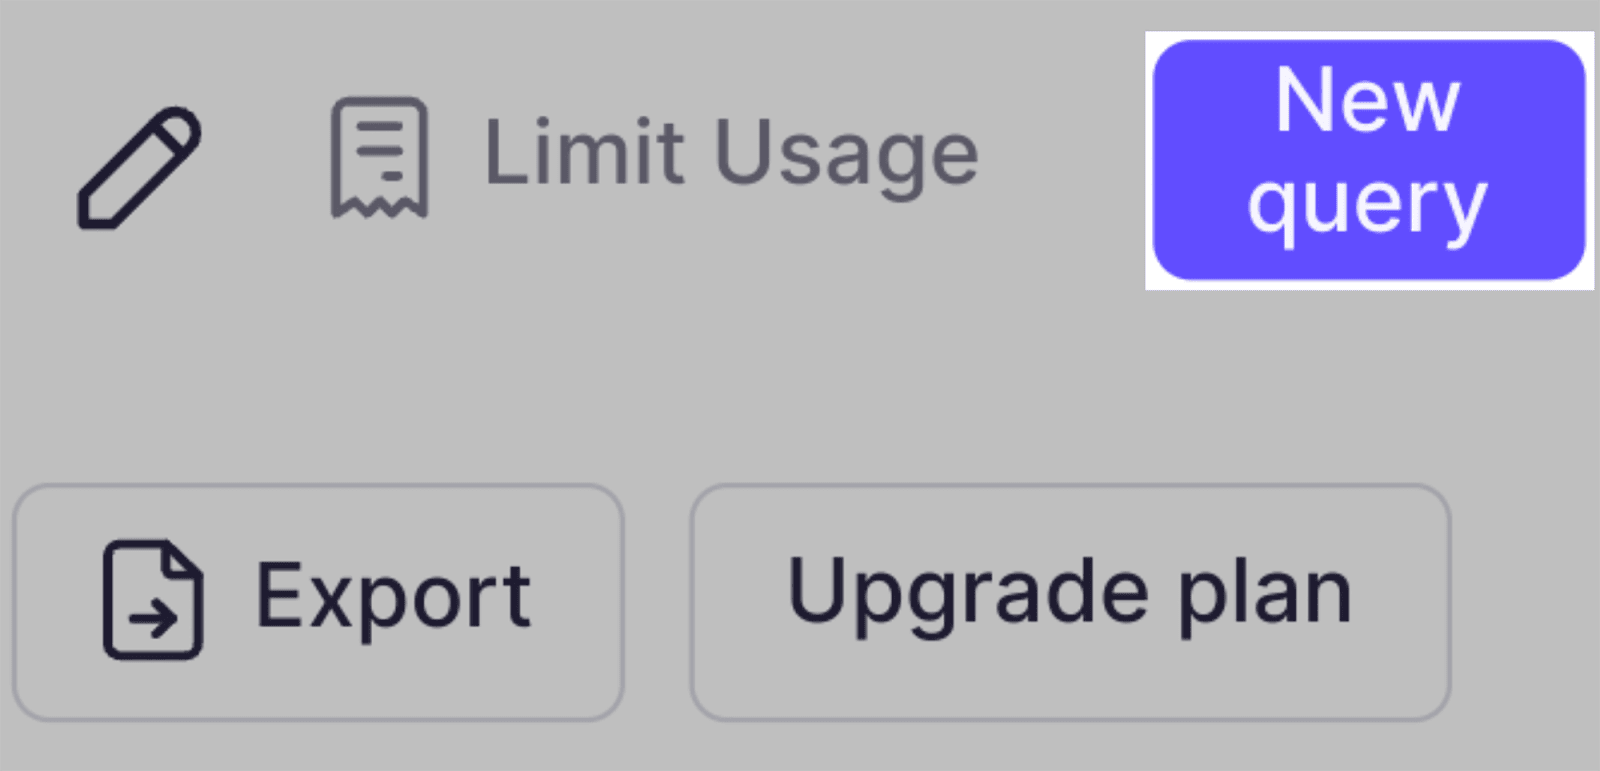
If you haven’t already, you need to subscribe to the Brand Monitoring app (it’s separate from your main Semrush subscription). Once you have, hit the “New query” button:
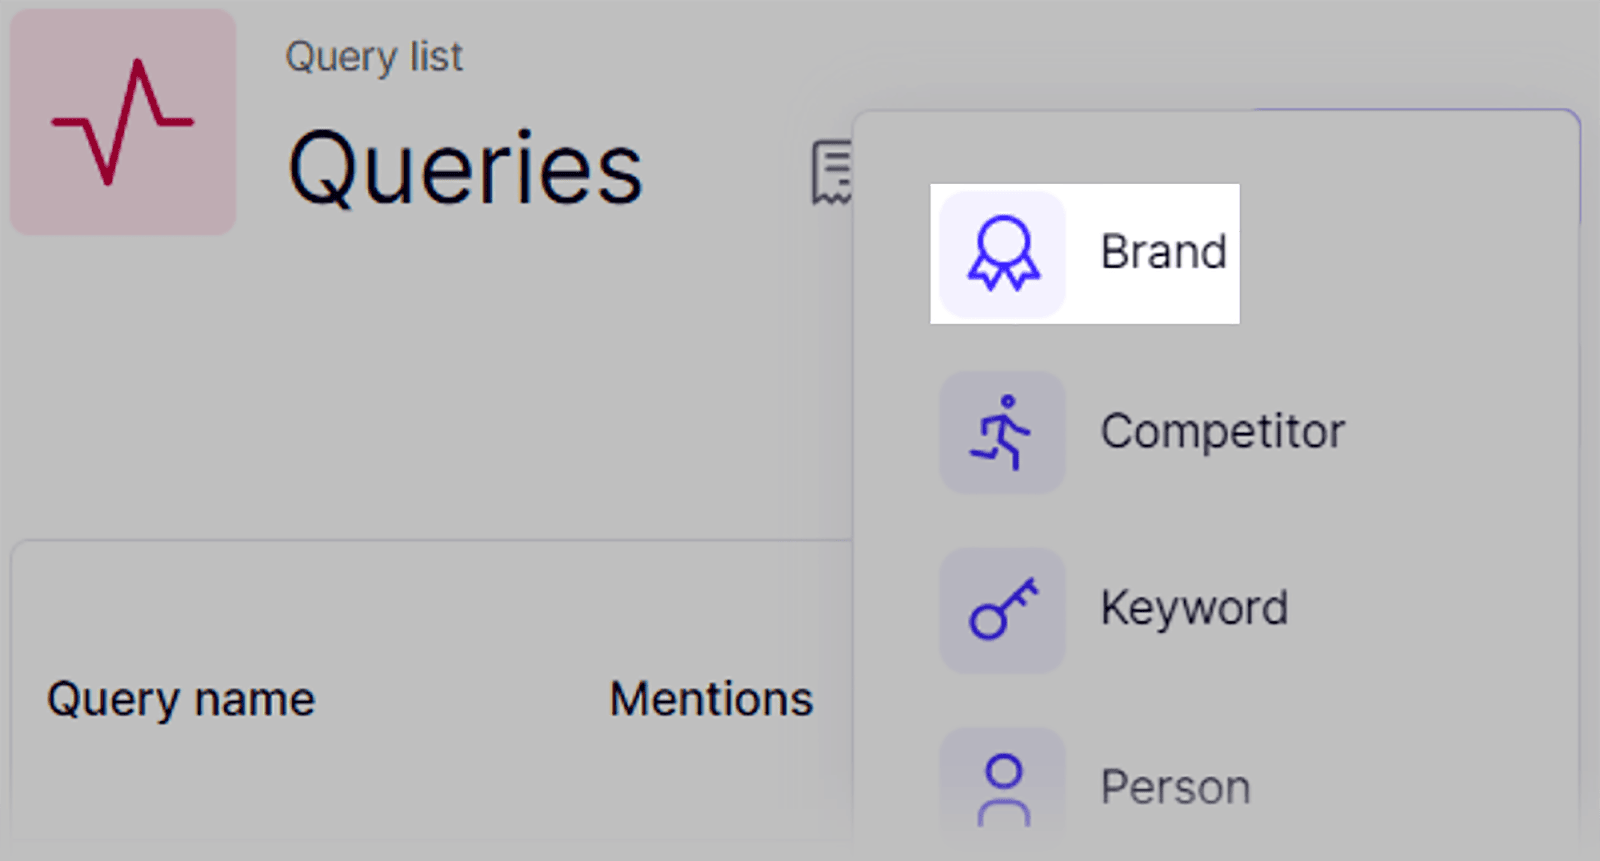
You’ll need to click on “Brand” from the drop-down menu:
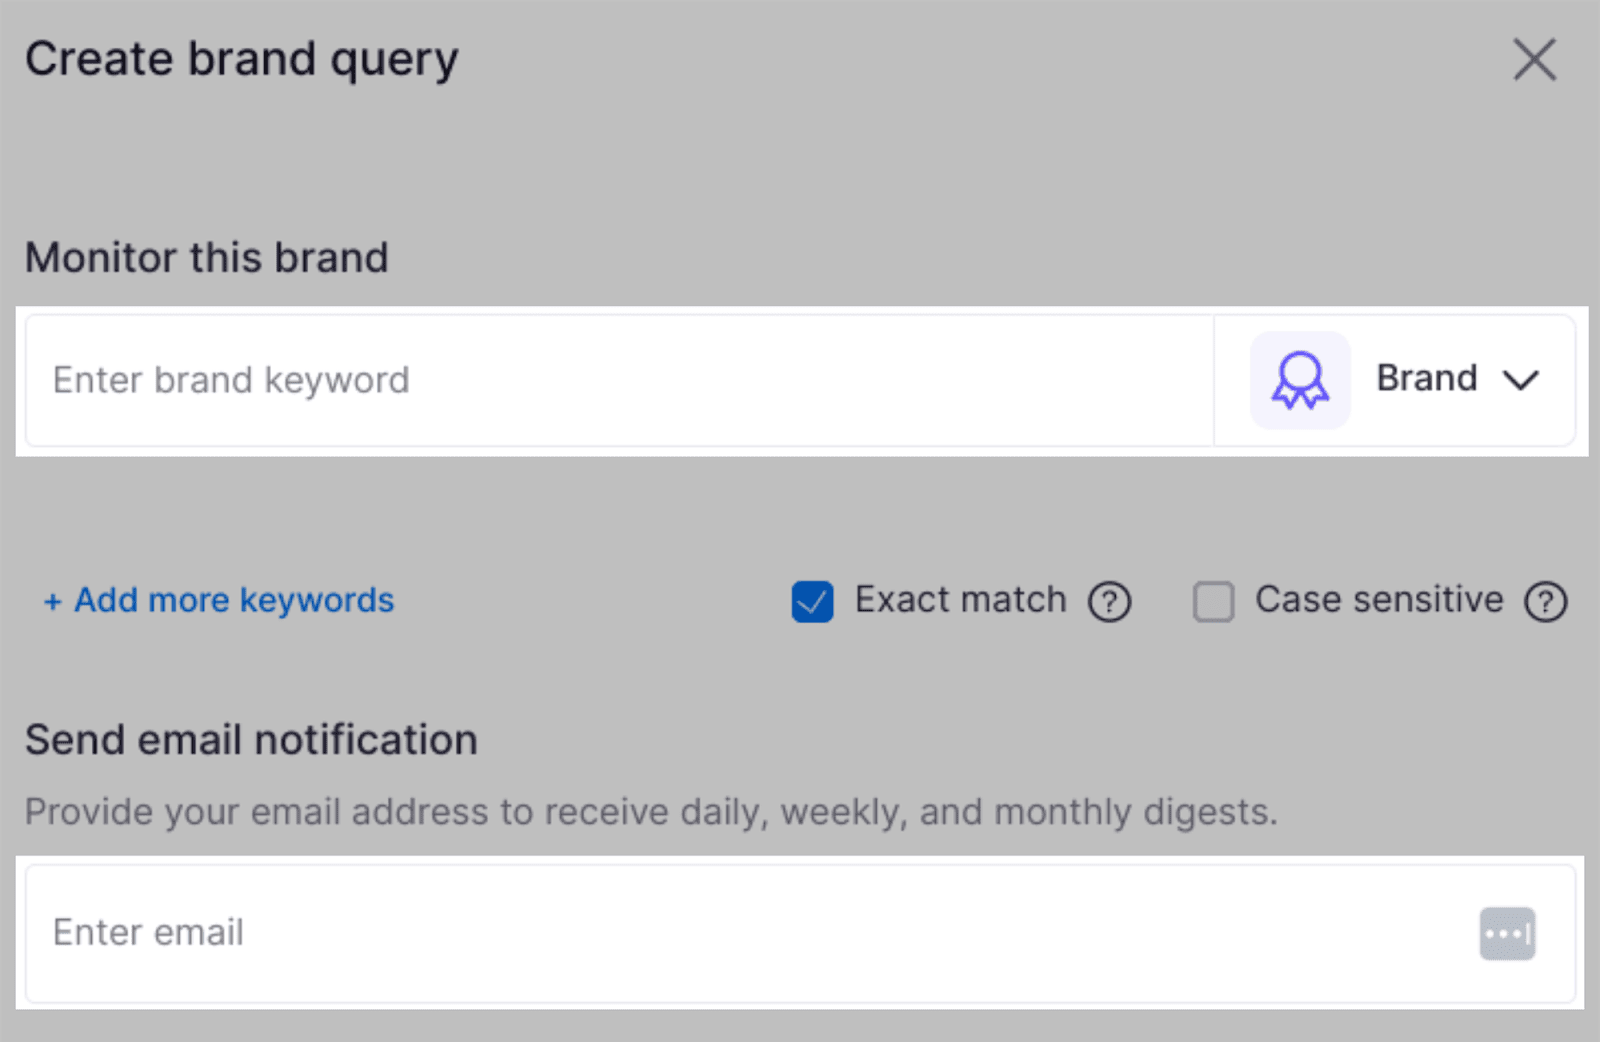
Add your brand keyword and email address in the window that pops up:
You can also refine your results by selecting the “+ Add more keywords” option:
You can add both keywords that your brand query must contain, as well as keywords that your results should not contain, as shown here:
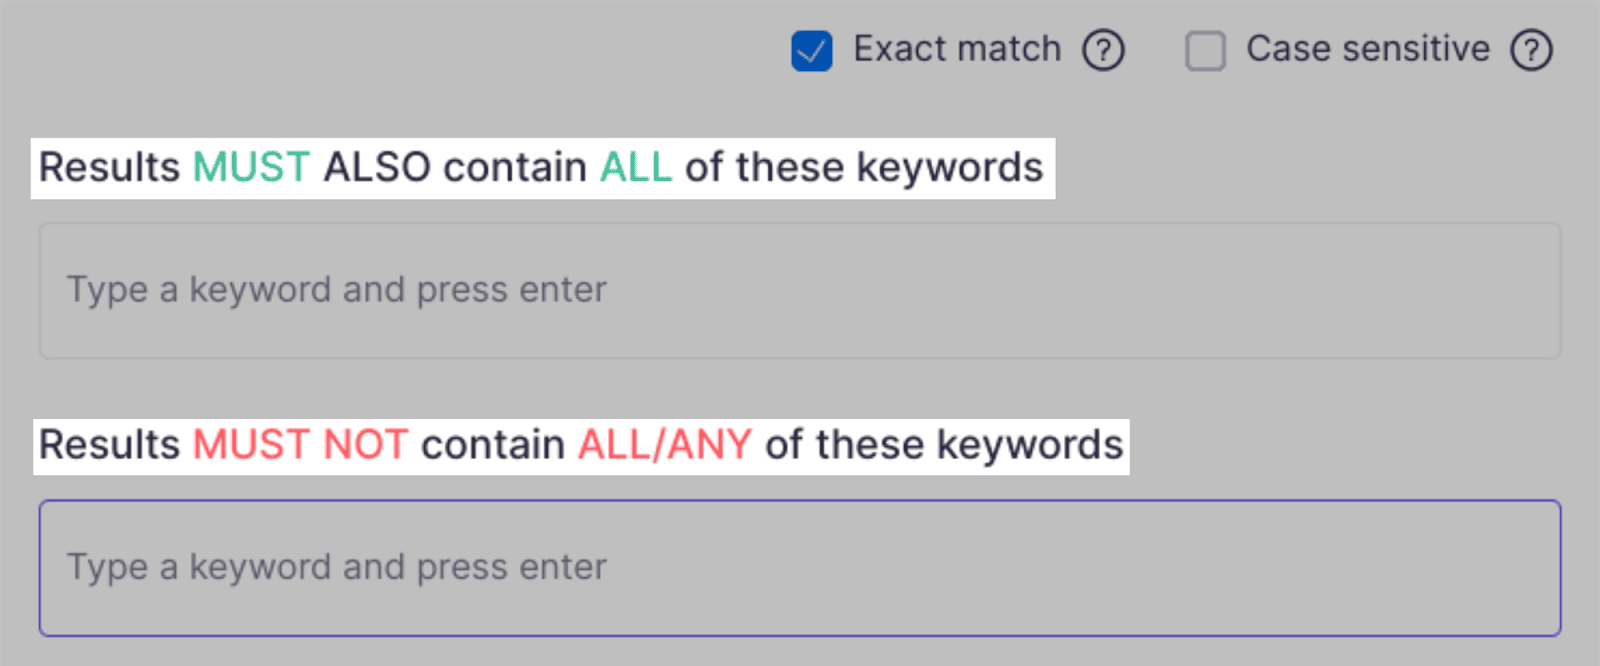
To monitor brand mentions, you should add keywords that feature the title of your brand. For example, “Backlinko link building”.
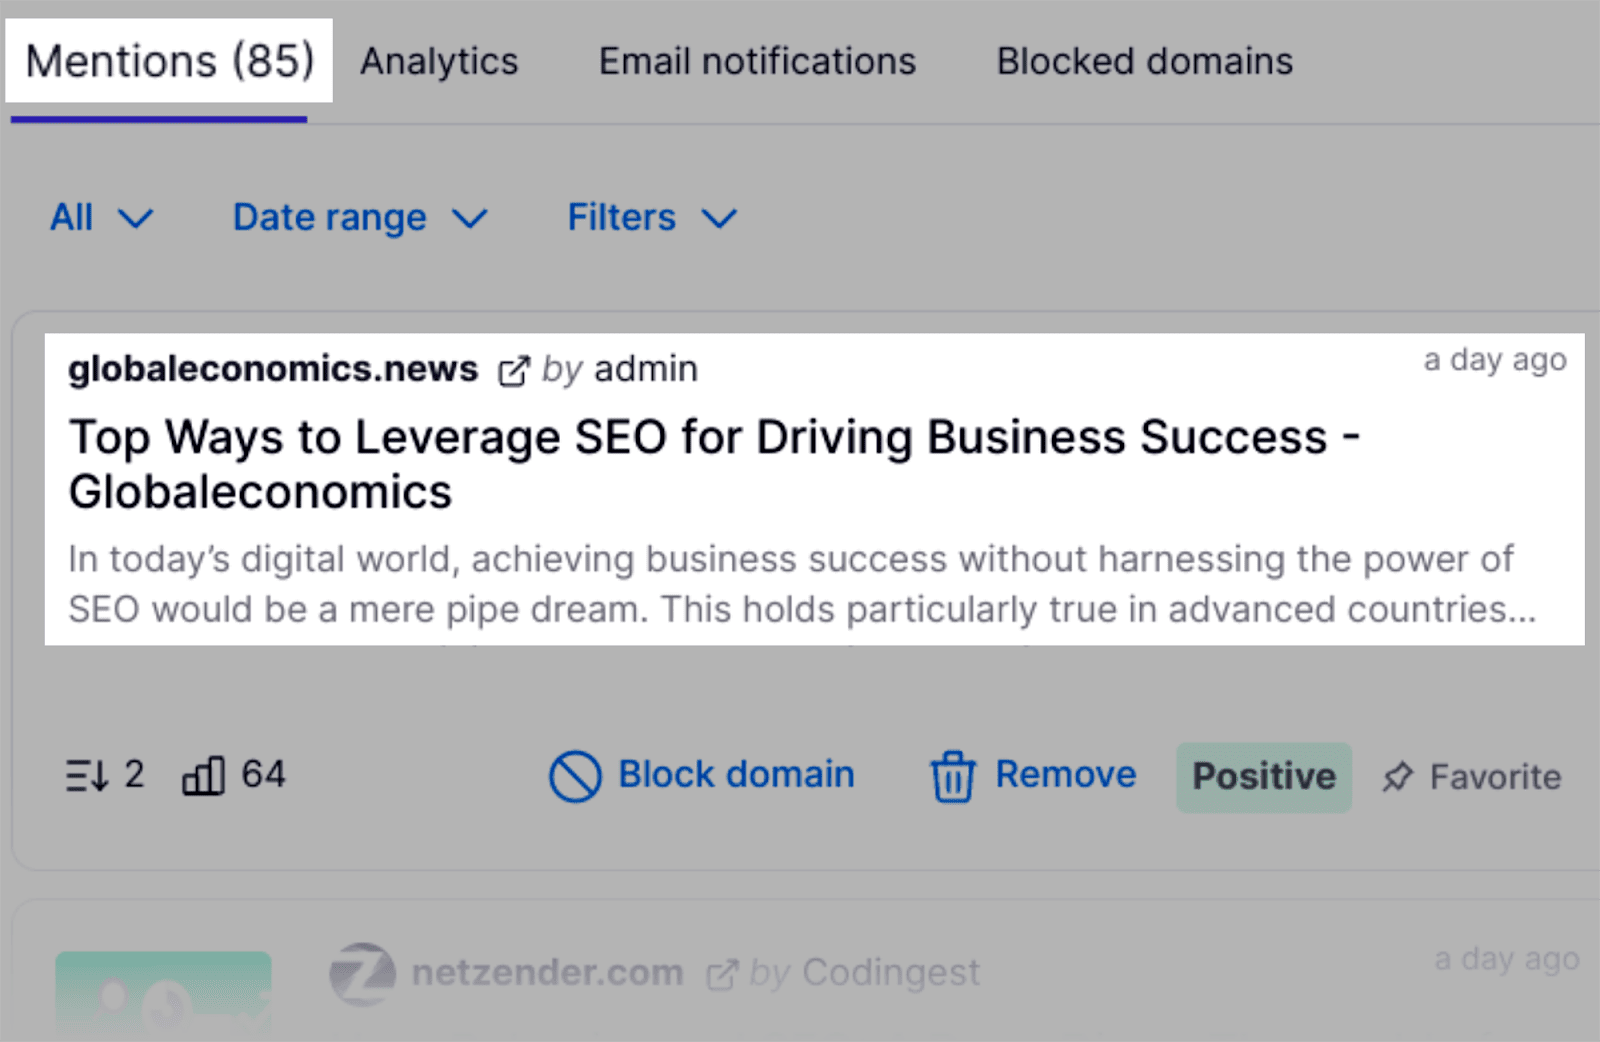
Once you’ve finished adjusting the settings, hit “Create query” at the bottom of the page. You will then be taken to a page that looks like this, showing you your latest brand mentions:
Head over to “Email notifications”, where you can choose to automate email updates…
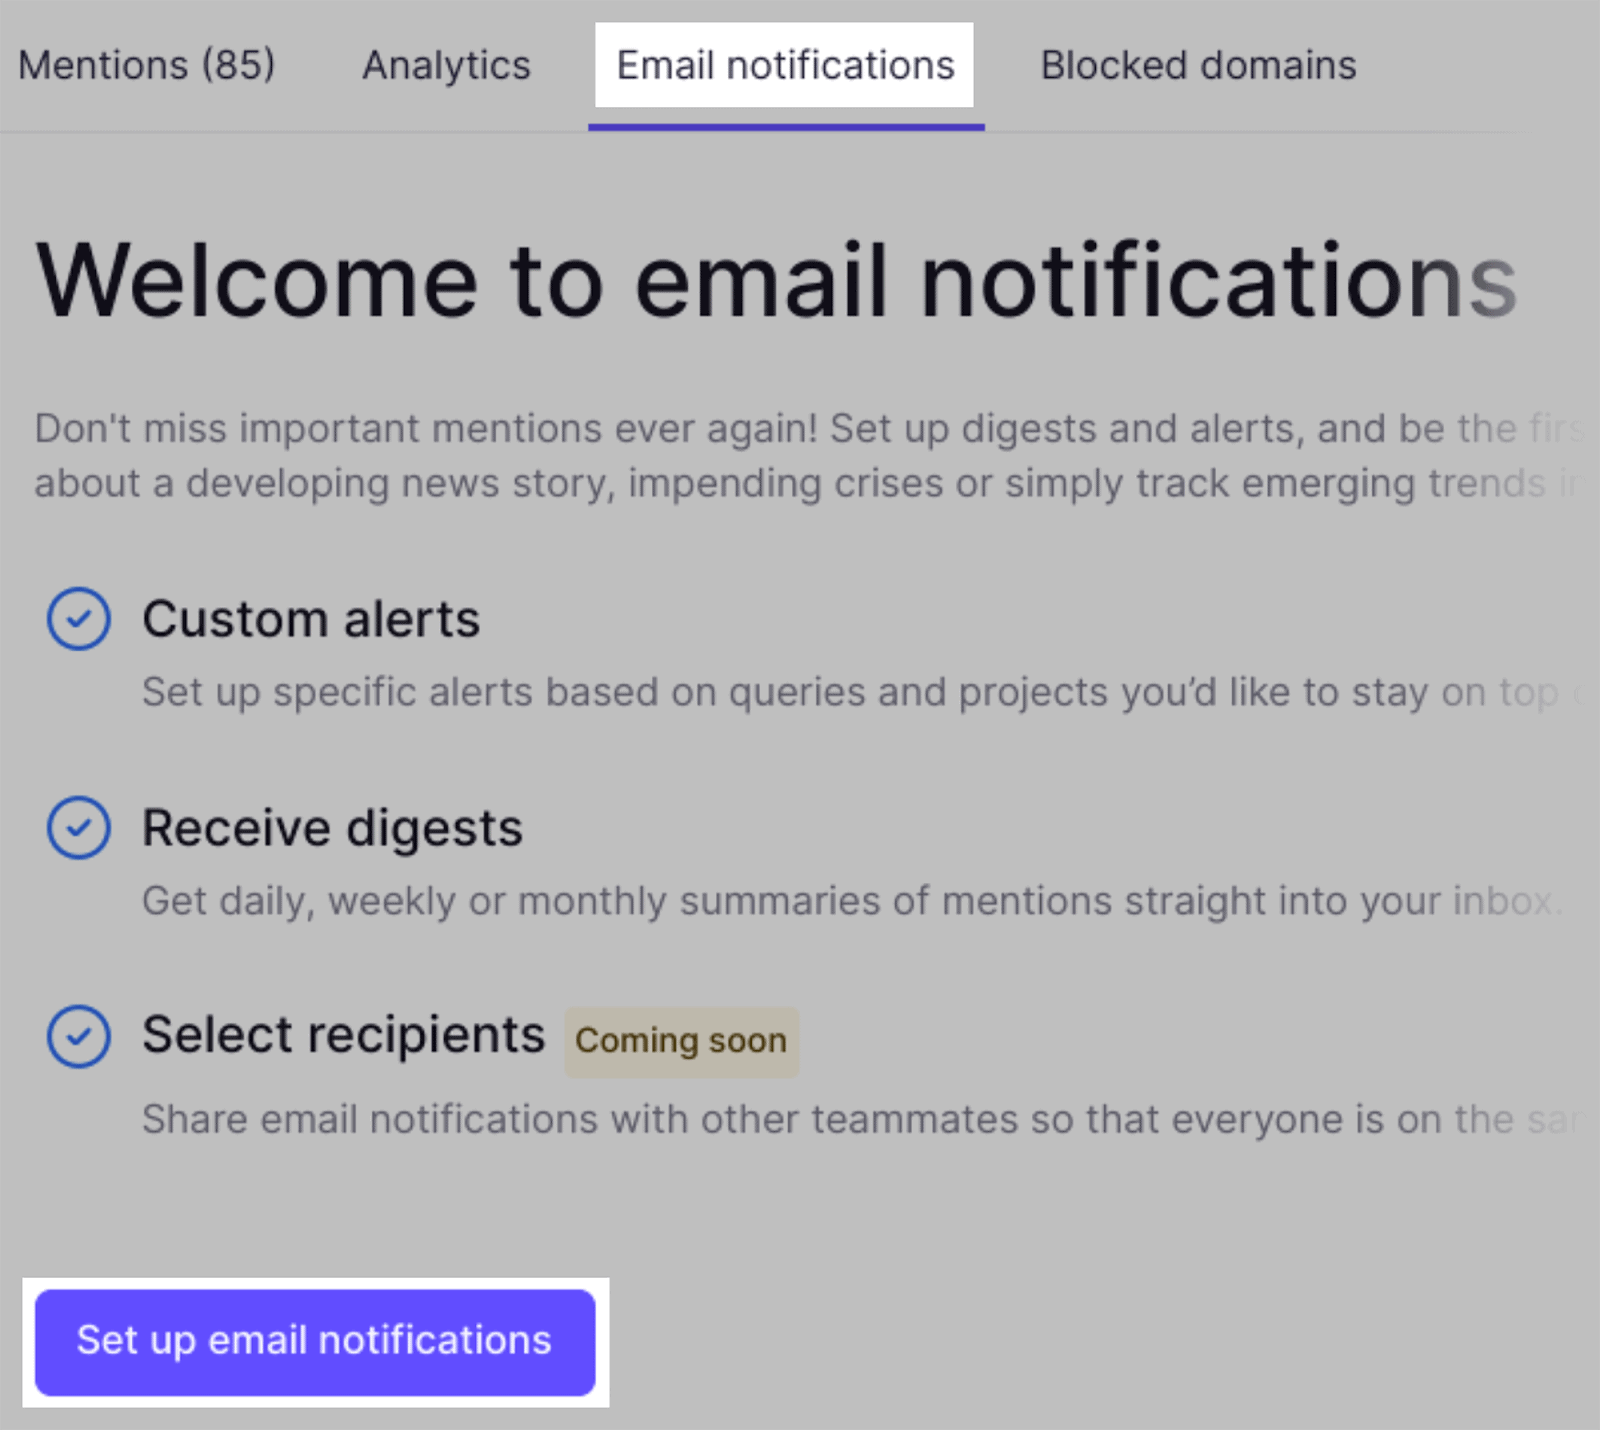
…and decide whether to receive these automated updates either daily, weekly, or monthly.
Semrush’s Brand Monitoring app makes monitoring brand mentions an easy task to do. But what if you’re on a budget?
A similar, free service is available through Google Alerts. Simply head over to the Google tool. Once here, type in your business name at the top. Then, select the sources, language, and region. Lastly, type in your email and hit “Create Alert”:
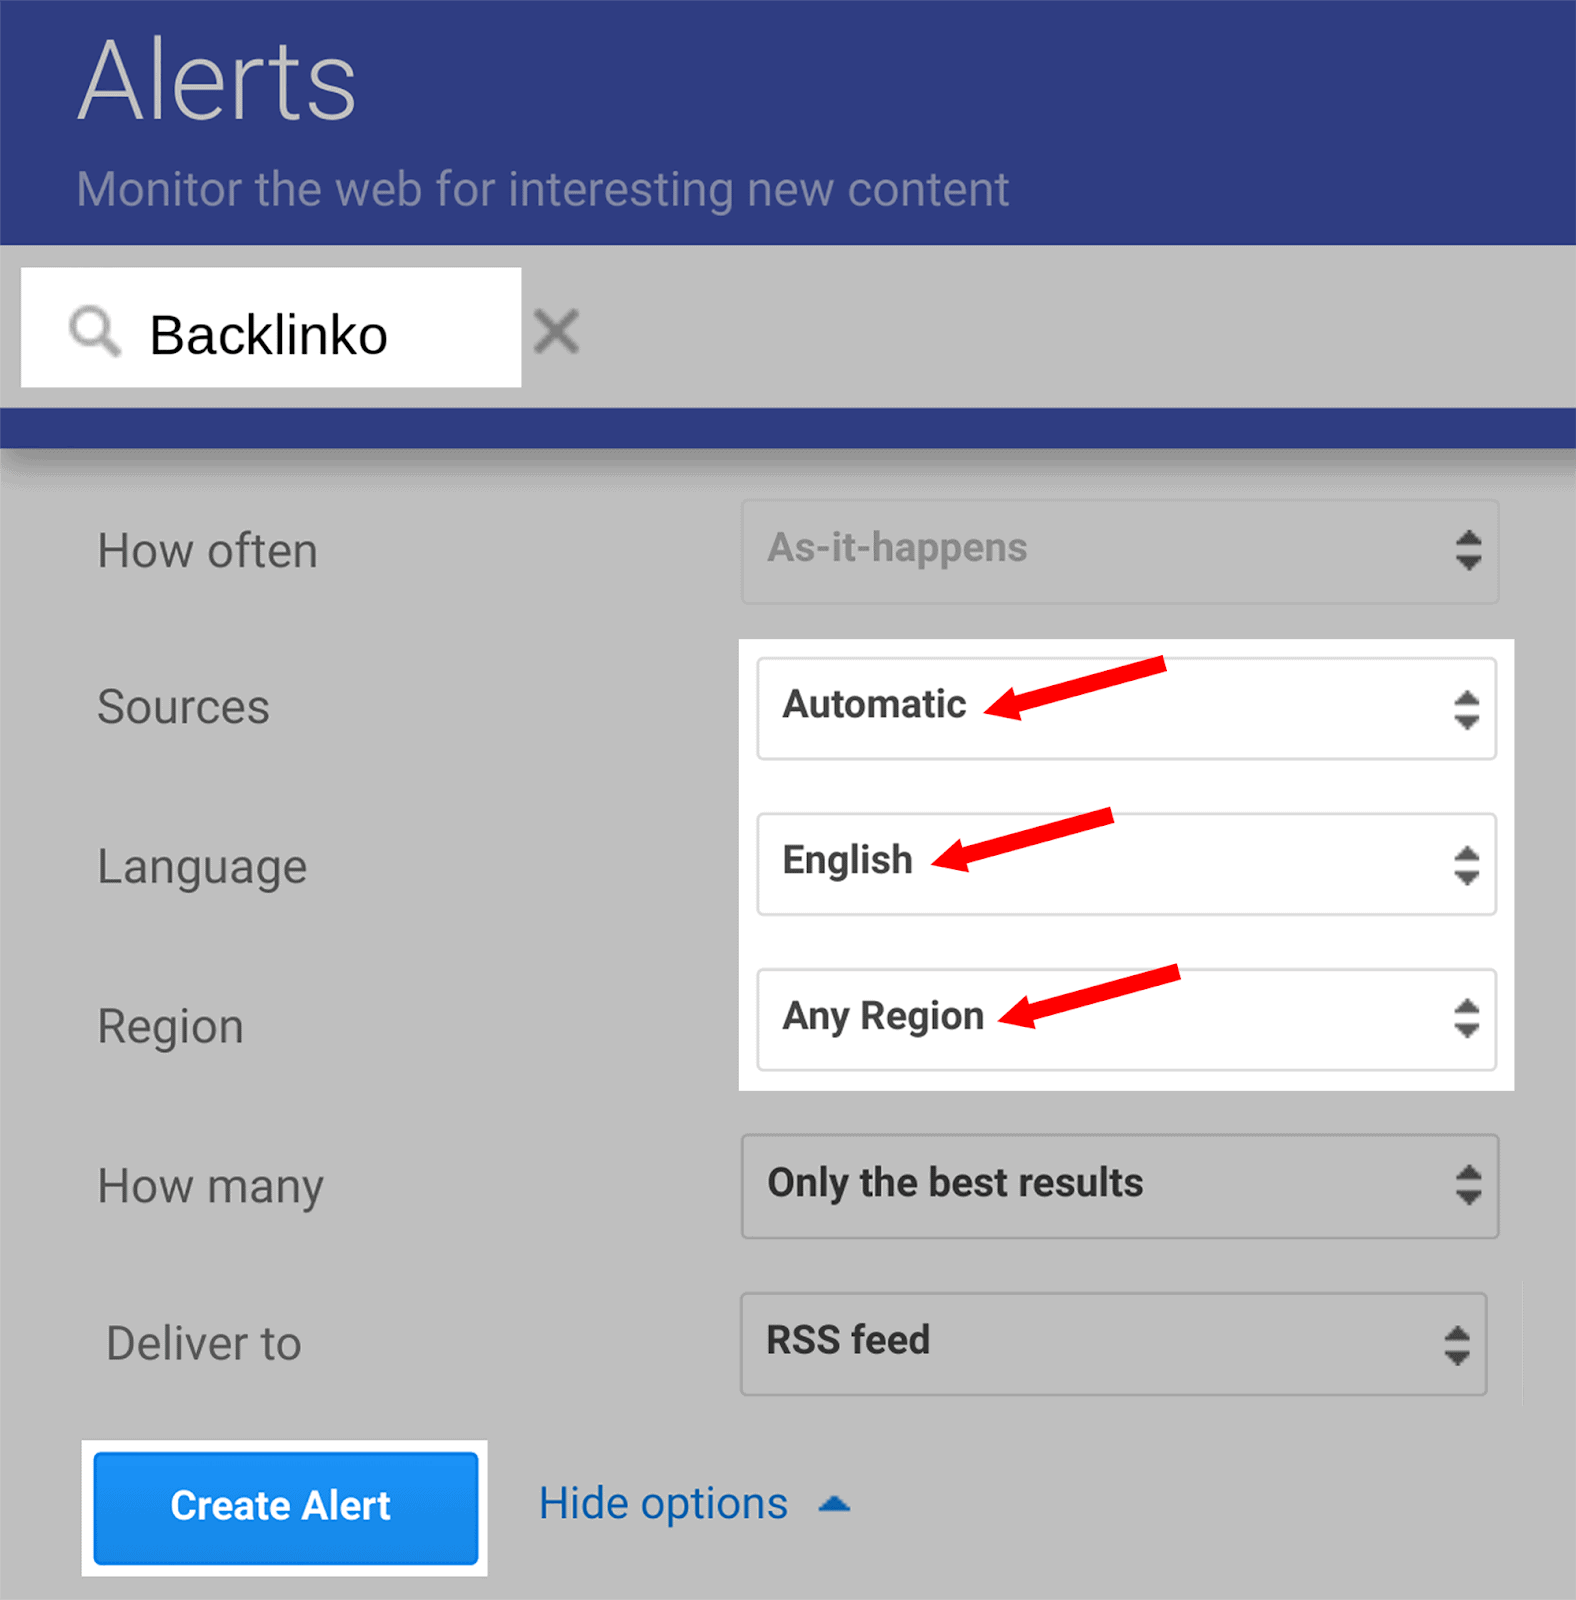
While Google Alerts is a good free option, it’s a limited tool in comparison to Semrush’s Brand Mentions.
For example, Brand Mentions will alert you whenever your brand is mentioned on social media, while Google Alerts will not.
11. Monitor your reviews online
Just as it’s important to track brand mentions, it’s also important to check in on your brand reviews.
First and foremost, online reviews dictate your brand credibility. If you offer a product or a service, prospective customers are likely to check review sites before completing a transaction – especially if you’re a brand they’re unfamiliar with.
It’s vital that you keep up with reviews for several reasons:
- It provides you with feedback.
- You gain a sense of your online reputation.
- You have the chance to reply to/dispute claims made by customers.
The problem is that there’s a ton of online review sites you’d have to check to gain a complete picture of your reviews.
Yelp, Trustpilot, TripAdvisor— the list goes on.
To make managing your reviews easier, you can use Semrush’s Review Management tool.
This will automatically gather your reviews and display them for you in one place. You can even reply to comments right from the tool itself.
Here’s how it works:
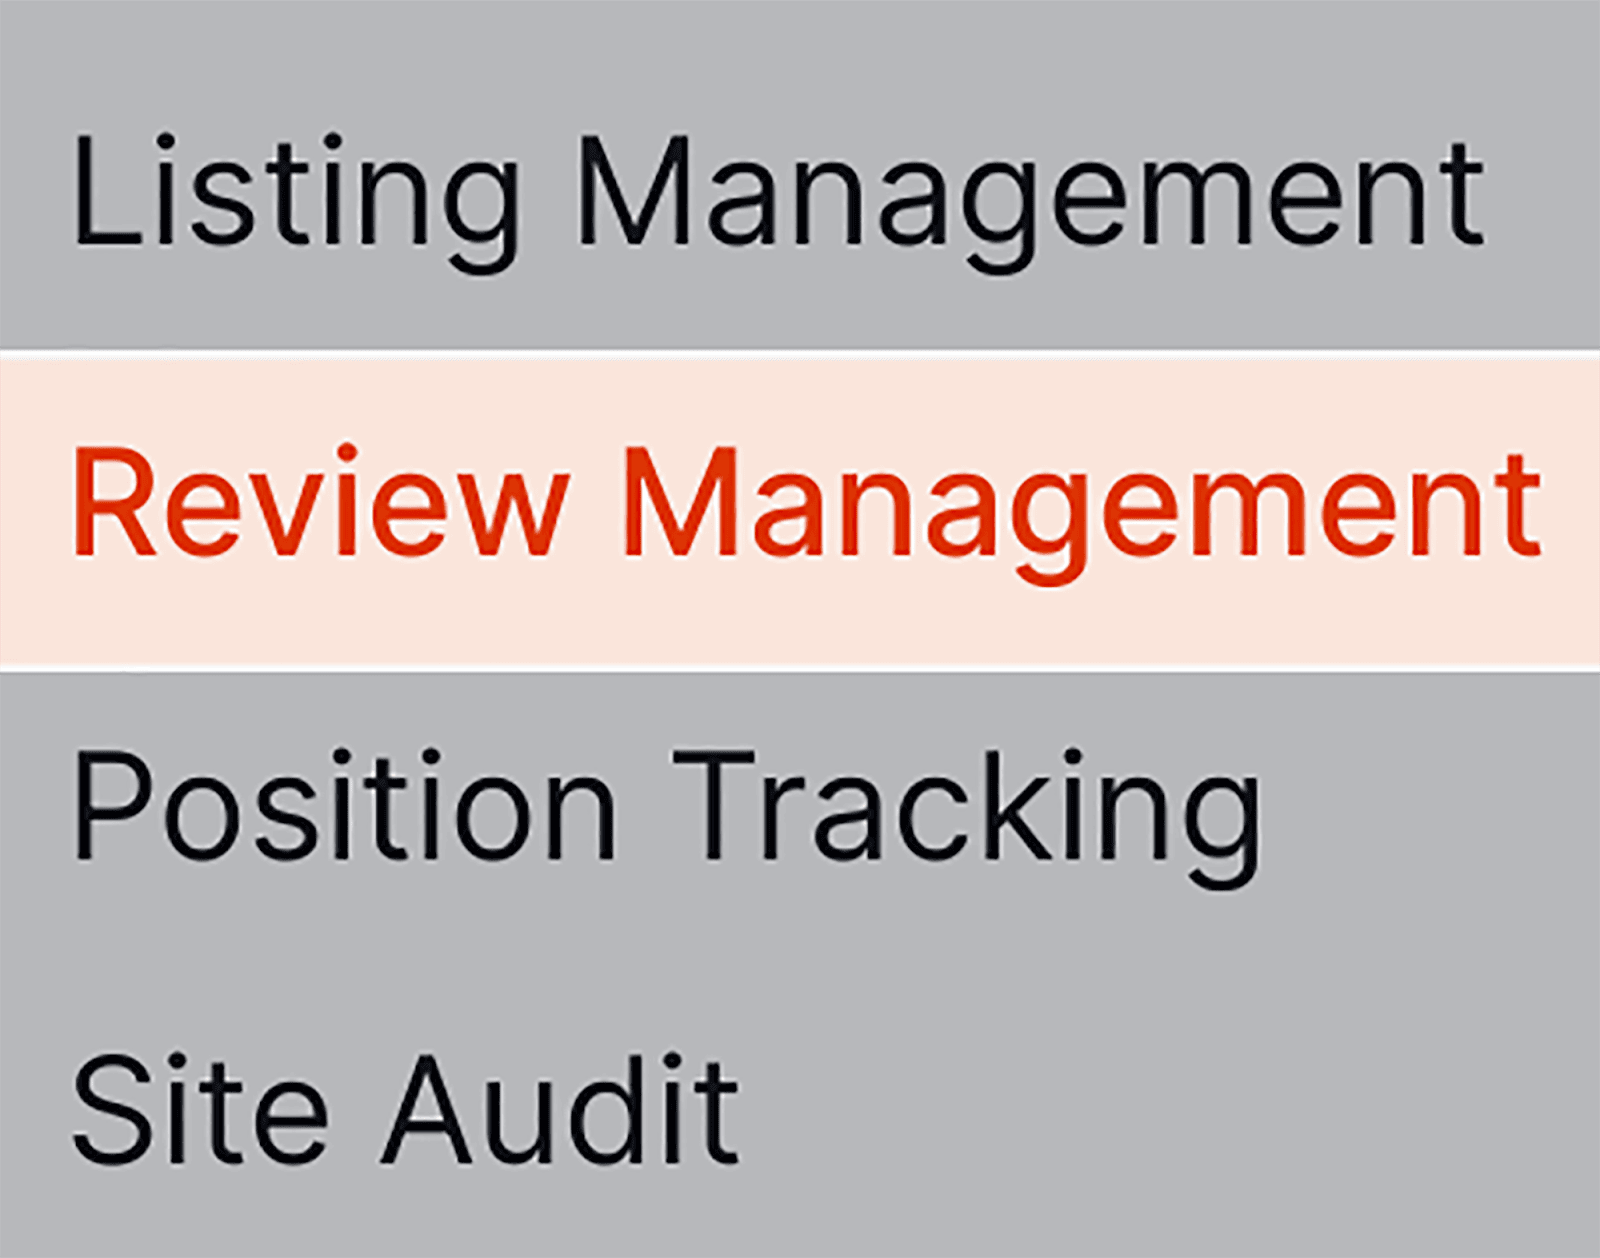
In the Local SEO section of Semrush, select “Review Management”:
And enter your company name in the search bar.
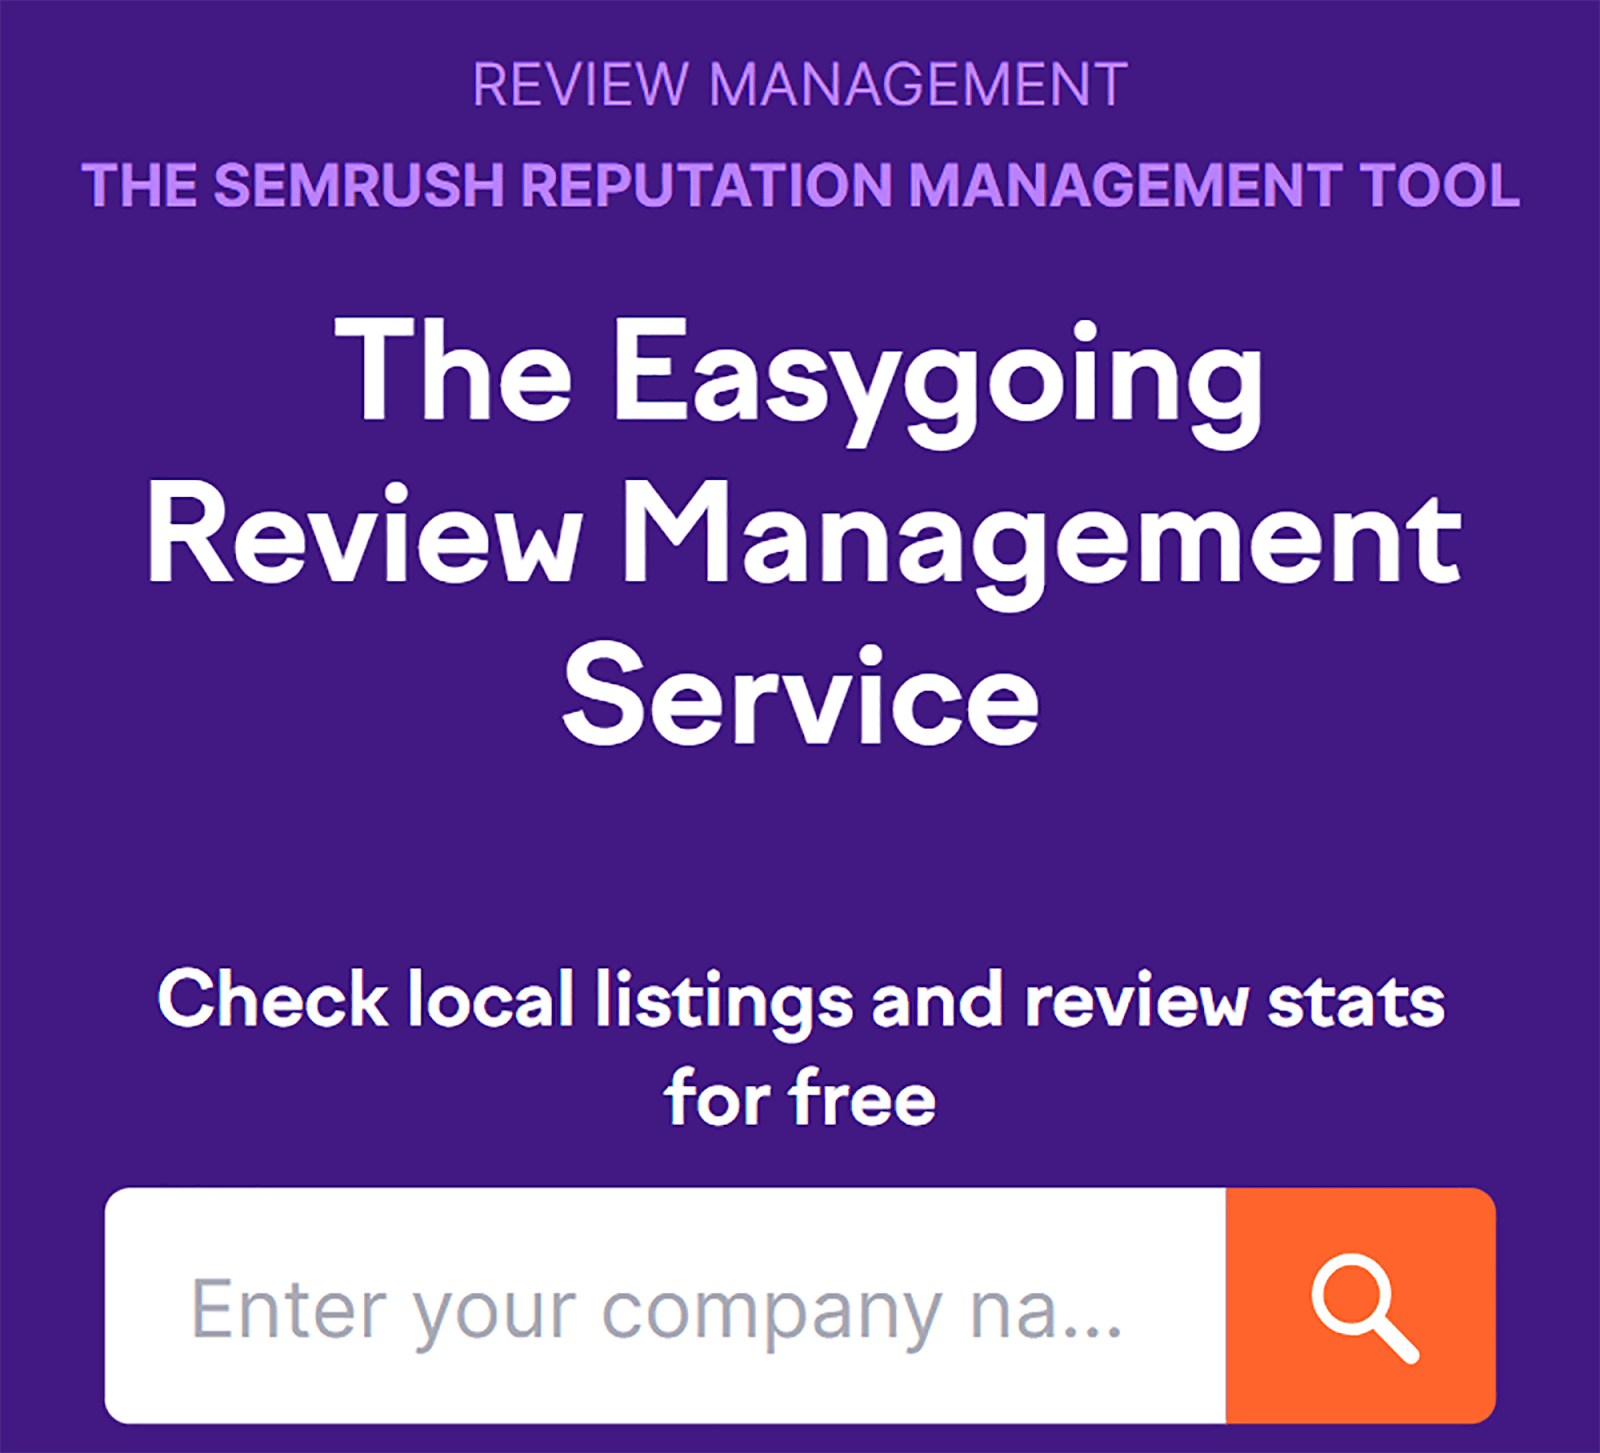
Once you enter your company name, you’ll be able to review your current ratings on the main Review Management dashboard:

If you scroll down, you’ll also be able to see your reviews, all gathered for you automatically:
If you click on the “open review on…” link below the review, Semrush will lead you straight to the review on the external site.
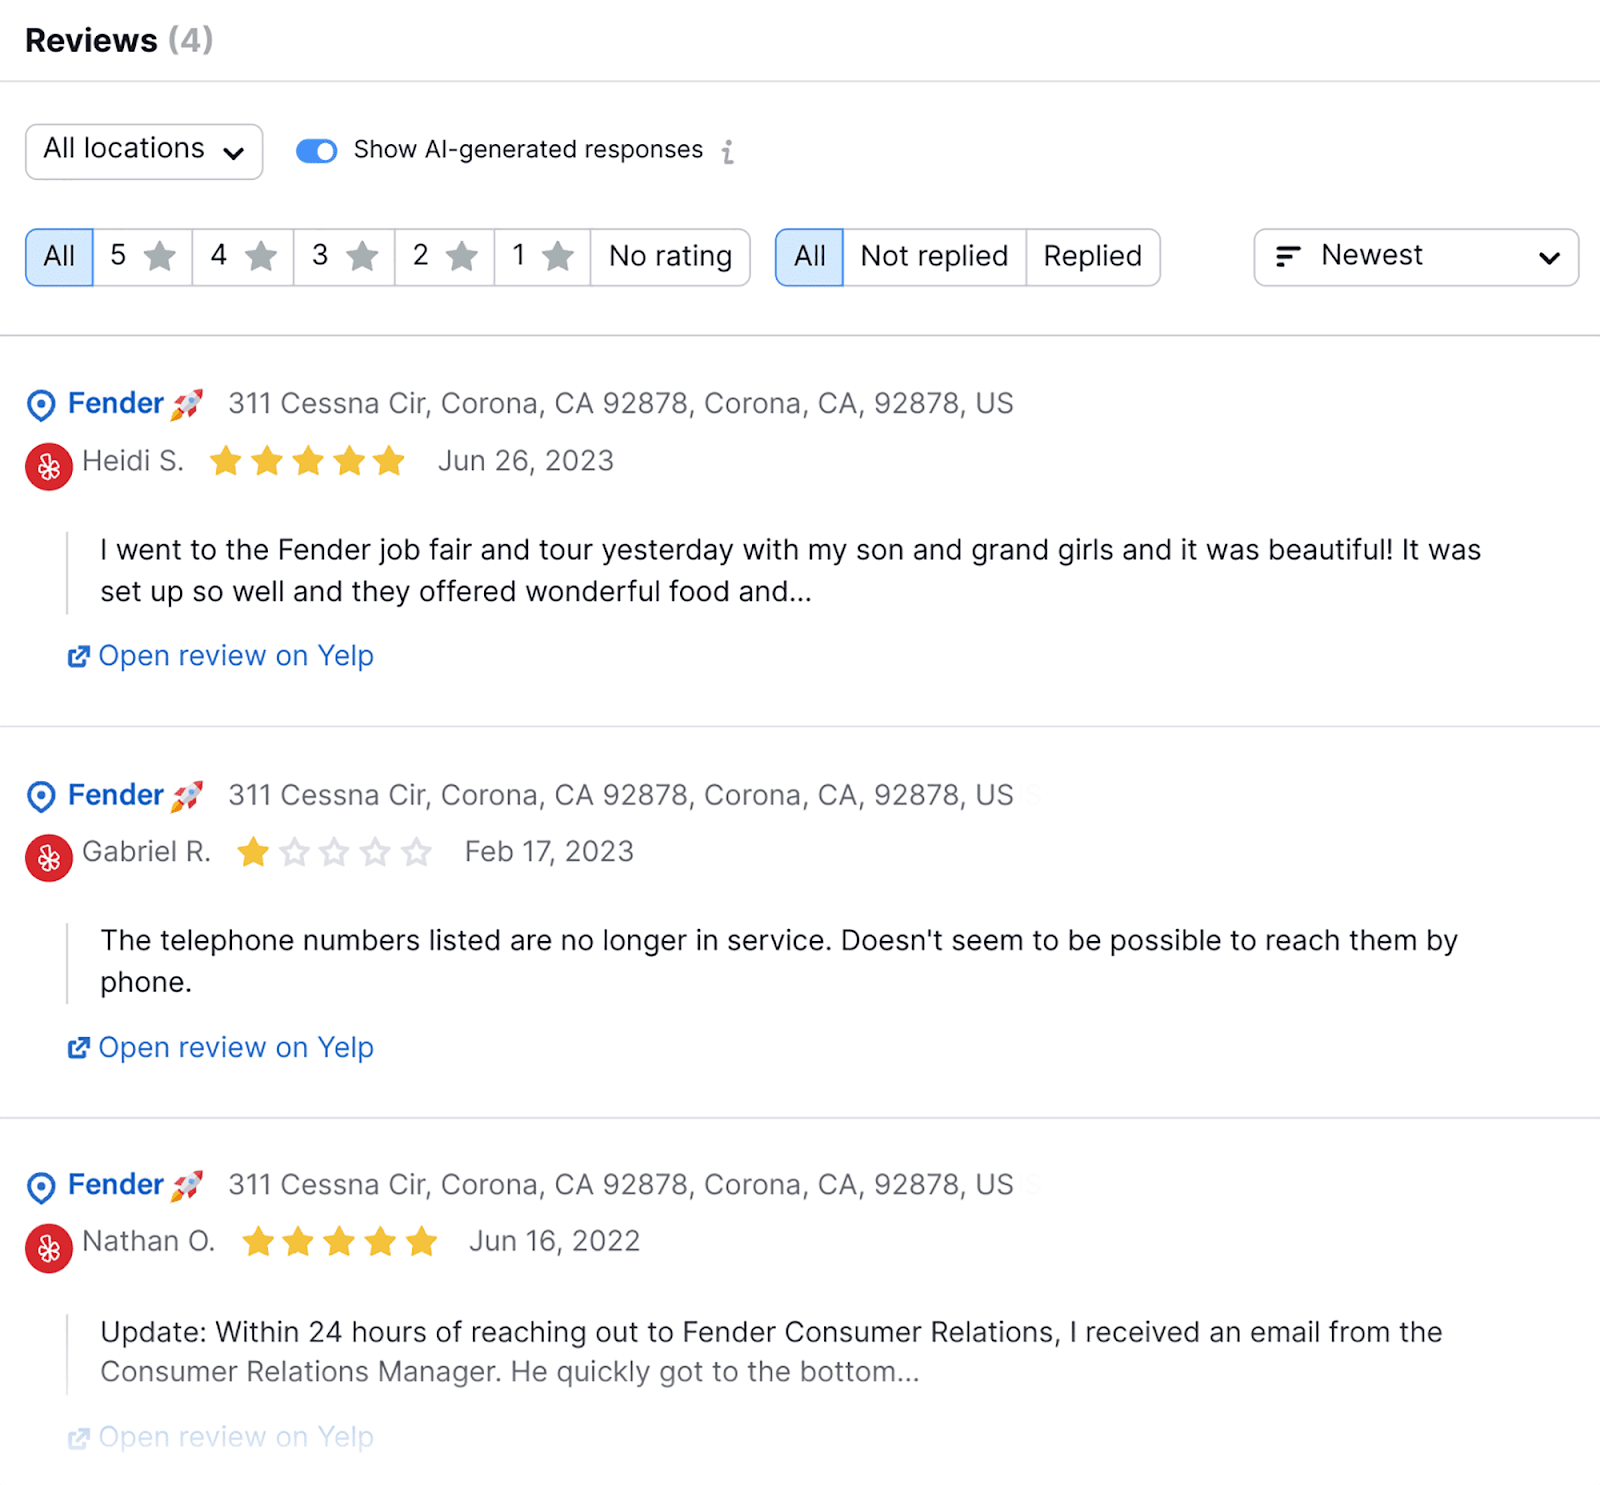
Once there, you’ll be able to respond to the review accordingly.
12. Traffic alerts
Out of all the SEO metrics that matter, being alerted to drastic changes in your traffic levels would be very helpful.
Google Analytics can be used to alert you to any sudden increases or drastic drops in your site traffic. In particular, it’s invaluable when it comes to performance evaluation, conversion tracking, and trend analysis.
Generally, analyzing traffic levels helps you understand how well your website is doing presently.
Therefore, it would be useful to know when anomalies occur in your traffic levels so that you can analyze why.
GA4 can be used to alert you to any sudden increases or drastic drops in your site traffic.
To set up this alert, click on Reports in Google Analytics…

…and then scroll down till you see the Insights box just below the Acquisition graph, click “View all insights”:
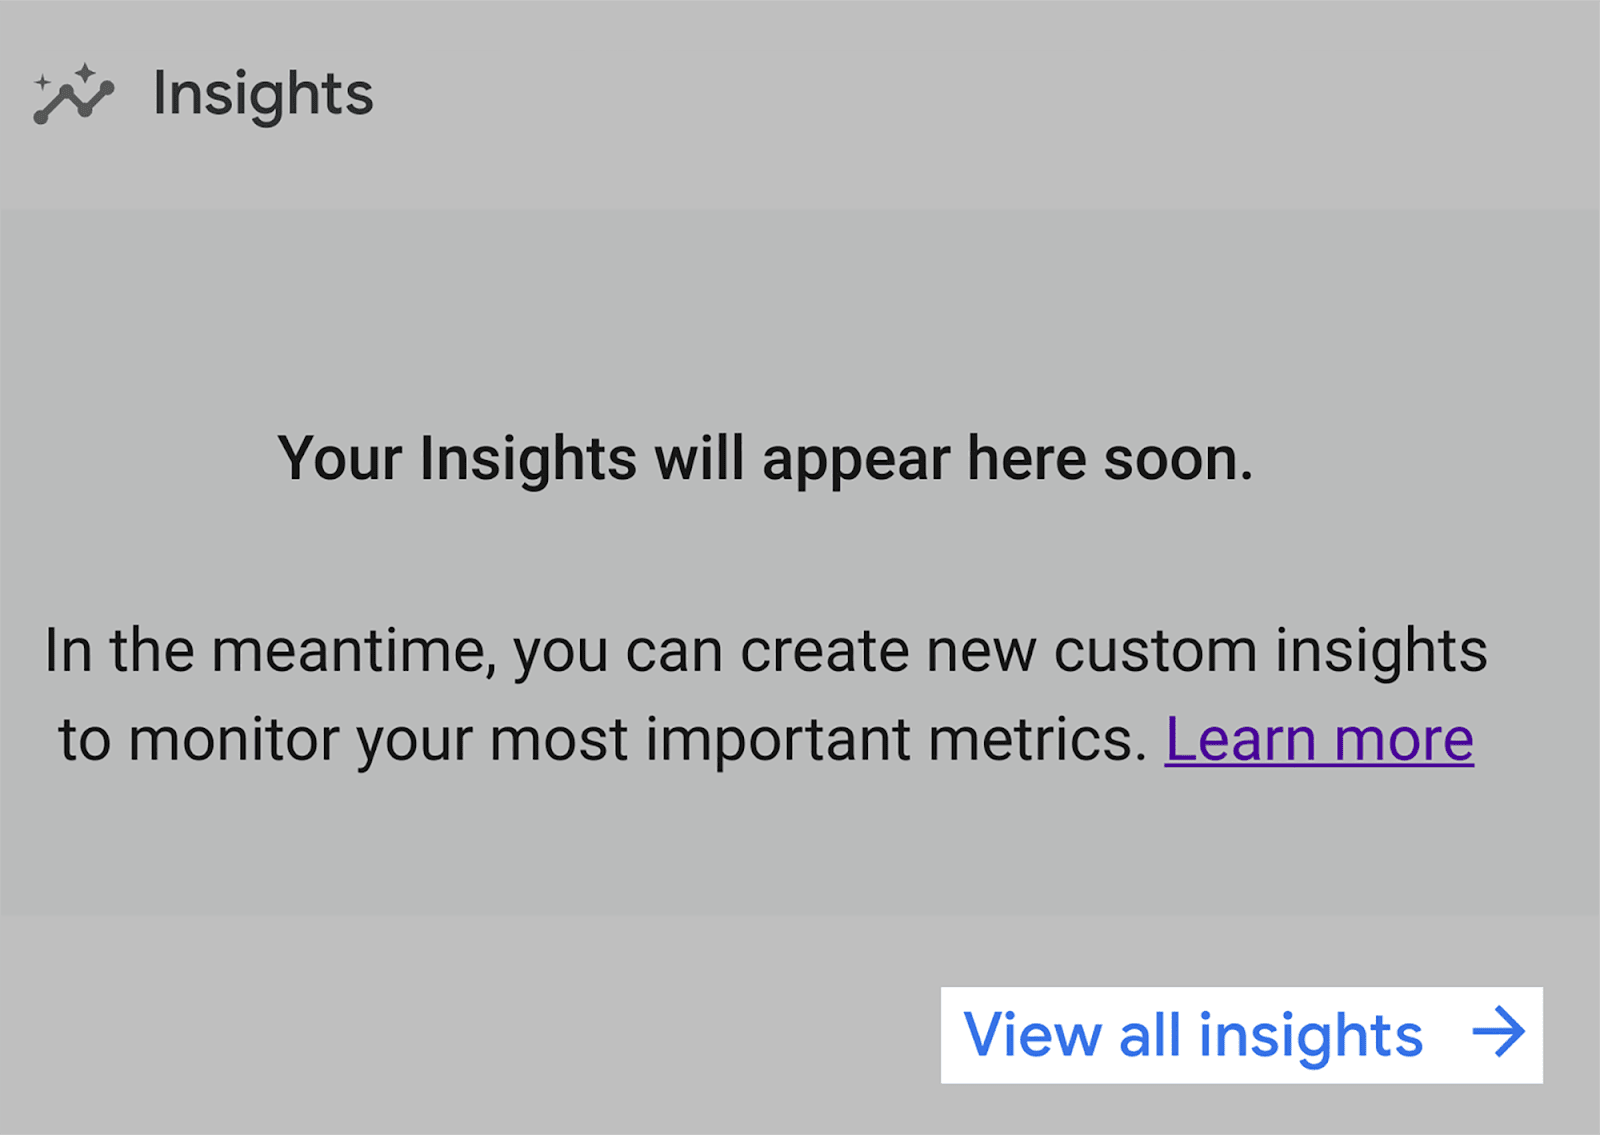
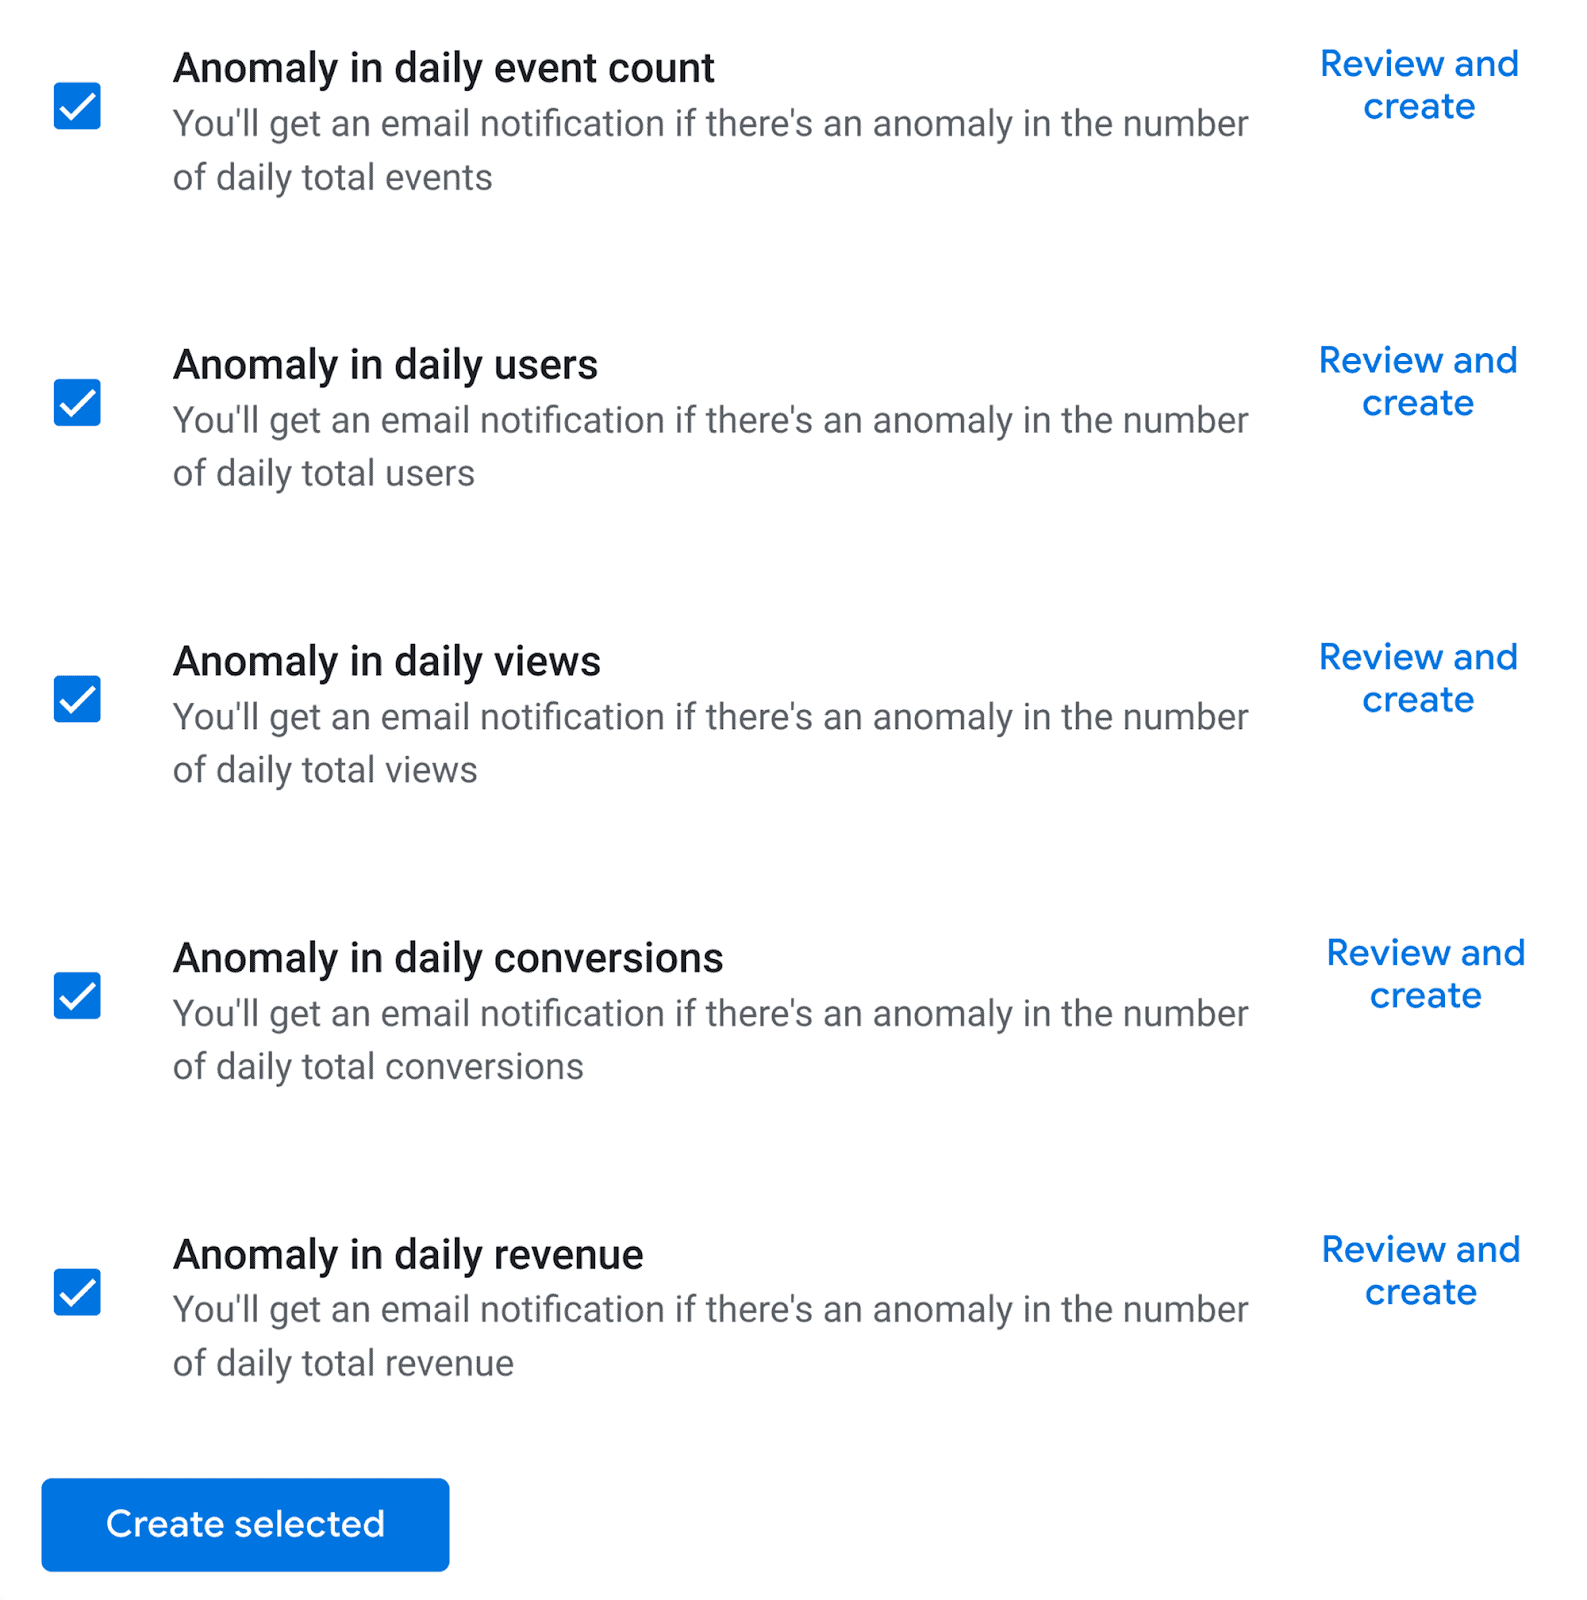
You’ll then land on this page. To customize your notifications, click on “Create”:

Then tick off whichever insight you’d like to receive email notifications for:
13. Content creation
SEO automation can be implemented in content creation — to a certain extent. As I already addressed in my ChatGPT for SEO blog post, AI can aid us in content creation, but it can’t be relied upon to totally overtake the content writing process.
ChatGPT can come up with a content outline and write in a specific tone of voice. However, when you ask AI to write a full article on your behalf, problems start to emerge.
AI-written content can be repetitive, shallow, and sometimes non-factual. AI is, after all, artificial — it can’t display any human insight, let alone E-E-A-T signals.
However, Google says that “automation can create helpful content”:
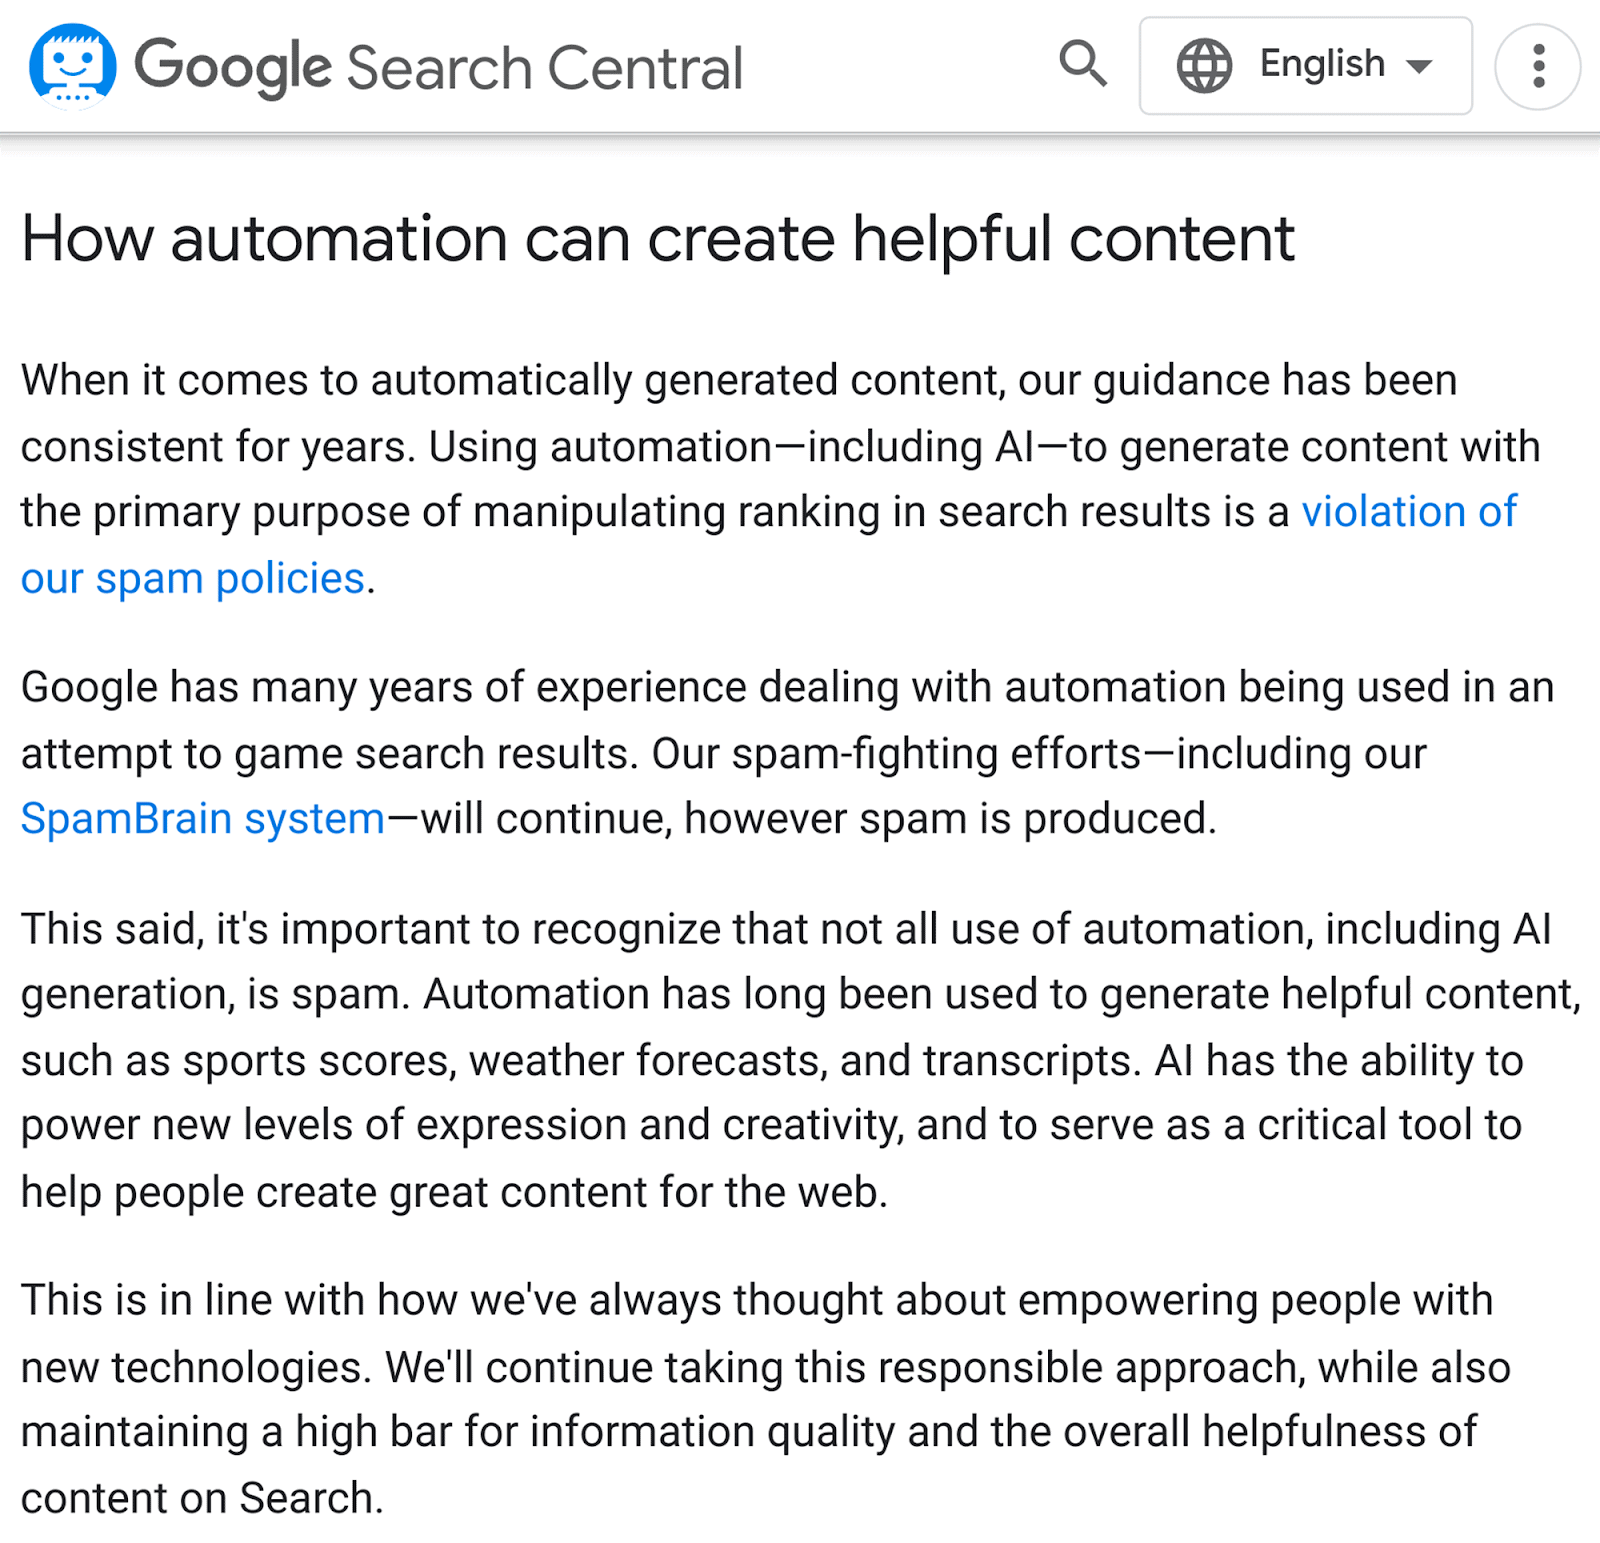
So, you can use AI to automate some features of the content writing process, so long as you’re careful not to allow it to take over fully.
One way that AI can be used to automate the content creation process is by creating article outlines.
For example, I asked ChatGPT to generate an article outline for “how to conduct competitor analysis”. Here’s the suggestion it generated:
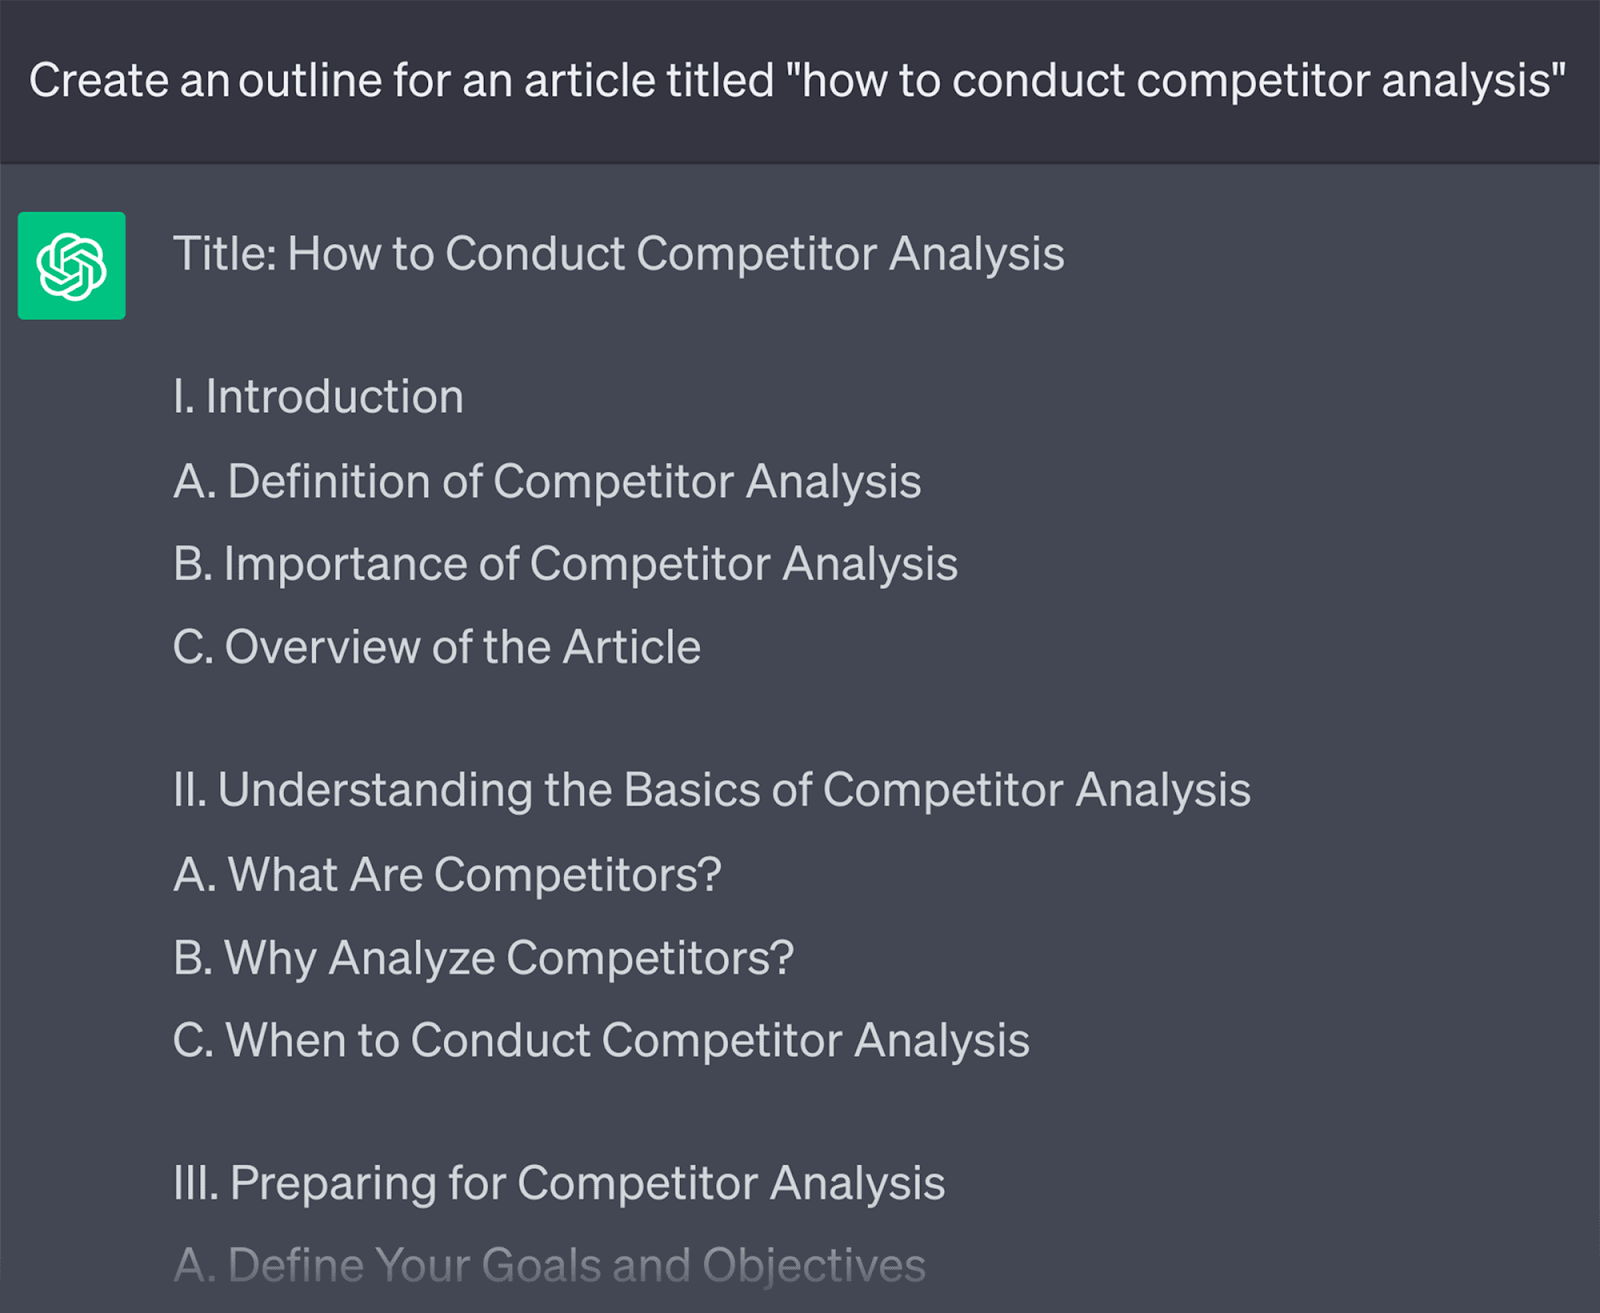
To generate this outline, ChatGPT refers to other articles that are written about the topic and comes up with a generic outline. While you may want to add in parts and take away others, at least you’re provided with the base of an article upon which you can build on.
You could go a step further and ask ChatGPT to write the full article for you:
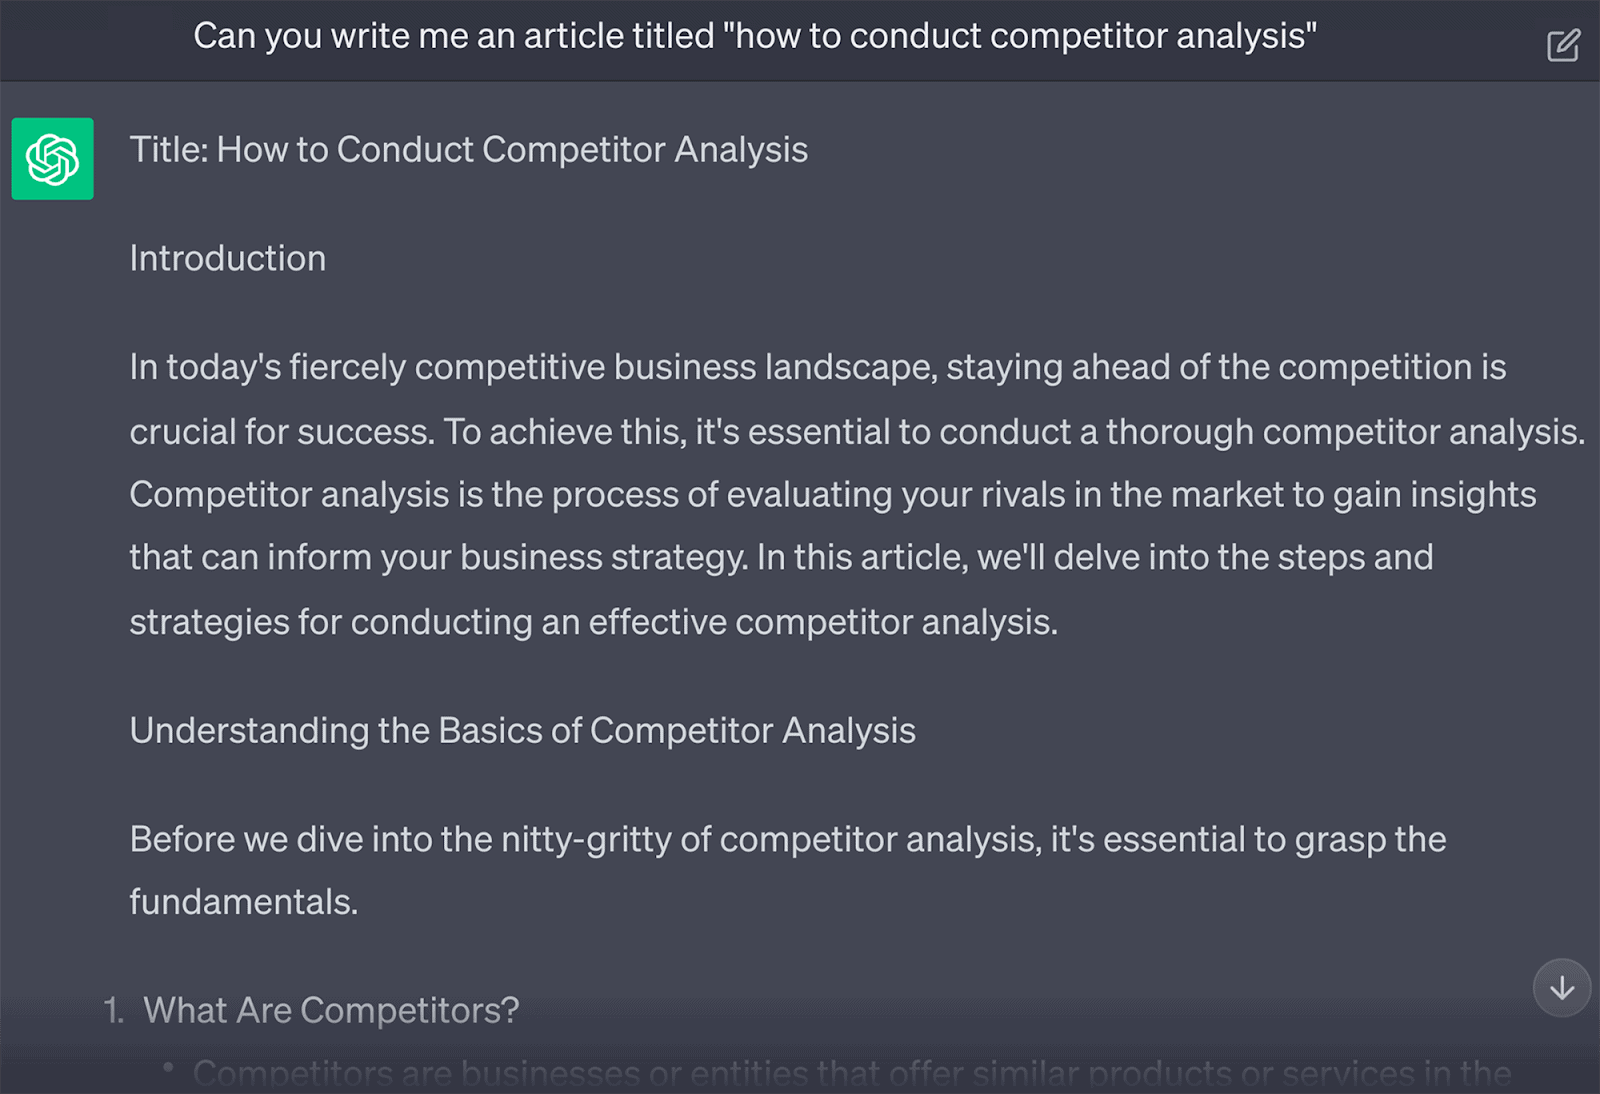
While this is definitely impressive, I wouldn’t recommend publishing this AI-written article immediately. It can be seen more like a first draft, onto which you can build more insightful ideas. Read through the article and add your own original research and arguments.
Delete any repetitive parts and also check for accuracy. ChatGPT’s knowledge is limited to 2021, so it won’t be able to provide you with data or new facts from 2022 or 2023.
In addition to content creation, you can also use ChatGPT to generate title tags, product descriptions, and meta descriptions.
For example, here’s what I got when I asked ChatGPT to generate a concise meta-description for my competitor analysis article:
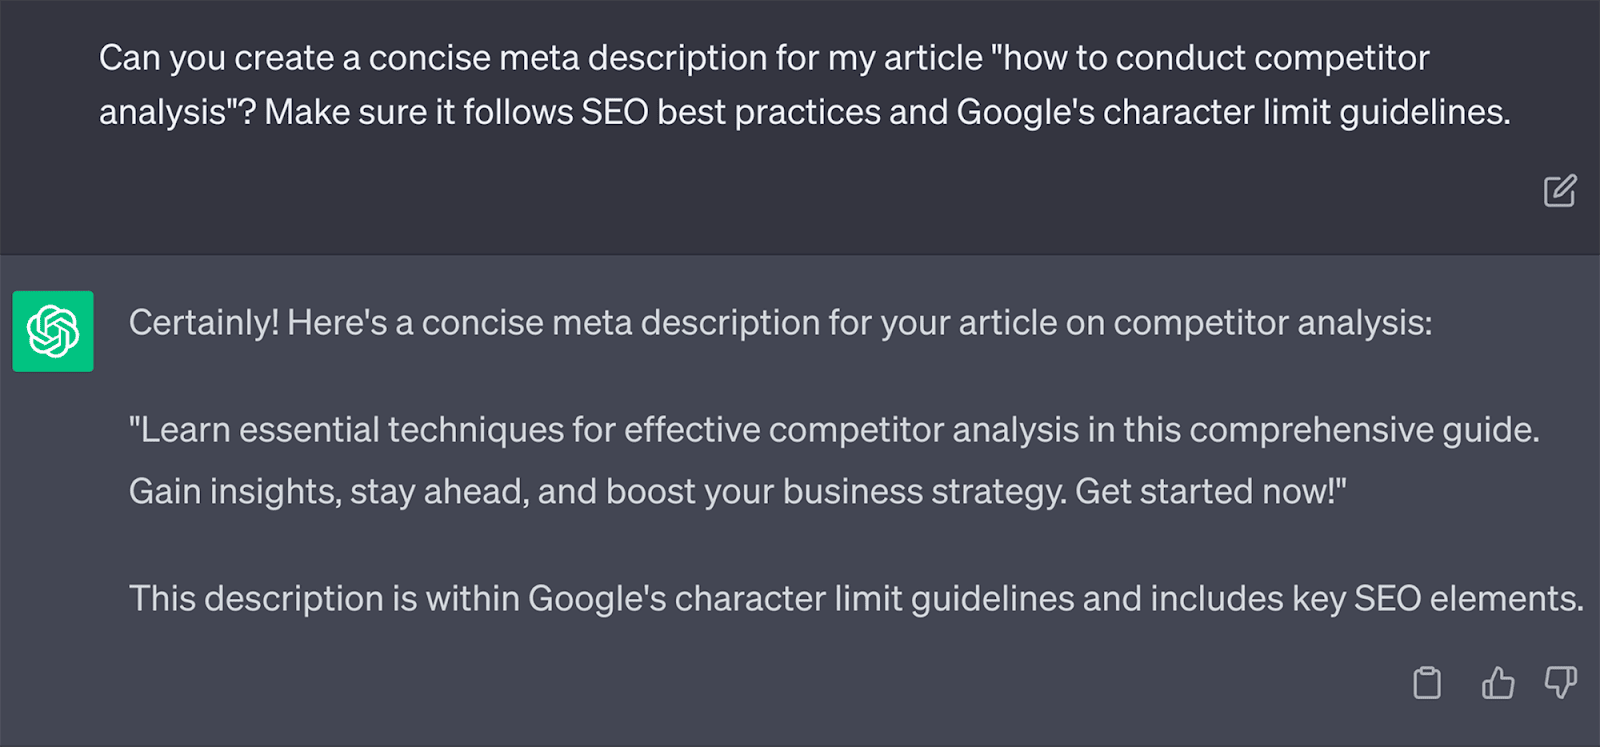
…which is, clearly, a concise meta description that can be read and understood both by humans and by web crawlers.
Using Semrush’s AI Writing Assistant
While ChatGPT is helpful for creating content based on prompts, there is another tool you can use that can make the automation of content creation even easier.
Semrush has its own AI writing tool, called AI Writing Assistant.
Instead of feeding this tool individual prompts, AI Writing Assistant has 76 tools that you can use to automate 76 different SEO writing tasks.
While AI Writing Assistant wasn’t made by OpenAI (like ChatGPT), it is modelled off it. So, you can find the same level of accuracy on AI Writing Assistant as you can on ChatGPT.
To use this tool, you’ll need to download it from the Semrush App Center first.
A free version is available, which gives you 1,500 credits (or 1,500 words) to use in the tool each month.
Once you download AI Writing Assistant, you’ll be shown the main dashboard, which looks like this:
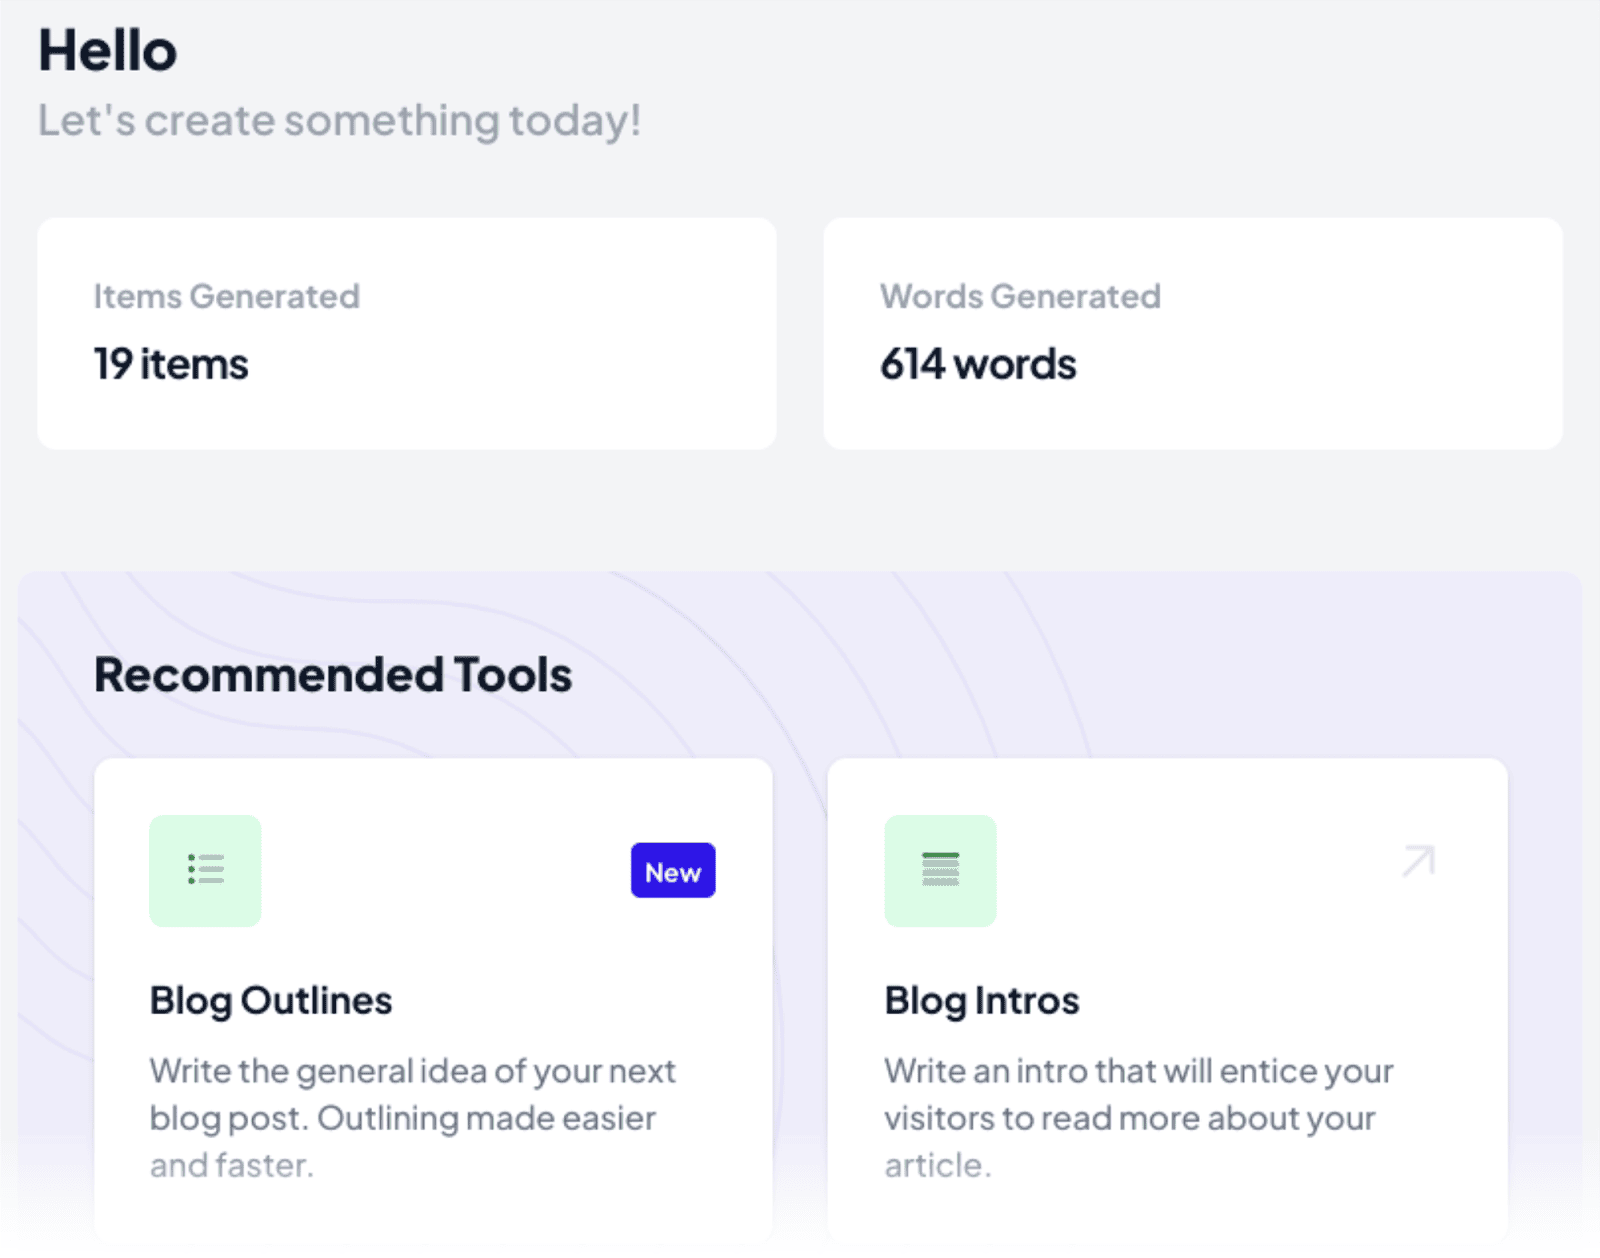
If you select the “All Tools” option in the menu on the left:
You’ll be able to review all 76 AI tools you can work with on the platform.
Semrush conveniently splits up the 76 tools into 5 categories:
- Blog Content
- Website Copy & SEO
- Social Media & Ads
- Marketing and eCommerce
- More Tools
While I’m not going to explain how to use all these tools individually, I will explore its content writing tool to give you the gist of how you can use AI Writing Assistant.
Click on the Blog Content tab and then select “Article Generator”:
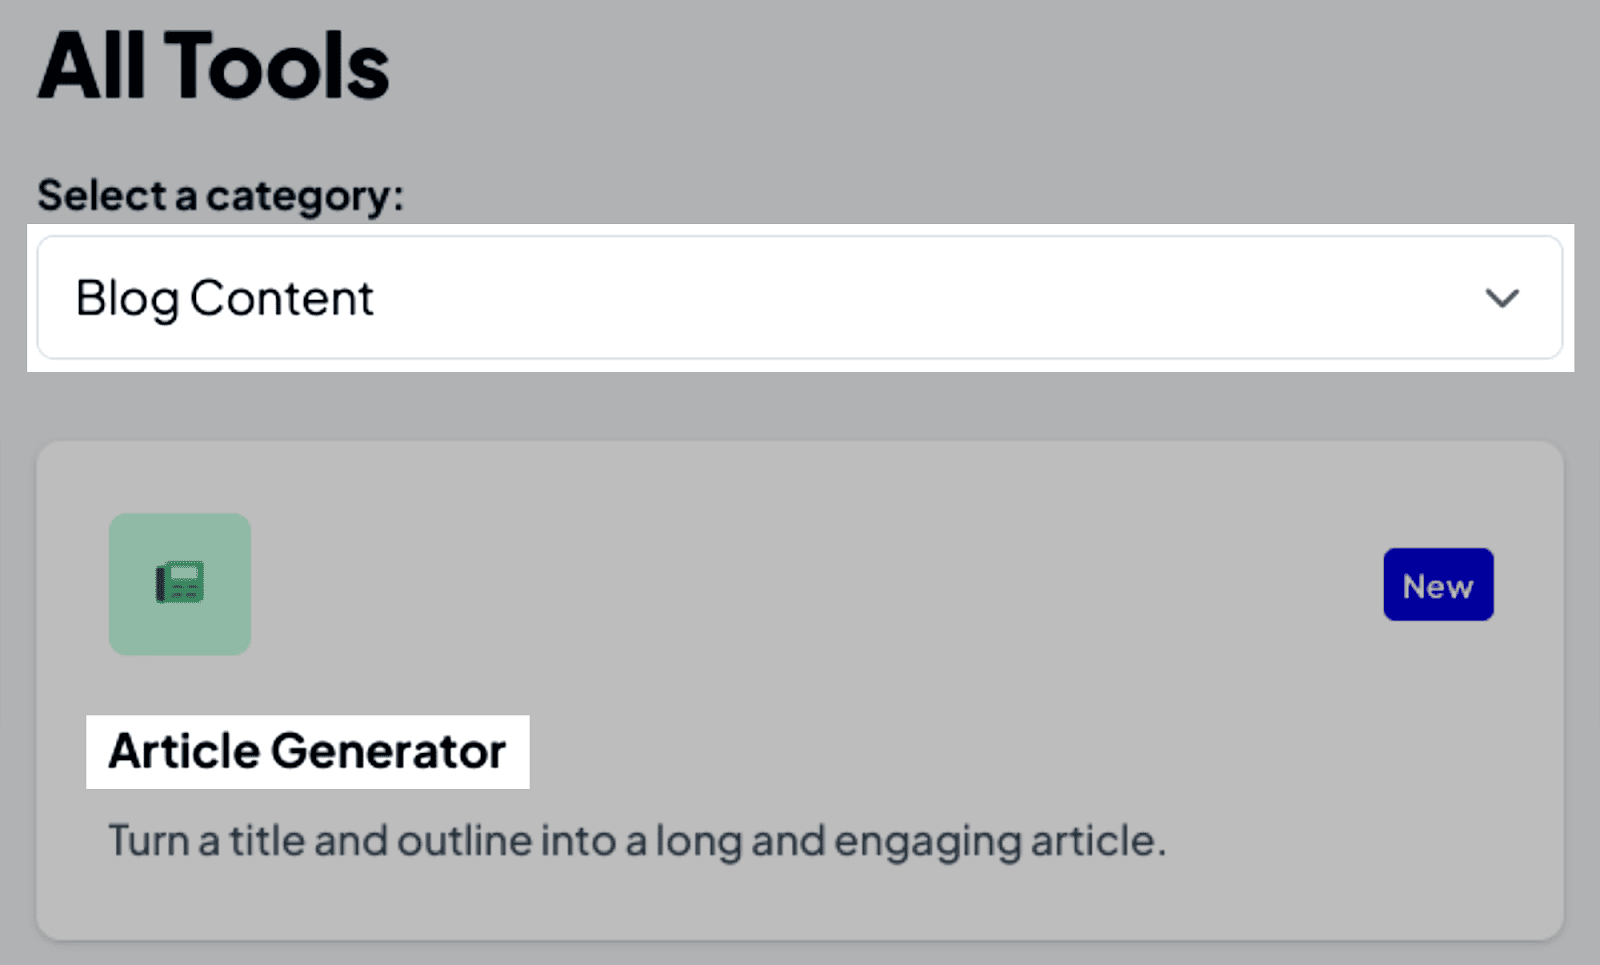
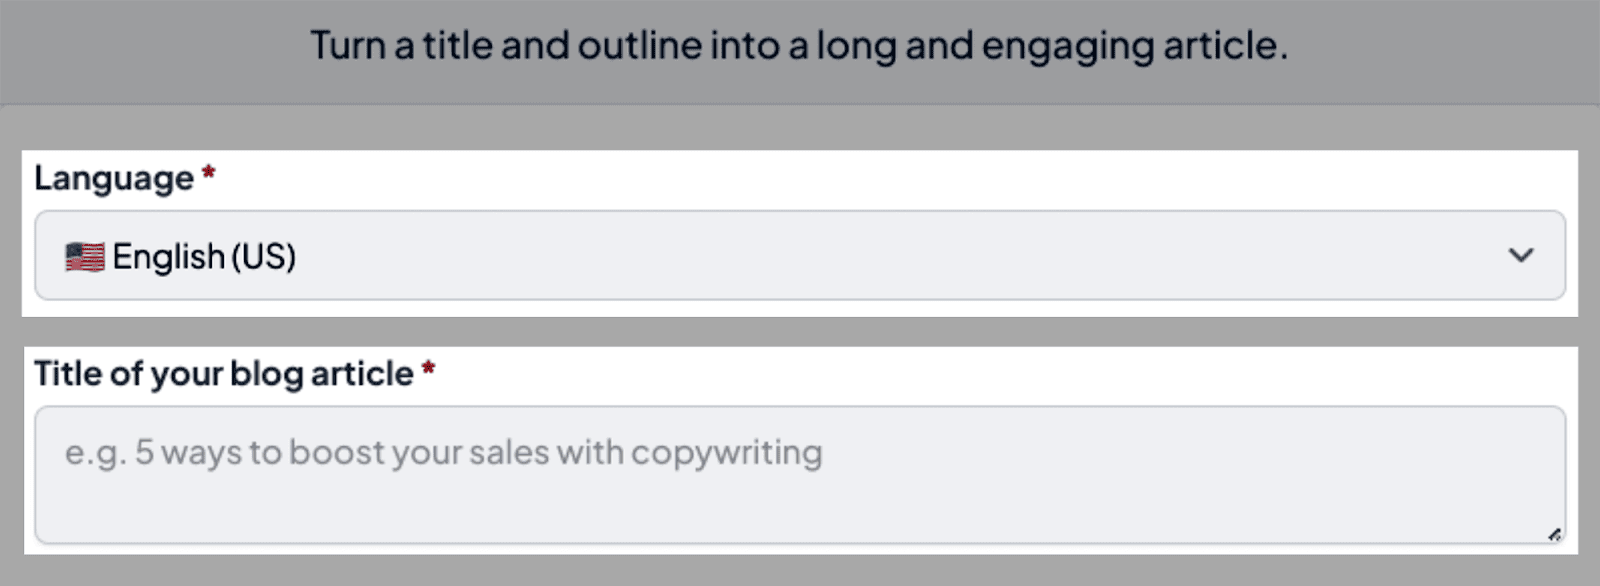
Here, you can select your language and article title:
…you can also include your keywords and subheadings.
For example, here’s the basic outline of the article I want the AI Writing Assistant to come up with:
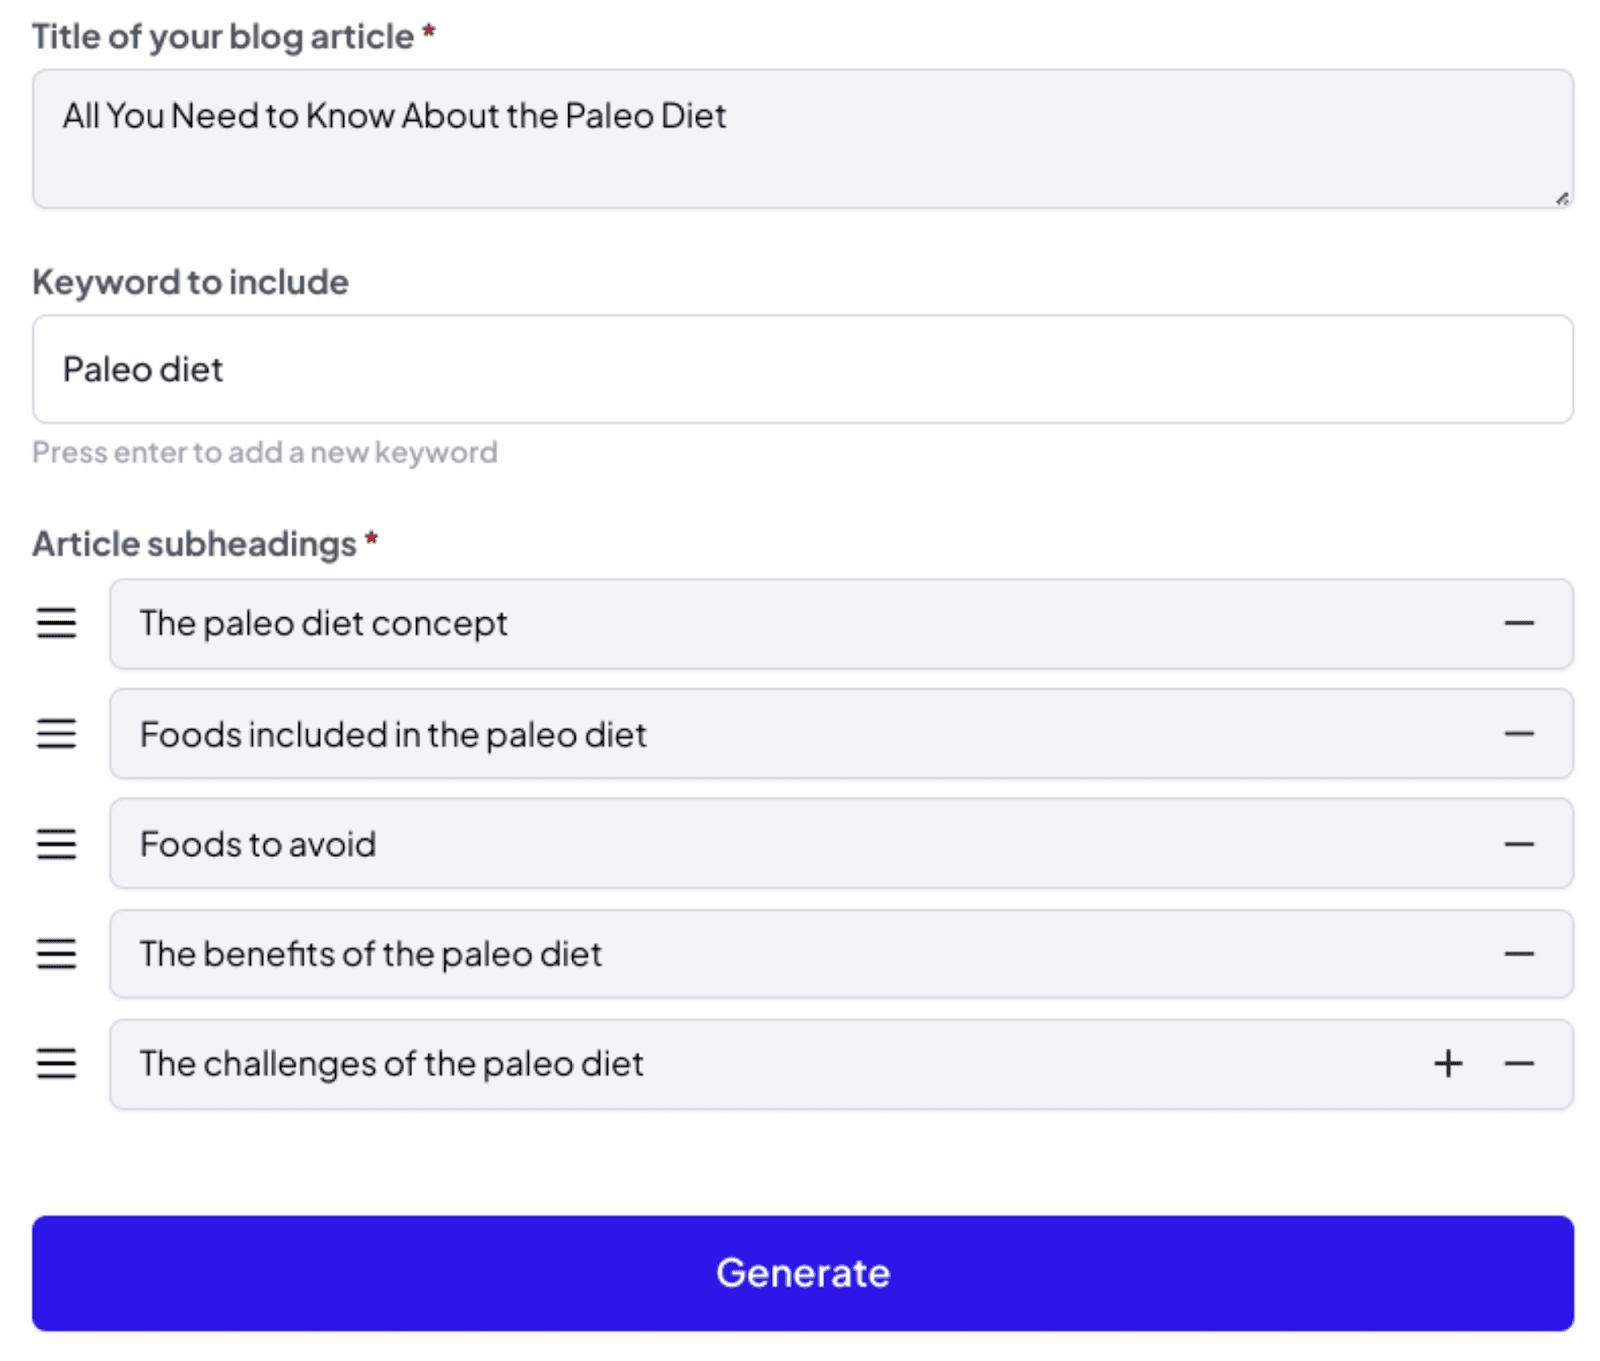
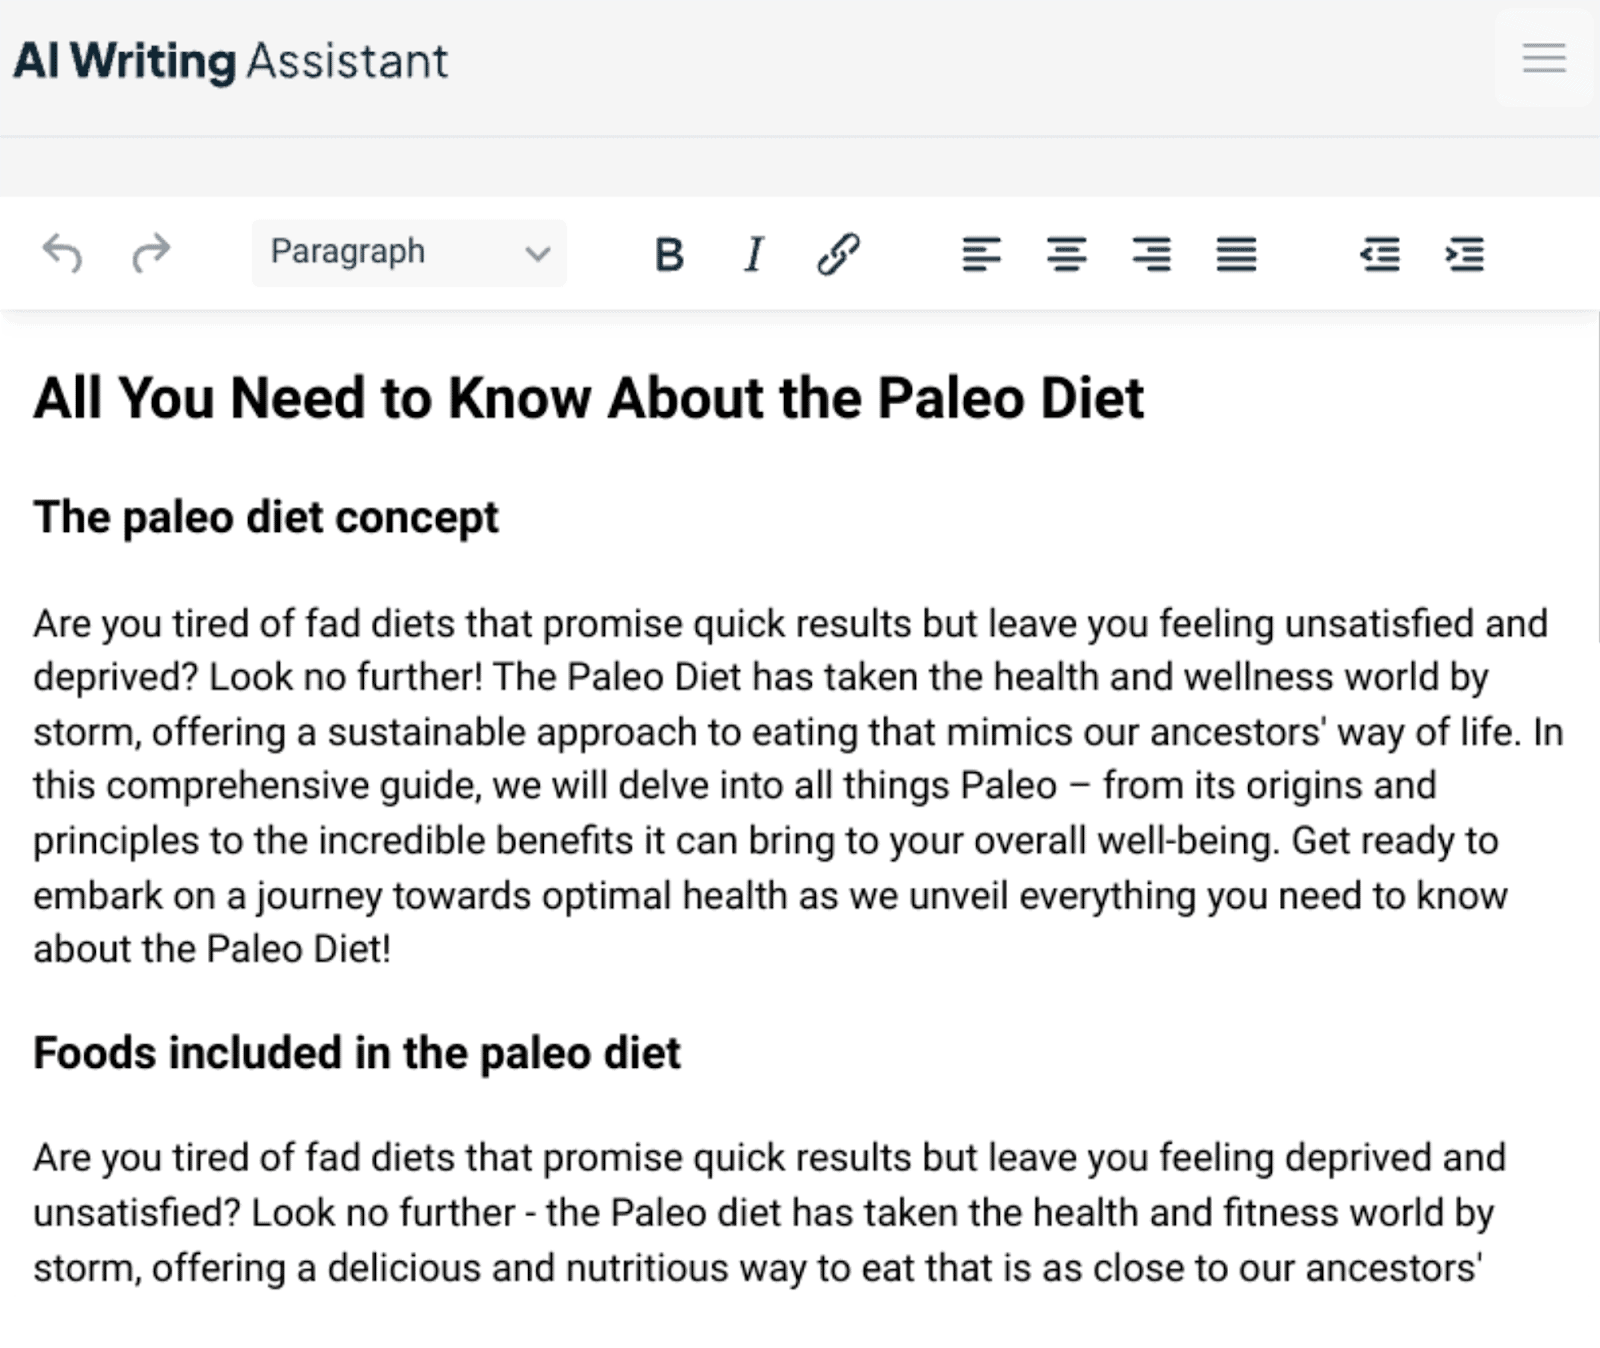
After I click “Generate”, the AI Writing Assistant will come up with an outline for the article in a matter of seconds:
What I like about the AI Writing Assistant tool is that it gives me an SEO score on the right-hand side:
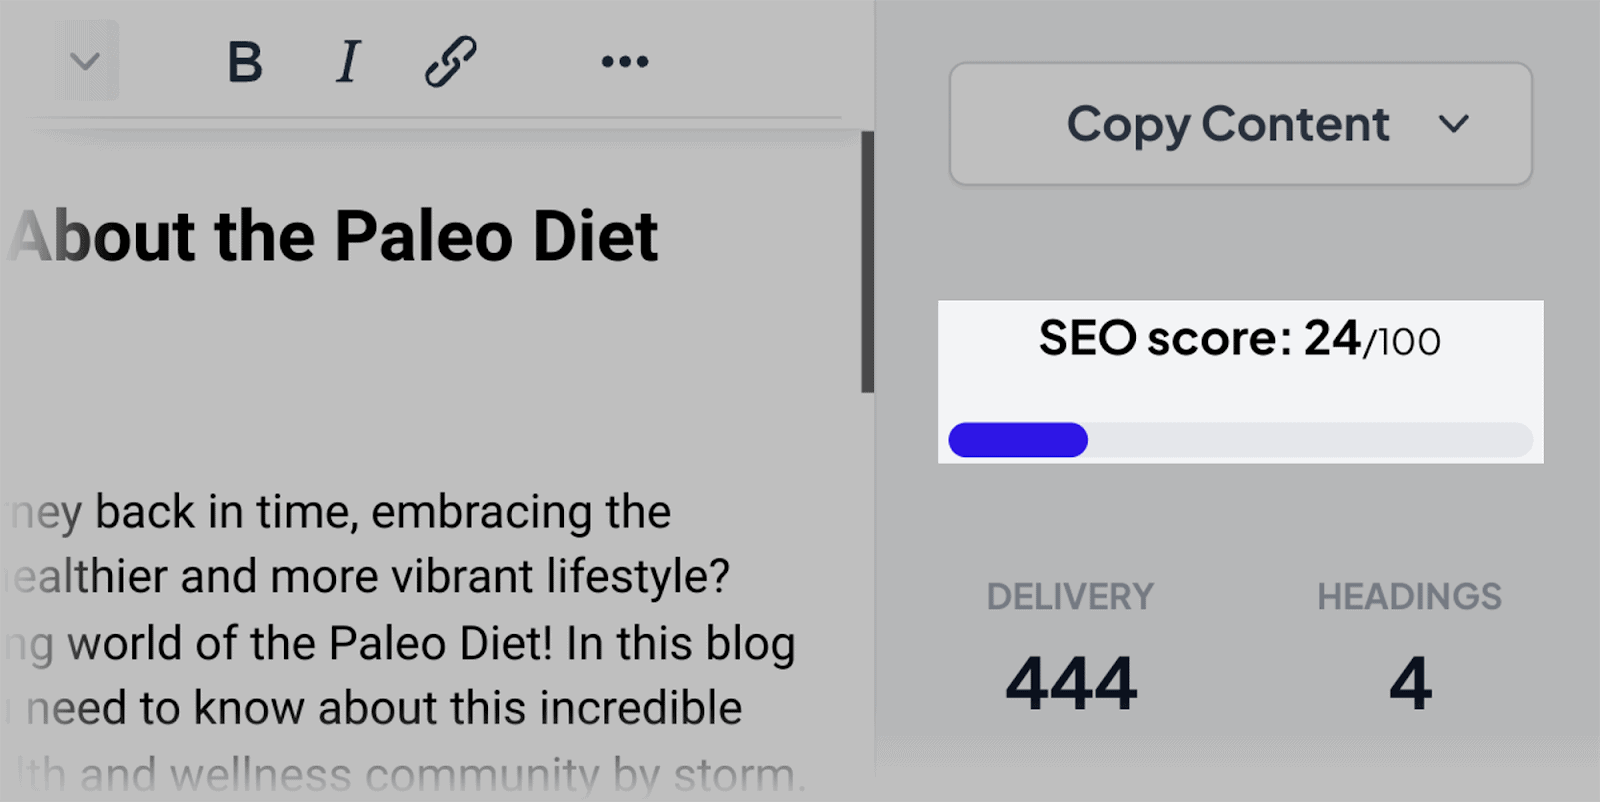
This helps me gauge how much optimization the article requires.
Plus, it also has a handy plagiarism checker. This gives you a percentage of how much plagiarism is detected in the written copy:

Overall, the AI Writing Assistant tool gives me a basic article to work with, which I can expand upon with my own research.
If you need assistance on how to improve the article, you can click on the Content Analysis section on the right-hand side:
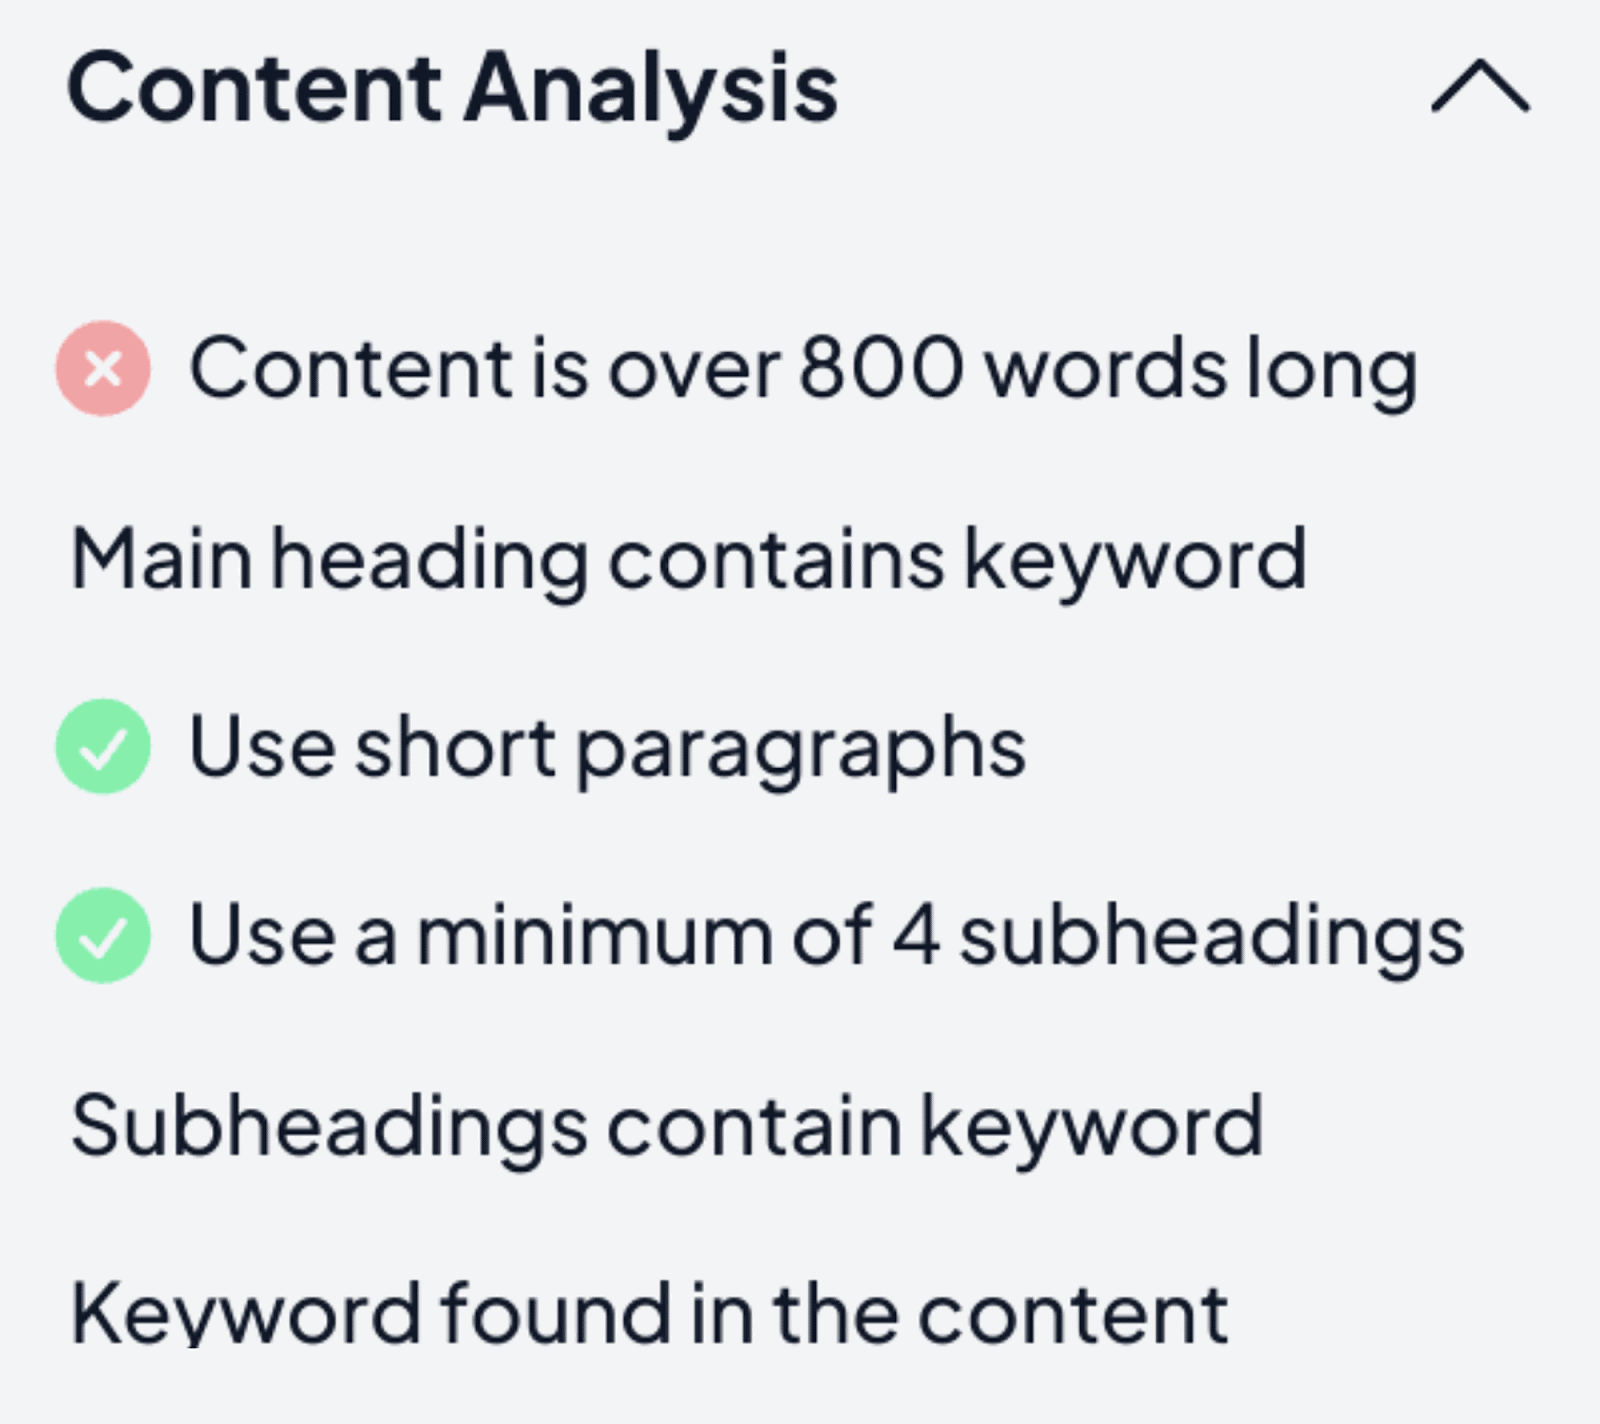
Pretty cool.
Earlier, I showed you how to create meta descriptions using ChatGPT. Here’s how to create them using Semrush’s AI Writing Assistant:
From the “All Tools” section, select “Website Copy and SEO”:

…and then look for the Meta Titles tool:
Once you click on this, select a creativity level, provide your targeted keyword and website information.
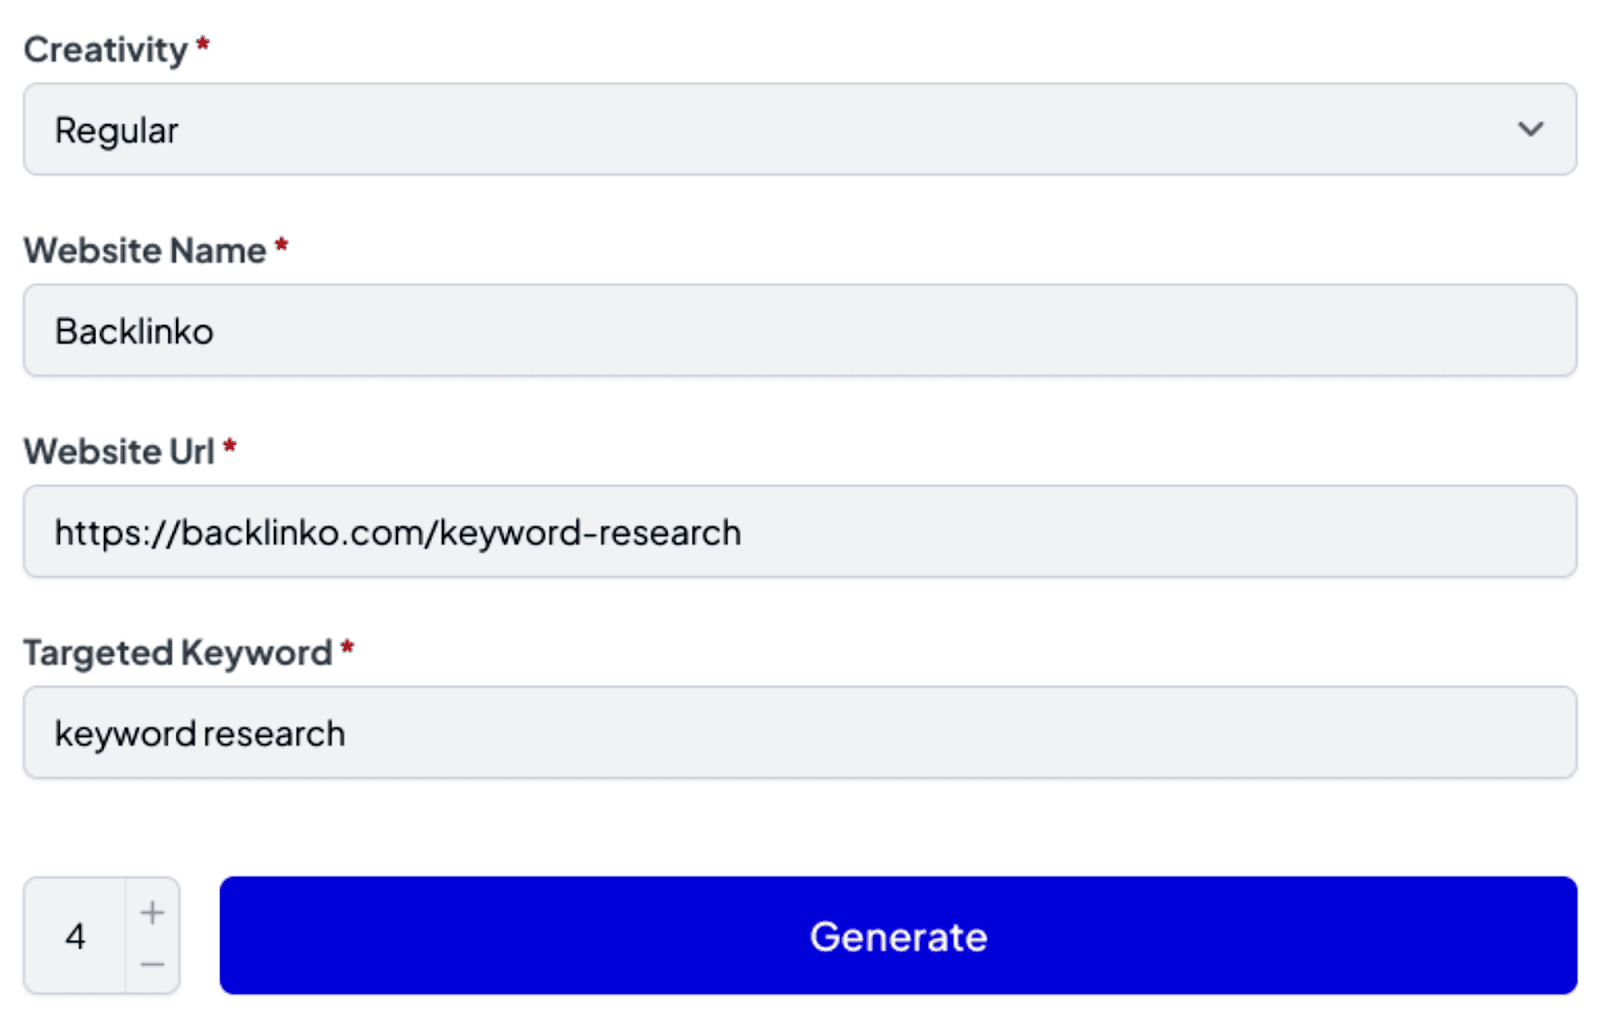
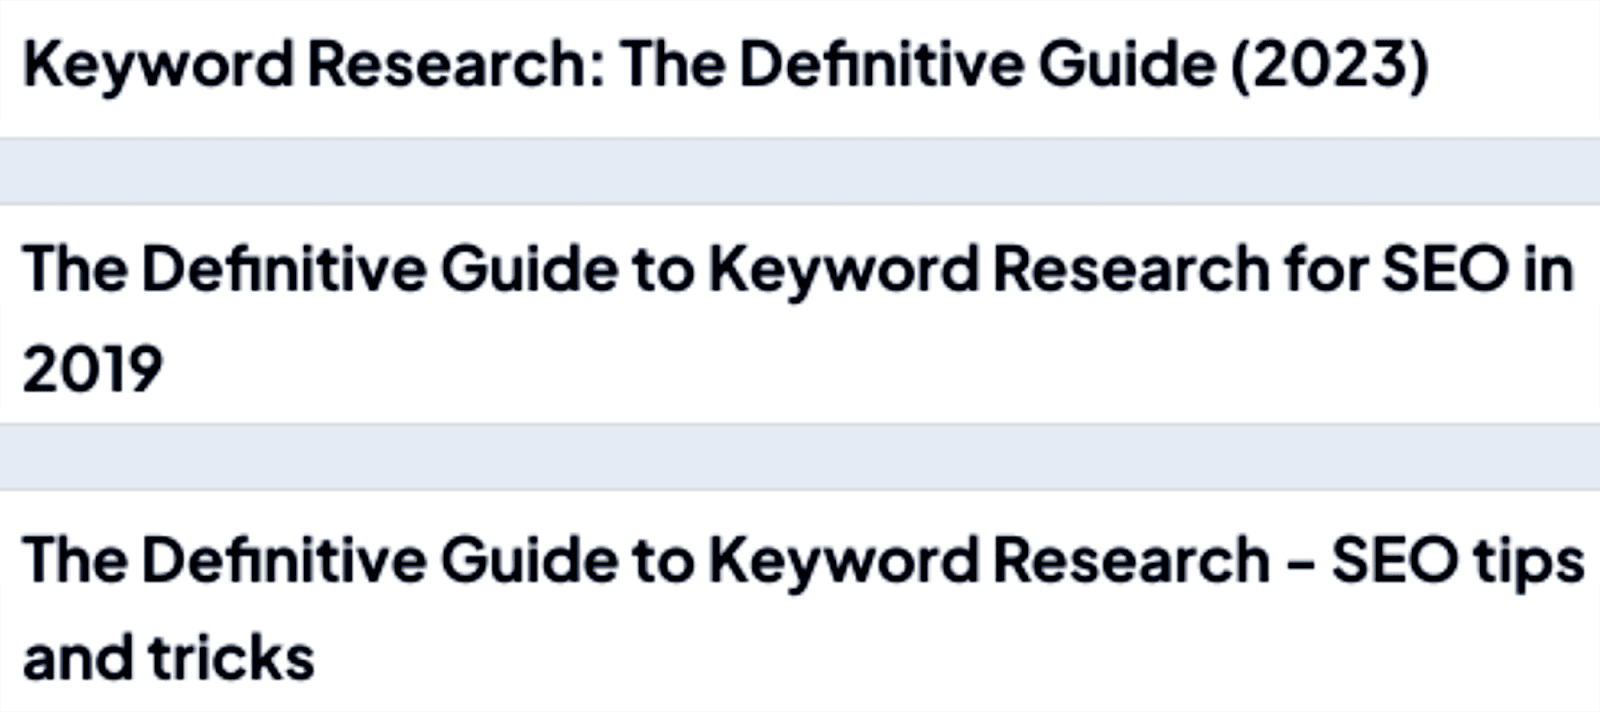
After you click “Generate”, the tool will give you a selection of suggested meta titles:
14. Automate Schema Markup code
Before, you needed to be a proficient coder to understand schema markup code and write your own. However, this is no longer the case: you can now use ChatGPT to automate the code on your behalf.
For example, say I run a cooking website that posts recipes, I can ask ChatGPT to create schema markup for one of my recipe pages…

…and here’s the code that ChatGPT provides:
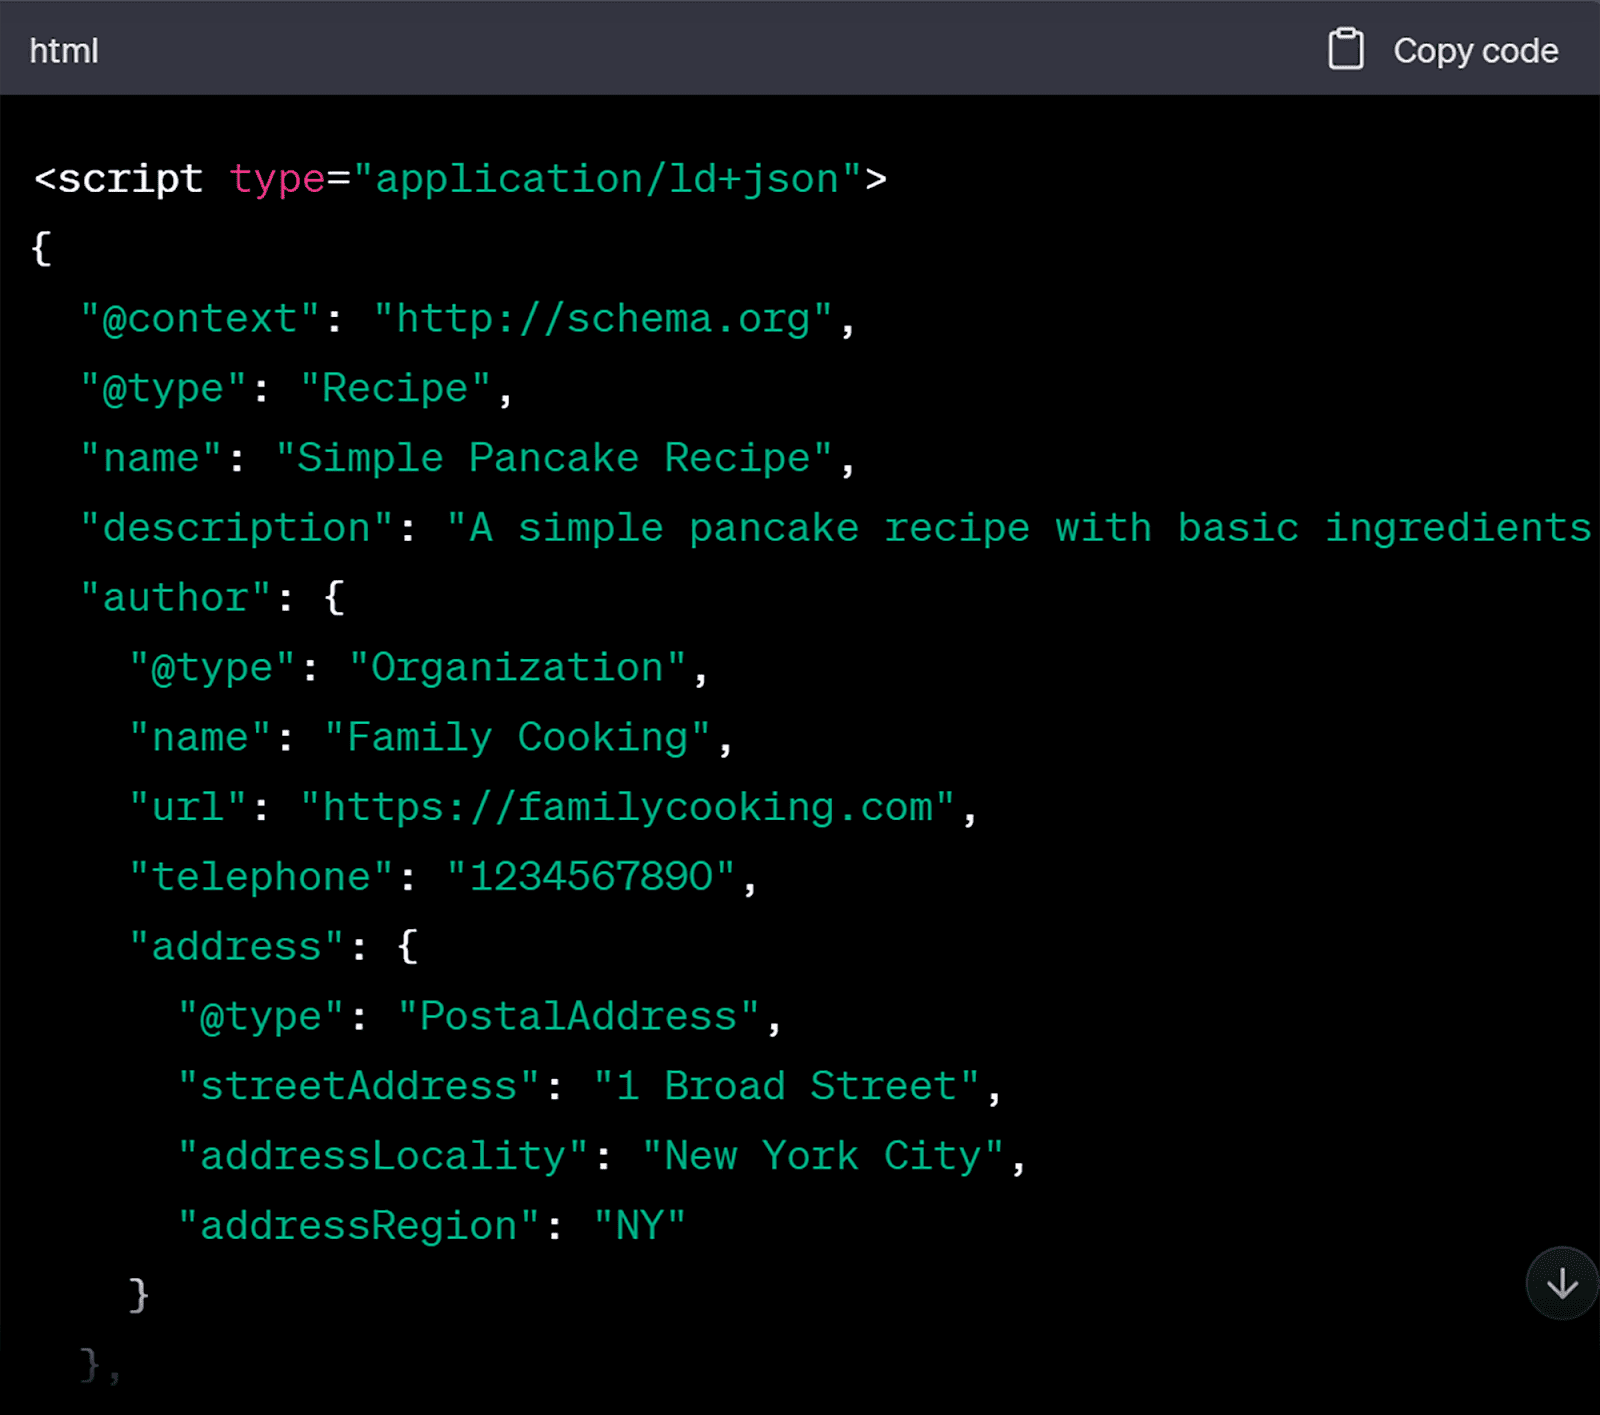
I always recommend that webmasters double-check their code on the Schema Markup Validator tool. This tool will be able to confirm whether the code has been written correctly.
If the code is correct then all you need to do is implement it on your page.
15. Automate image optimization
Un-optimized images can present a significant challenge to your web page performance and SEO efforts. While having large, high-resolution images might be visually appealing, they can slow down your page loading times.
Slow-loading pages not only frustrate visitors but also negatively impact your site’s search engine ranking. Google prioritizes delivering a seamless user experience.
If your pages take too long to load due to un-optimized images, it can lead to higher bounce rates and diminished organic visibility.
On top of that, images that are not properly optimized can consume a large portion of bandwidth. This causes data-heavy pages and can drive up hosting costs.
You can use tools like Google’s PageSpeed Insights or Lighthouse to get a report on your site’s performance in terms of load speed. These tools will also be able to identify the issues that are slowing down your page loading times — which could include your image sizes.
If images are the problem, the tools will be able to highlight which images specifically are causing the problem.
To use Google’s PageSpeed Insights (PSI), head over to the tool and paste in your domain name or a specific URL you want to analyze:

After you hit “Analyze”, scroll down to the “Opportunities” section and click on “Properly size images”:
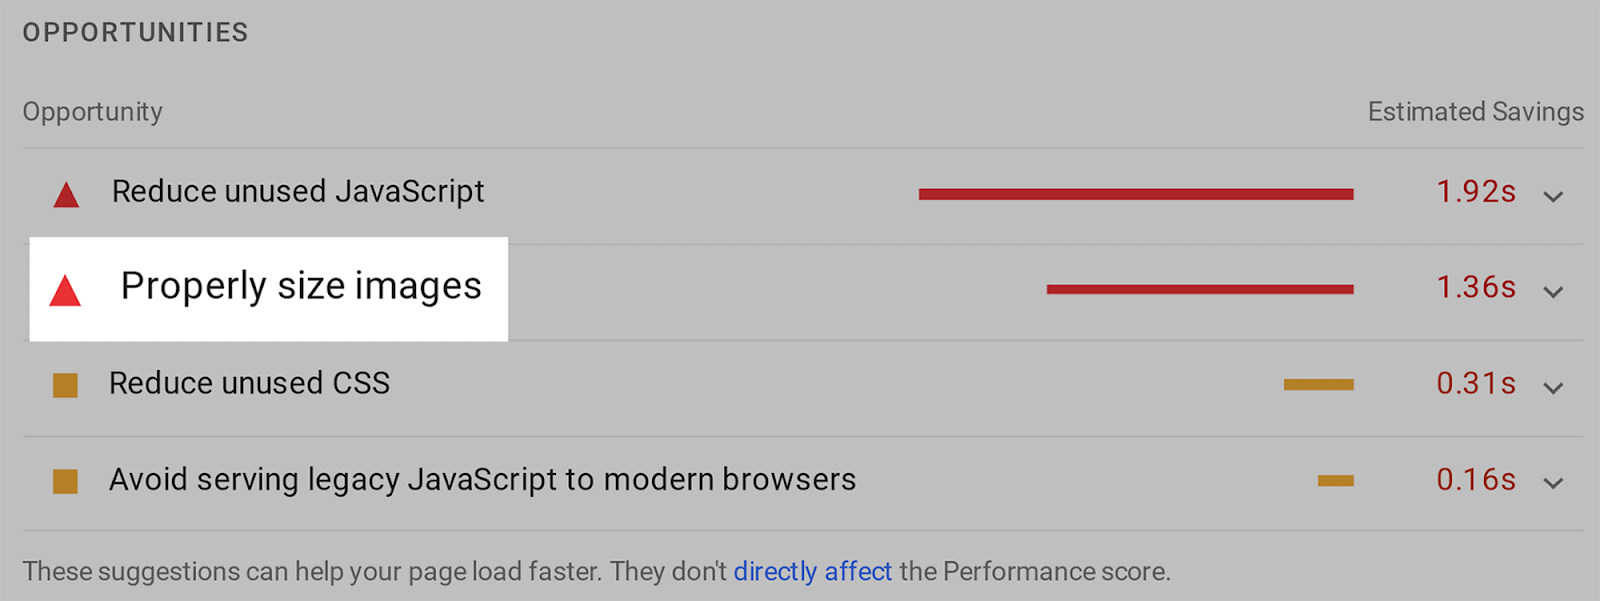
Here, you can uncover images that could be resized to potentially reduce your page load time:
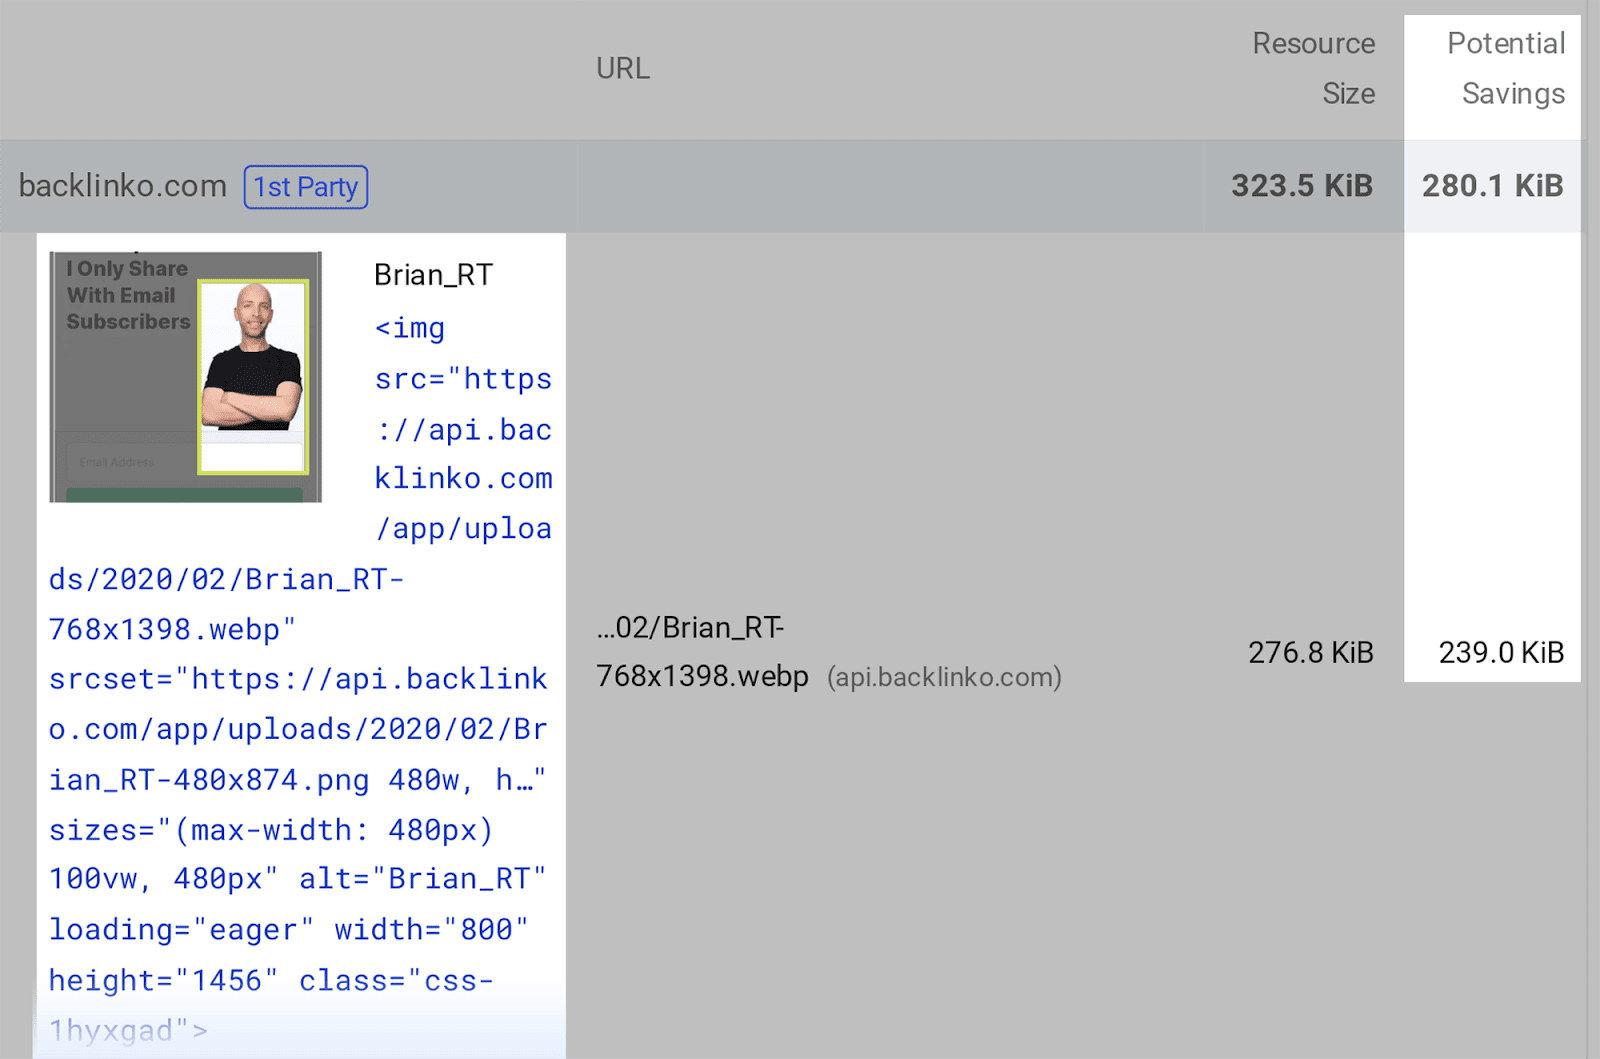
Doing this manually will take forever to do, especially if you have a large number of images on your pages. Thankfully, PSI speeds up this task. From here, all you need to do is take note of the images you need to optimize.
If you’ve got a whole website’s worth of images to compress, then you can use a tool like Bulk Resize to complete this task for you. This tool allows you to batch-process several images at once.
Head over to Bulk Resize and select “Choose Images”:
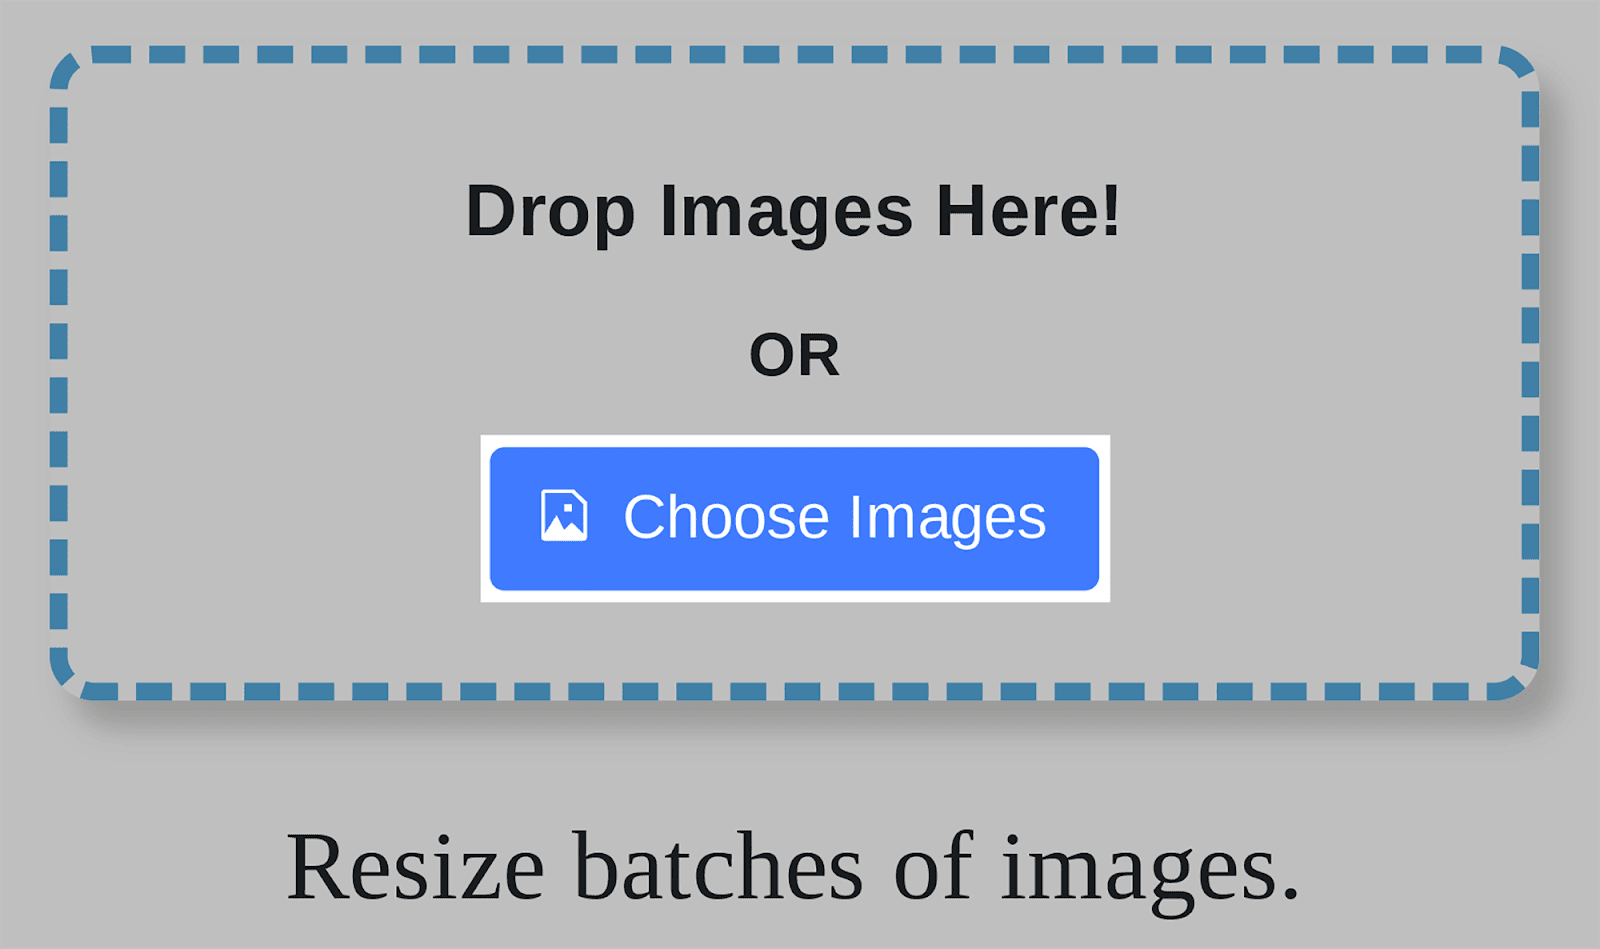
Next, select all the images you’d like to resize.
Once added, you can choose which percentage of the original dimensions to scale the images to. You can also choose which image format you’d like to convert all the images to:
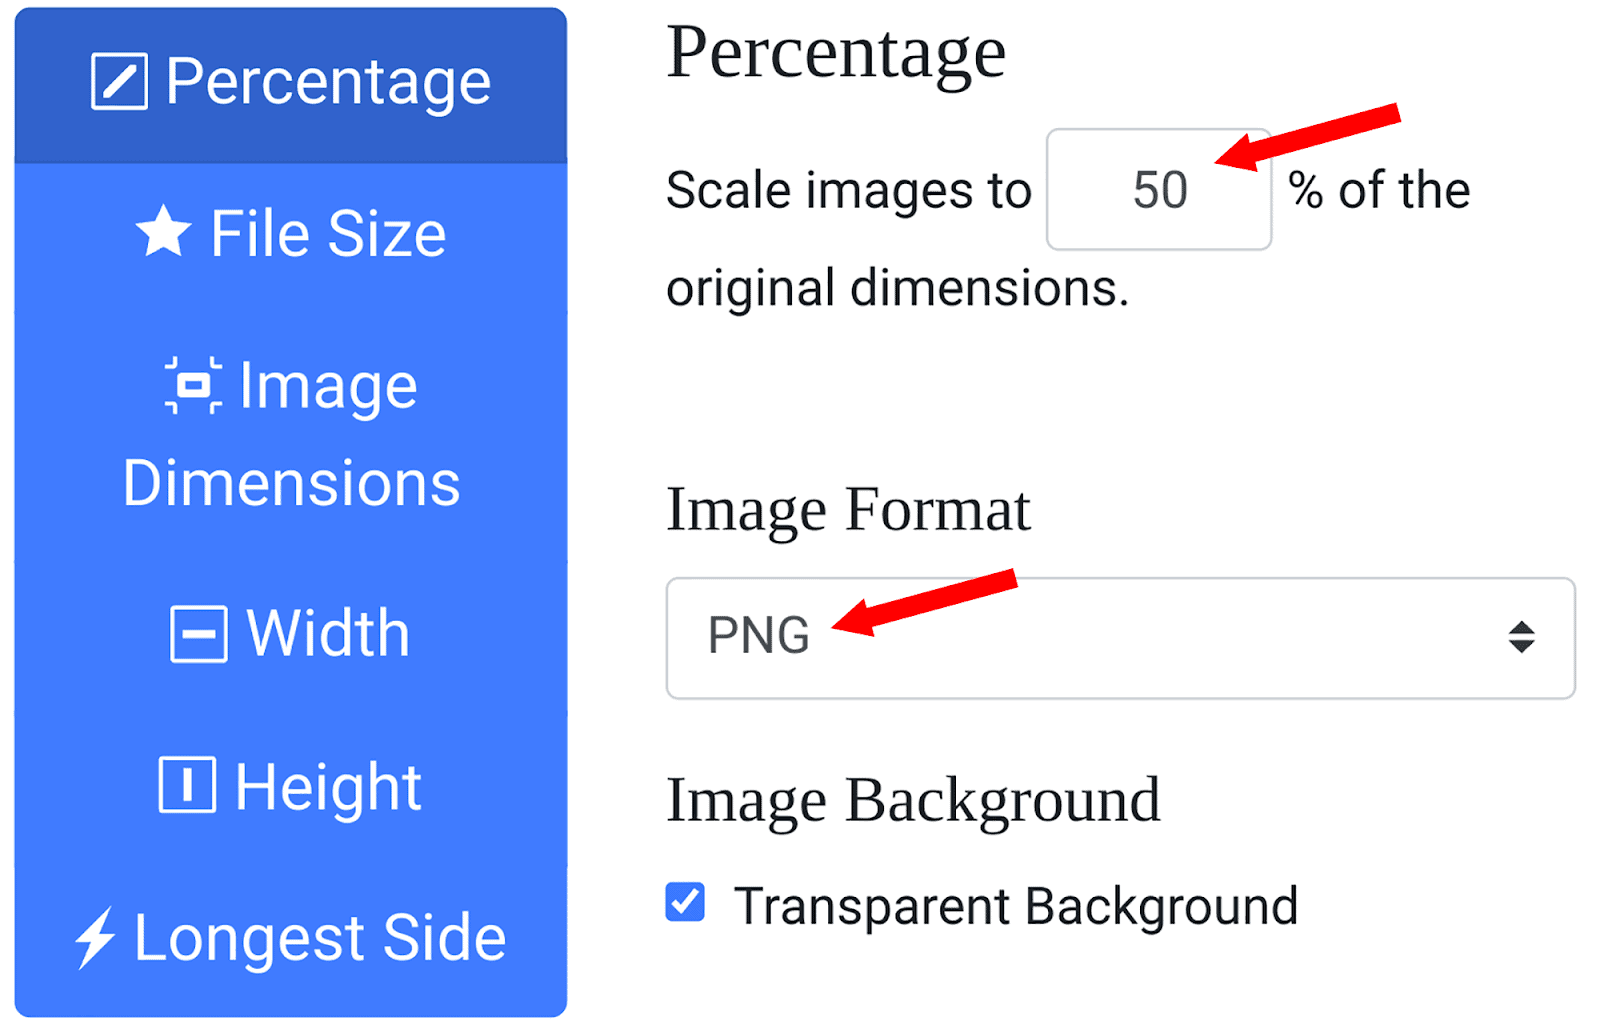
But which image format do you choose? WebP offers the best image quality overall, even after compression. They’re also lighter than PNGs and faster than JPEGs. However, they’re not supported on all browsers.
At Backlinko, we normally switch the image format to PNG because they don’t lose their clarity once compressed.
Once you’ve chosen an image format, you can head over to “Width” and choose the pixel size you want, and hit “Start”:
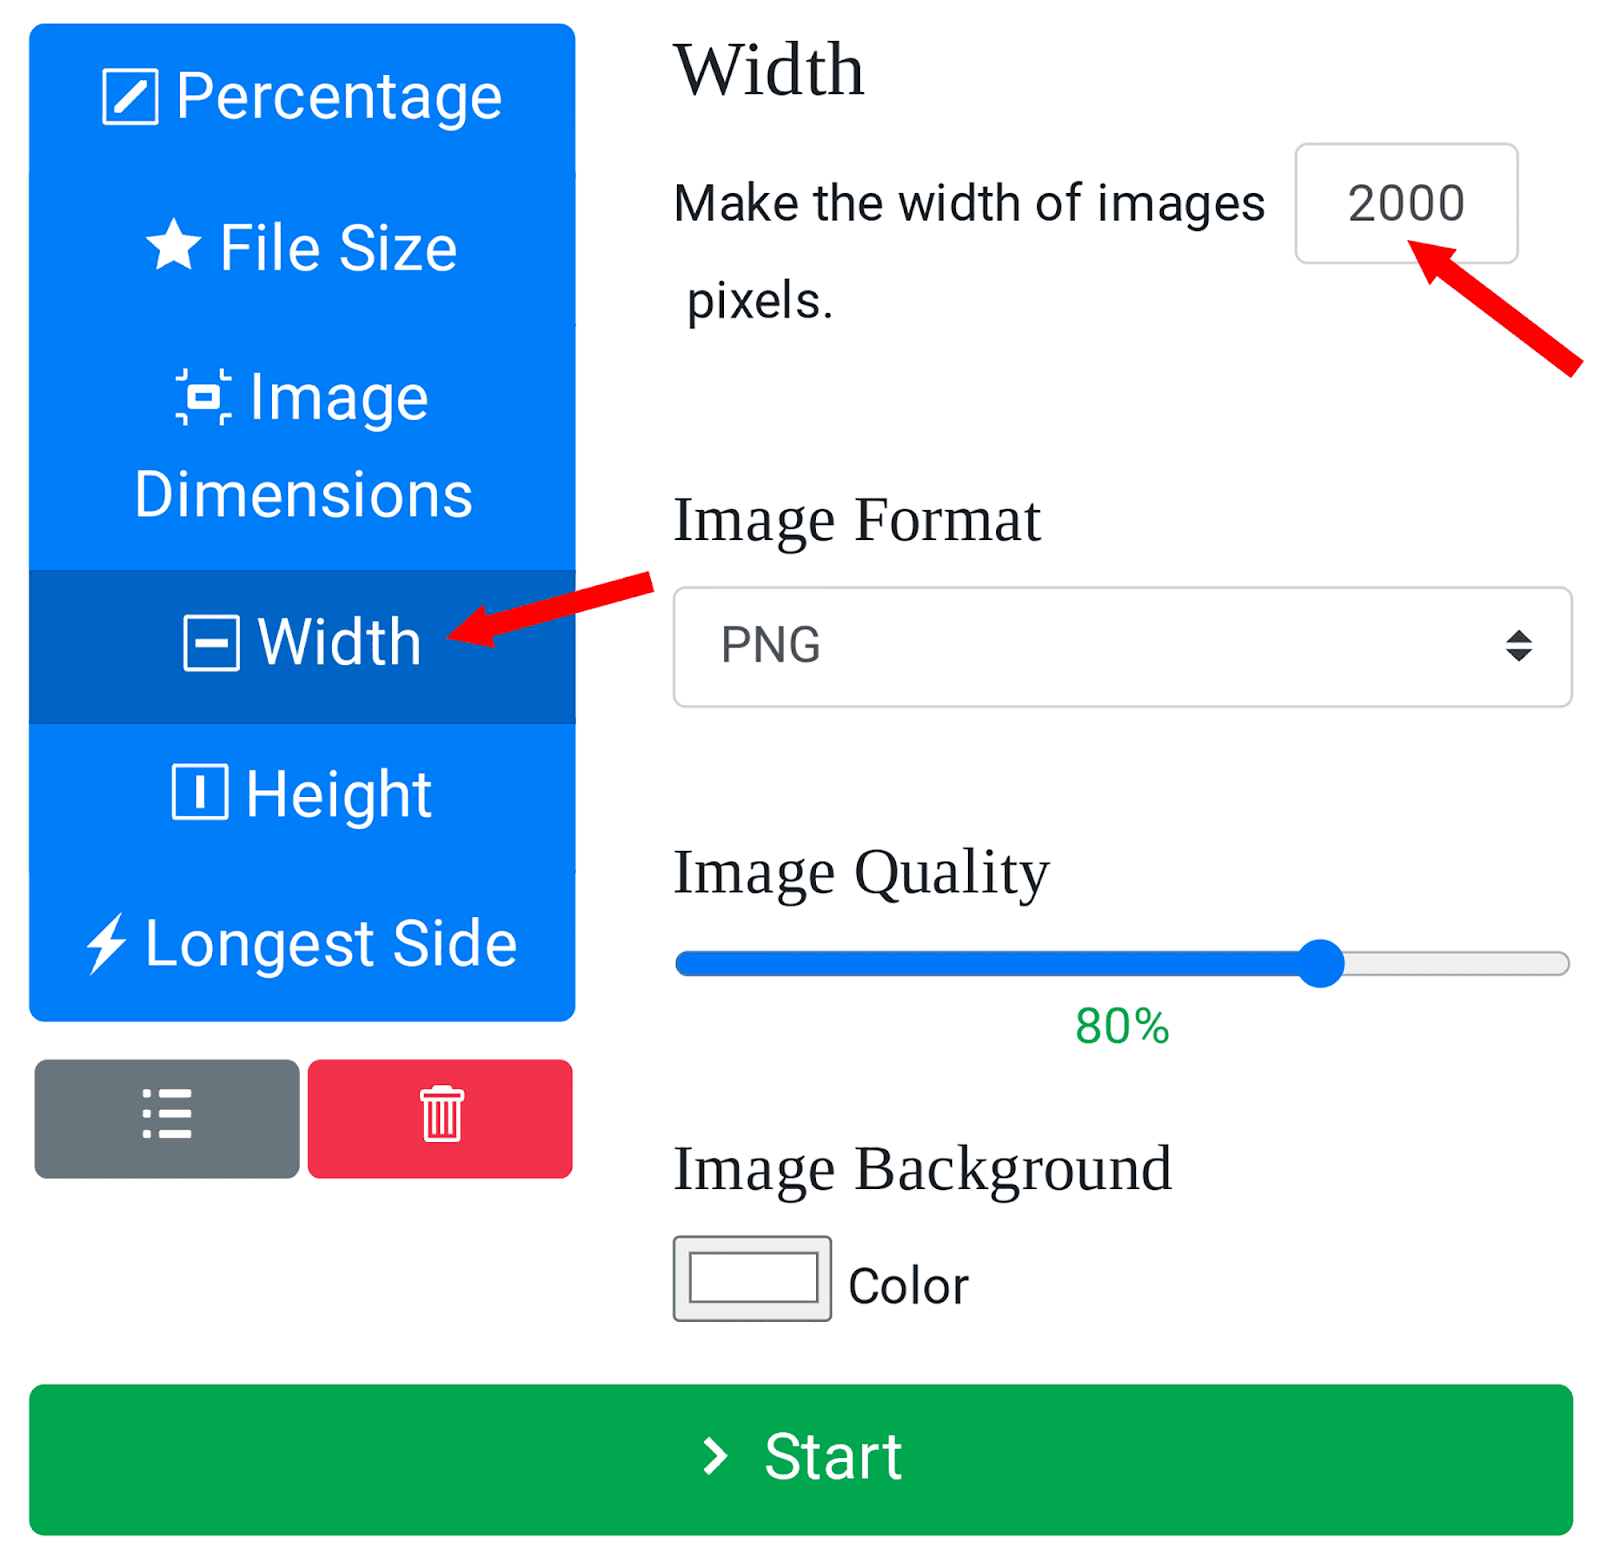
If you’ve selected a few images to resize, the resizing process may take a few seconds. Once all the images are ready, your computer should download the resized images automatically.
This tool saves you lots of time from performing this task manually.
You can further optimize your images by adding missing image alt texts and titles (if you haven’t already).
Alt text and titles give search engines a means of understanding what your image is about.
However, if you’ve got a ton of images on your site, it would take forever to go through each of these images manually to find missing alt text and titles.
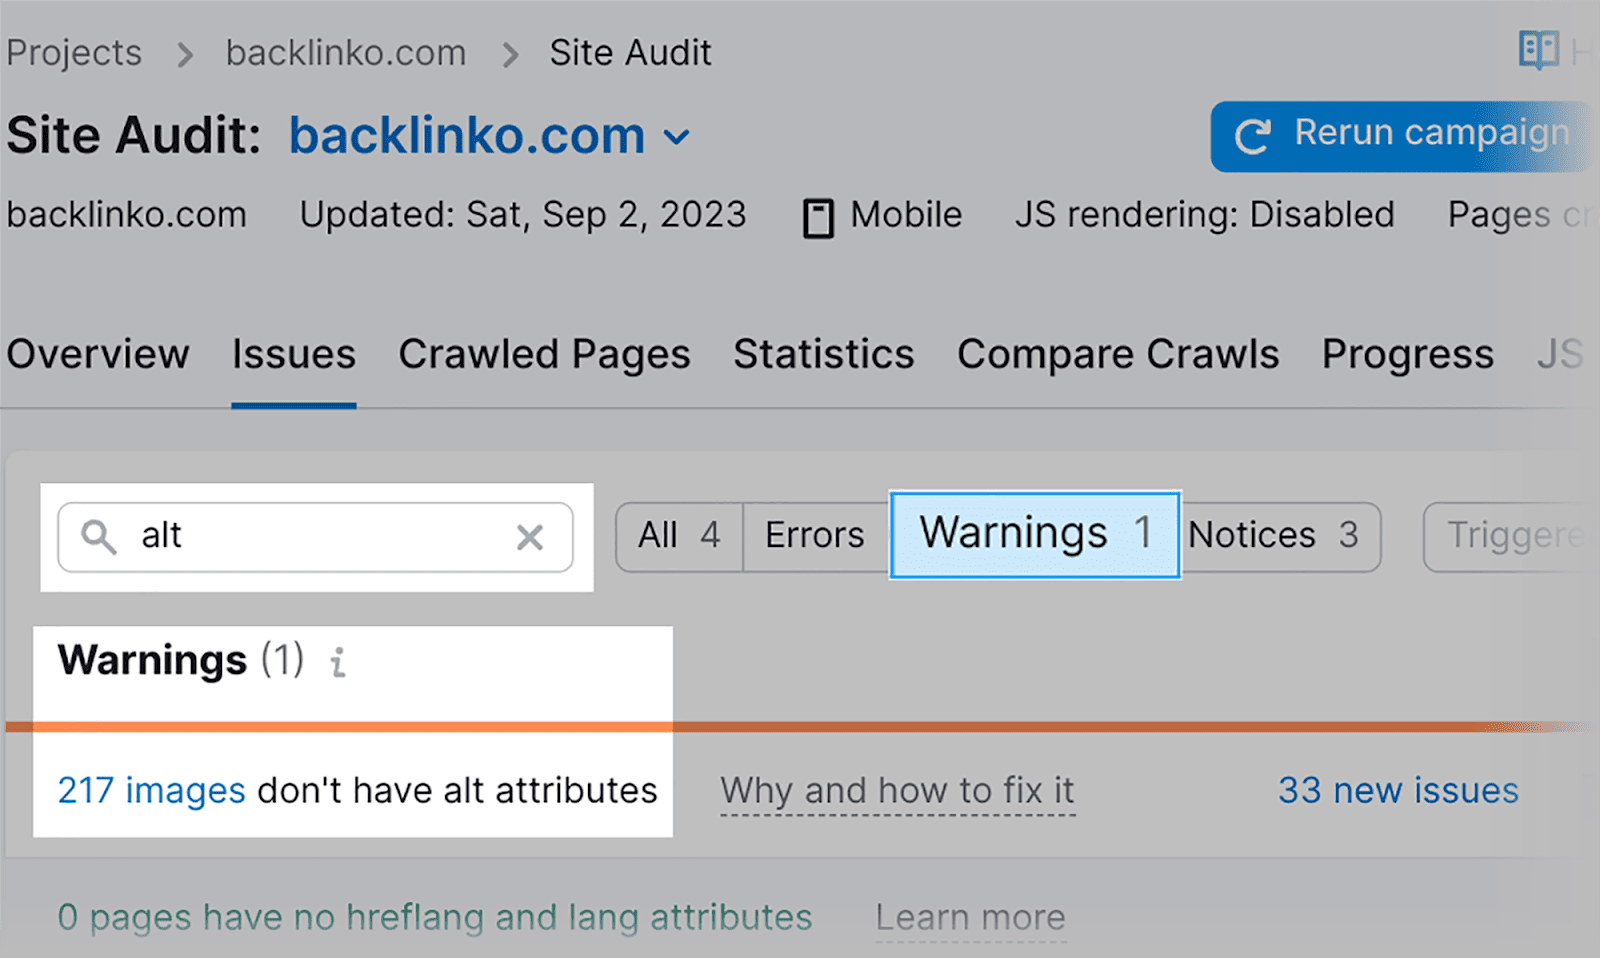
Don’t worry, though! Head to Semrush’s Site Audit tool and visit the “Warnings” section. In the search bar, type “alt”. Here, you will be able to review your missing alt attributes:
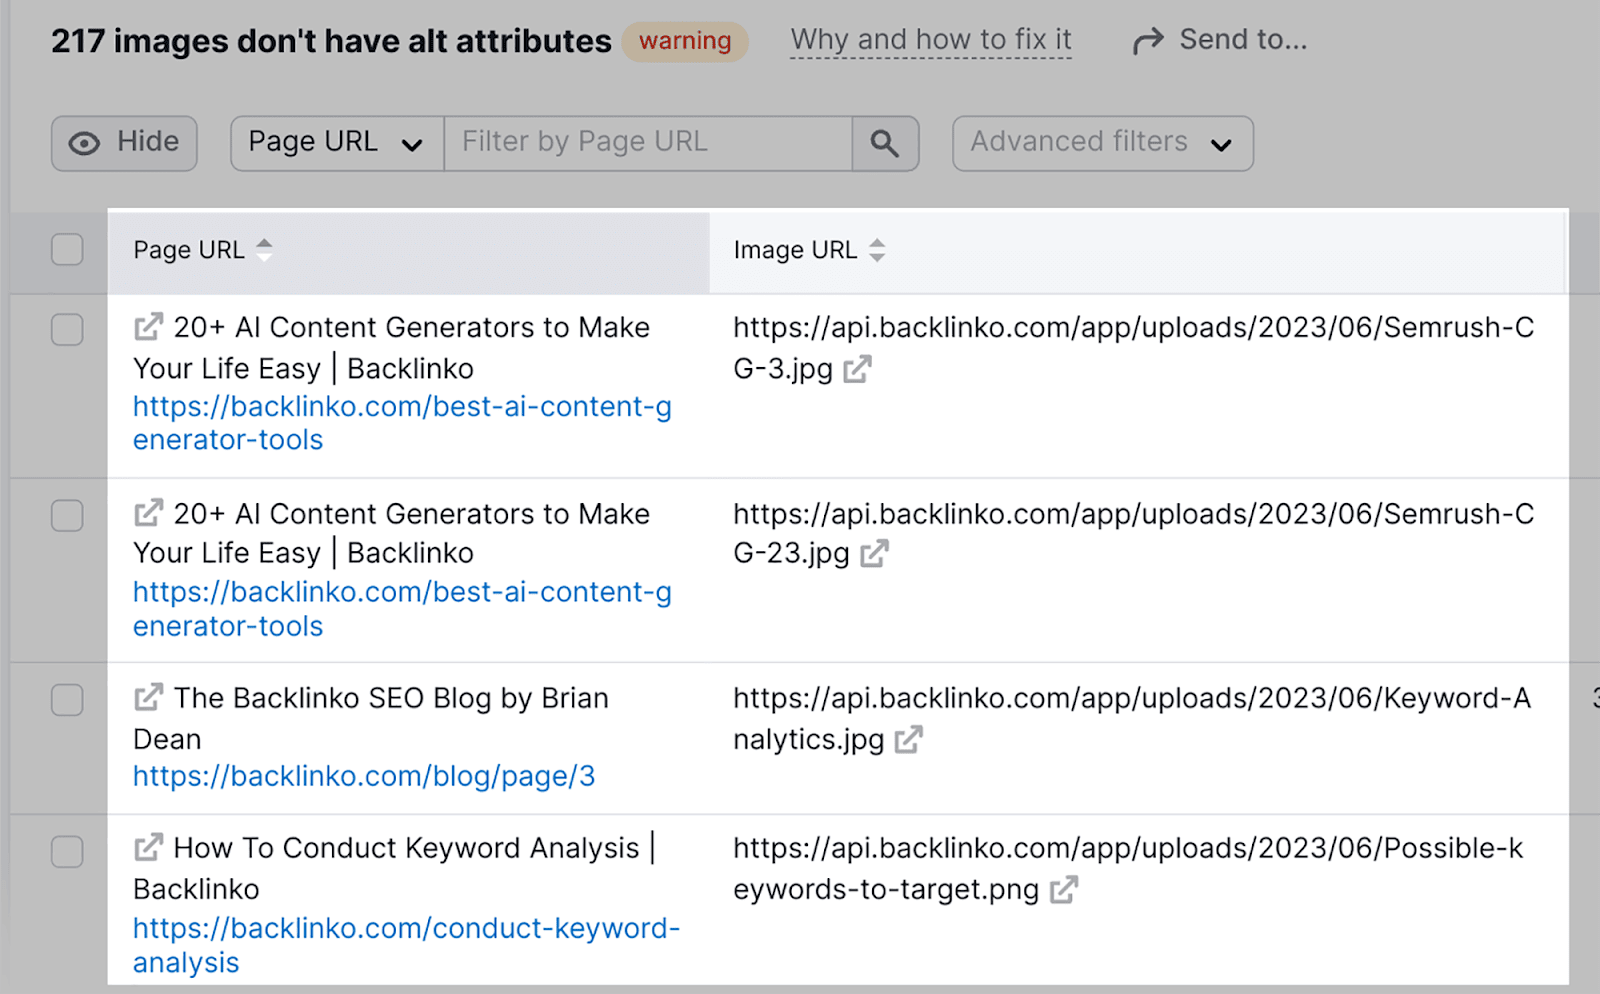
If I click on “217 images”, I can review a list of all the images on my domain that lack alt attributes:
16. Traffic monitoring
Keeping an eye on your traffic is an essential component of any SEO campaign. You should regularly carve time to analyze where your traffic is coming from.
With the help of Google Analytics 4, you can pinpoint whether your traffic is mostly organic, direct, or referral. This tool will also tell you what devices your visitors are using when they land on your site, for example, desktop, mobile, or tablet.
Here’s how you can access your traffic insights in GA4.
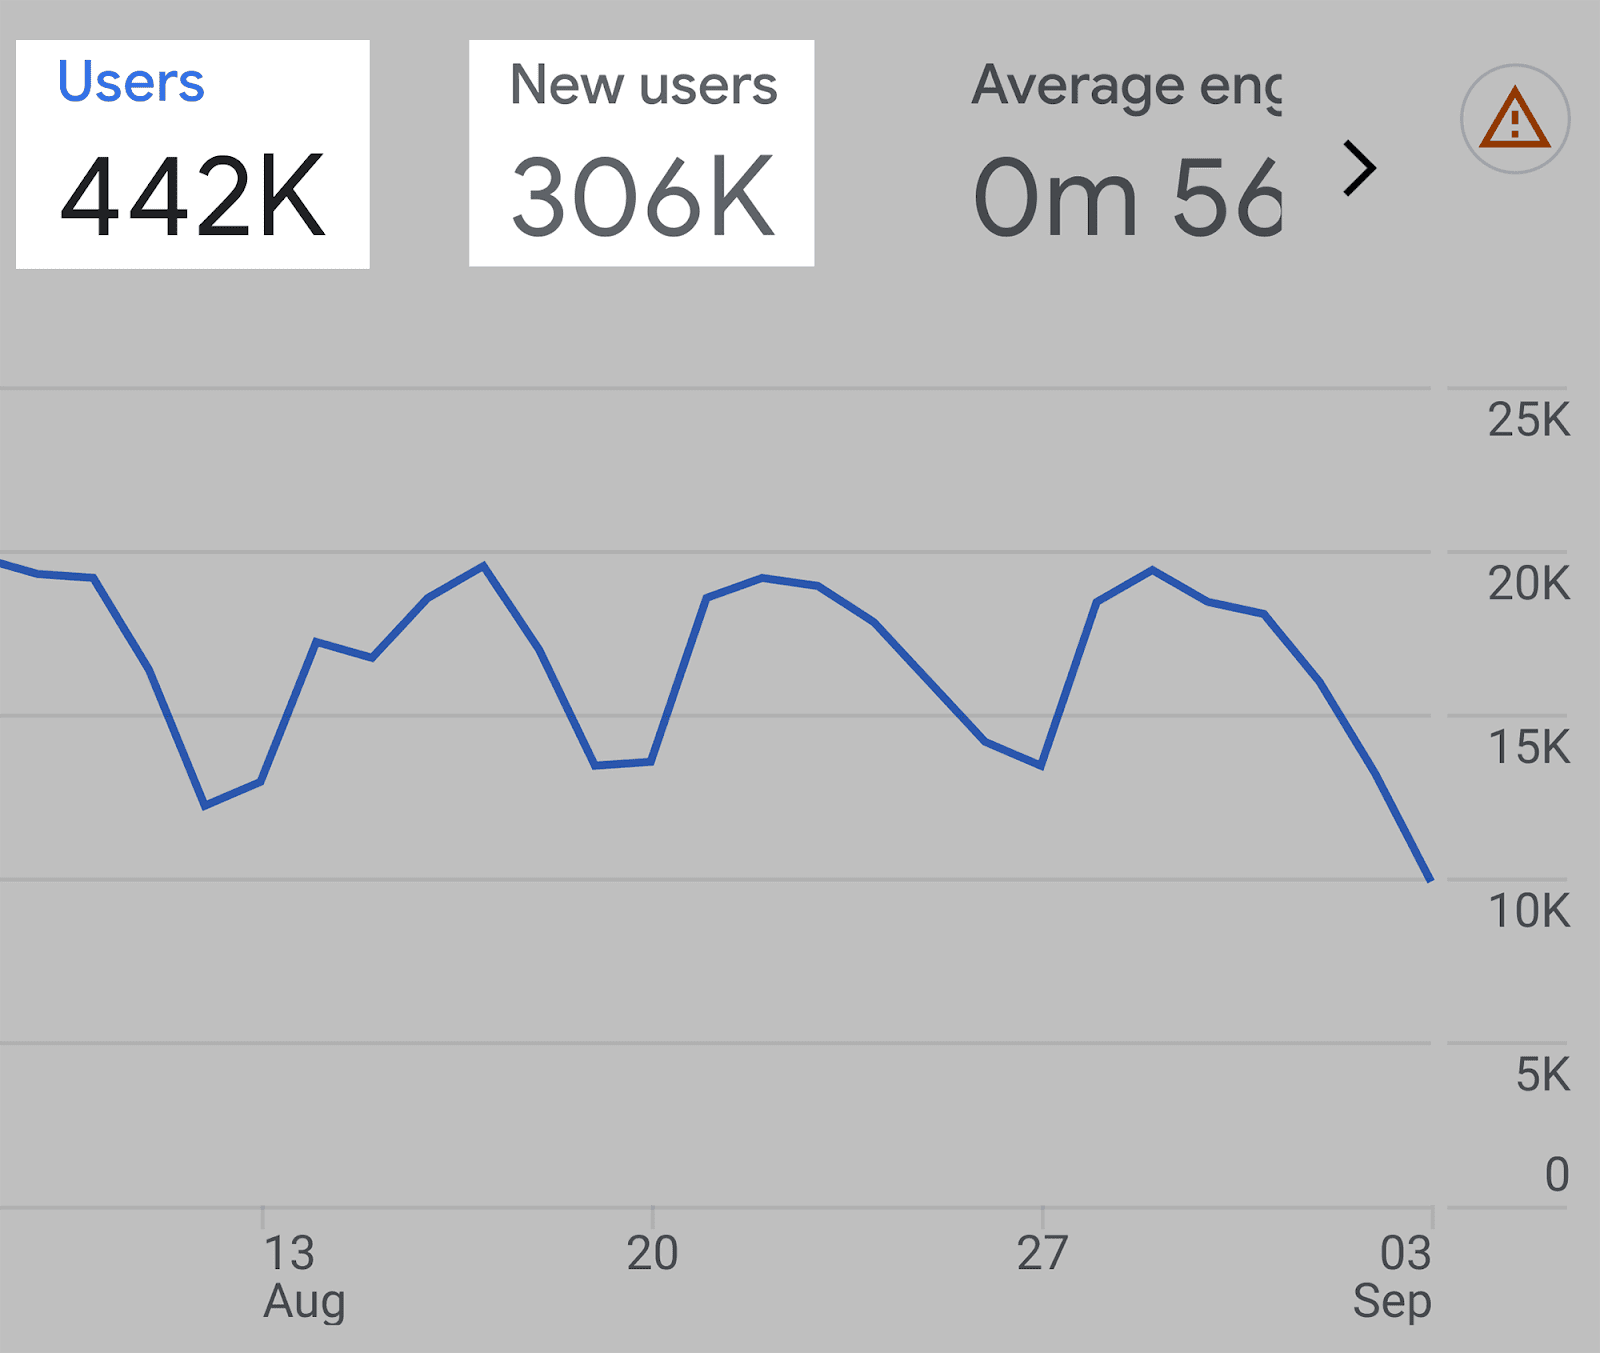
When you land on the Reports snapshot dashboard, you can instantly see your User count and the New users who have visited your site:
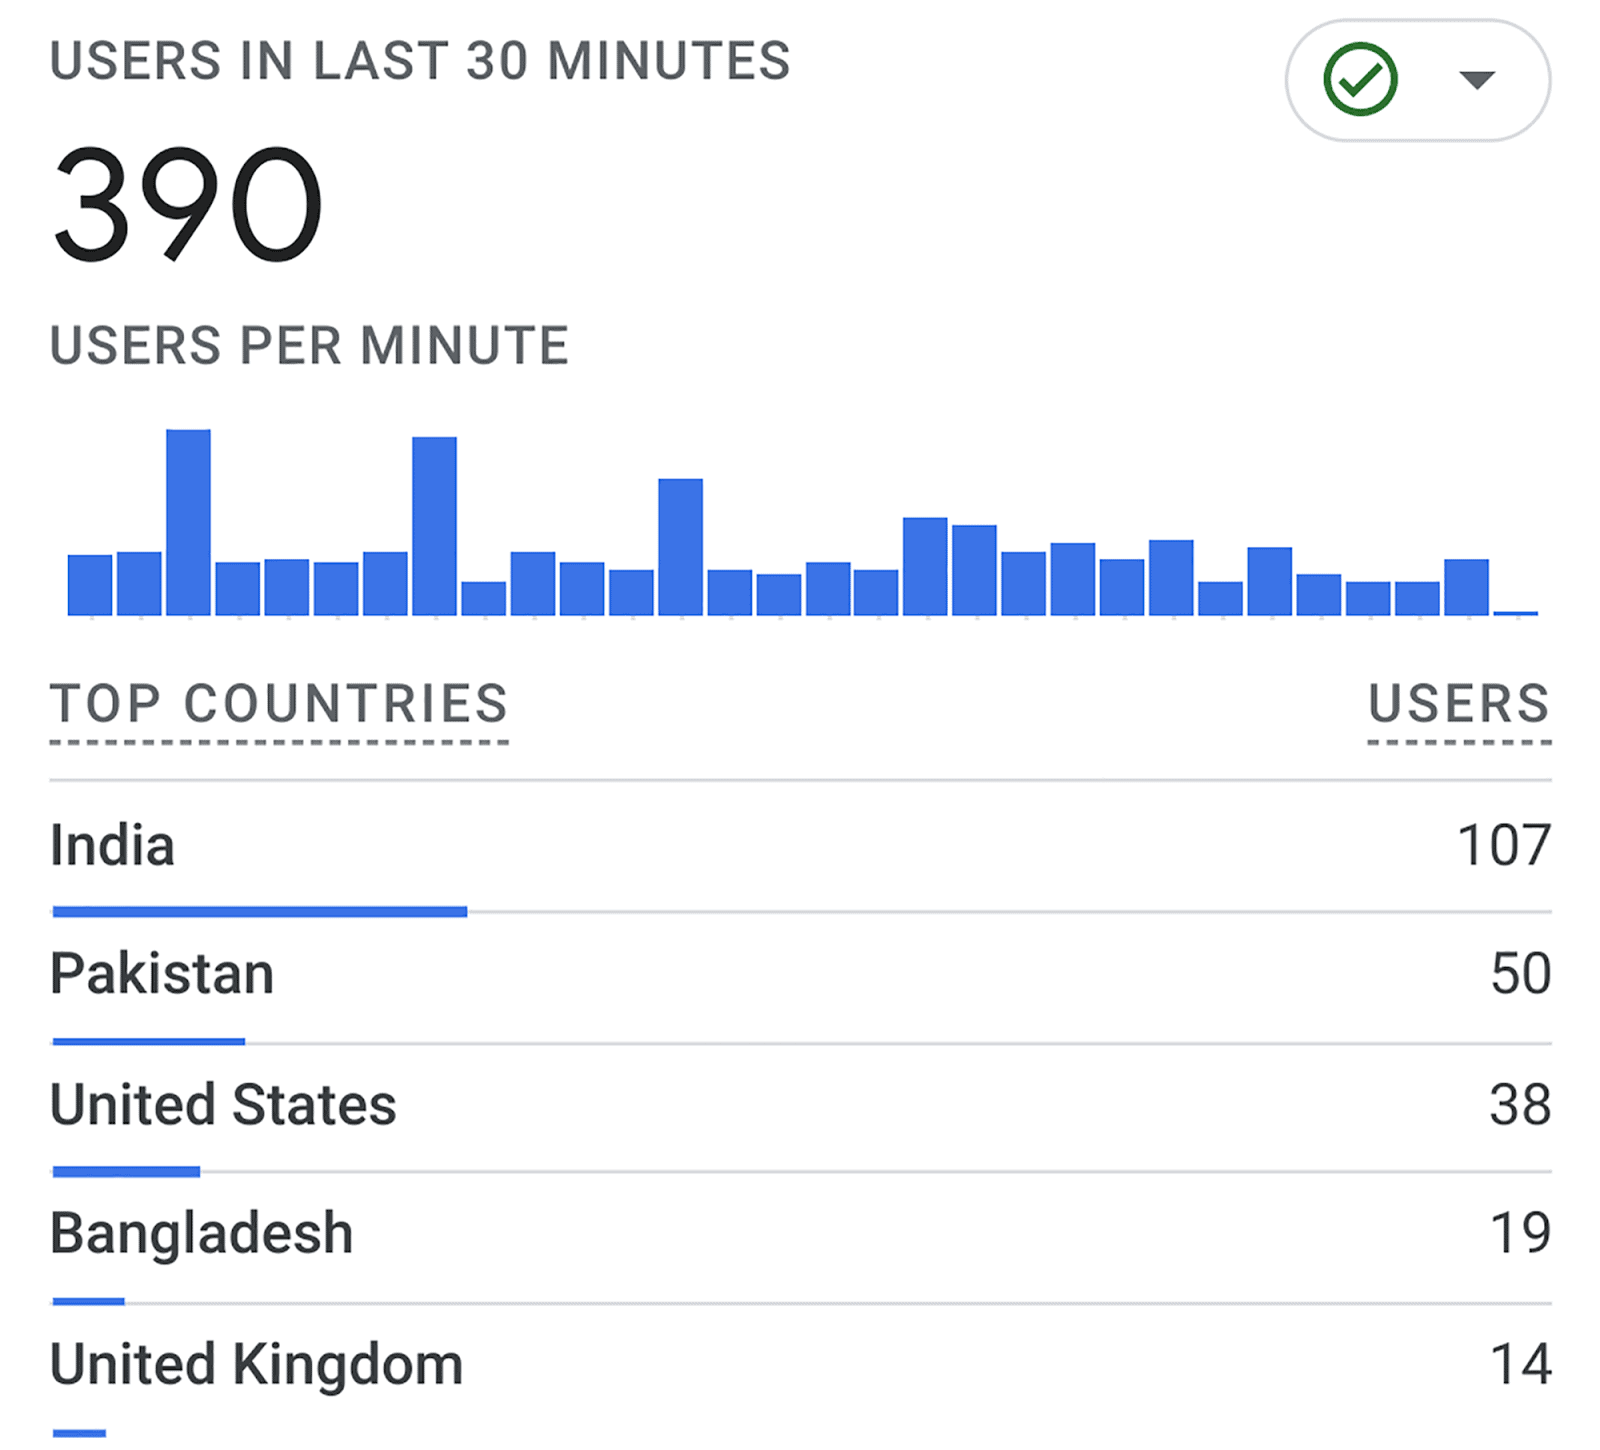
On the right-hand side, you can also review the total number of users that visited your site in the last 30 minutes and the countries that they visited from:
Next, click on “Traffic Acquisition” found under the Acquisition section in the menu on the left:
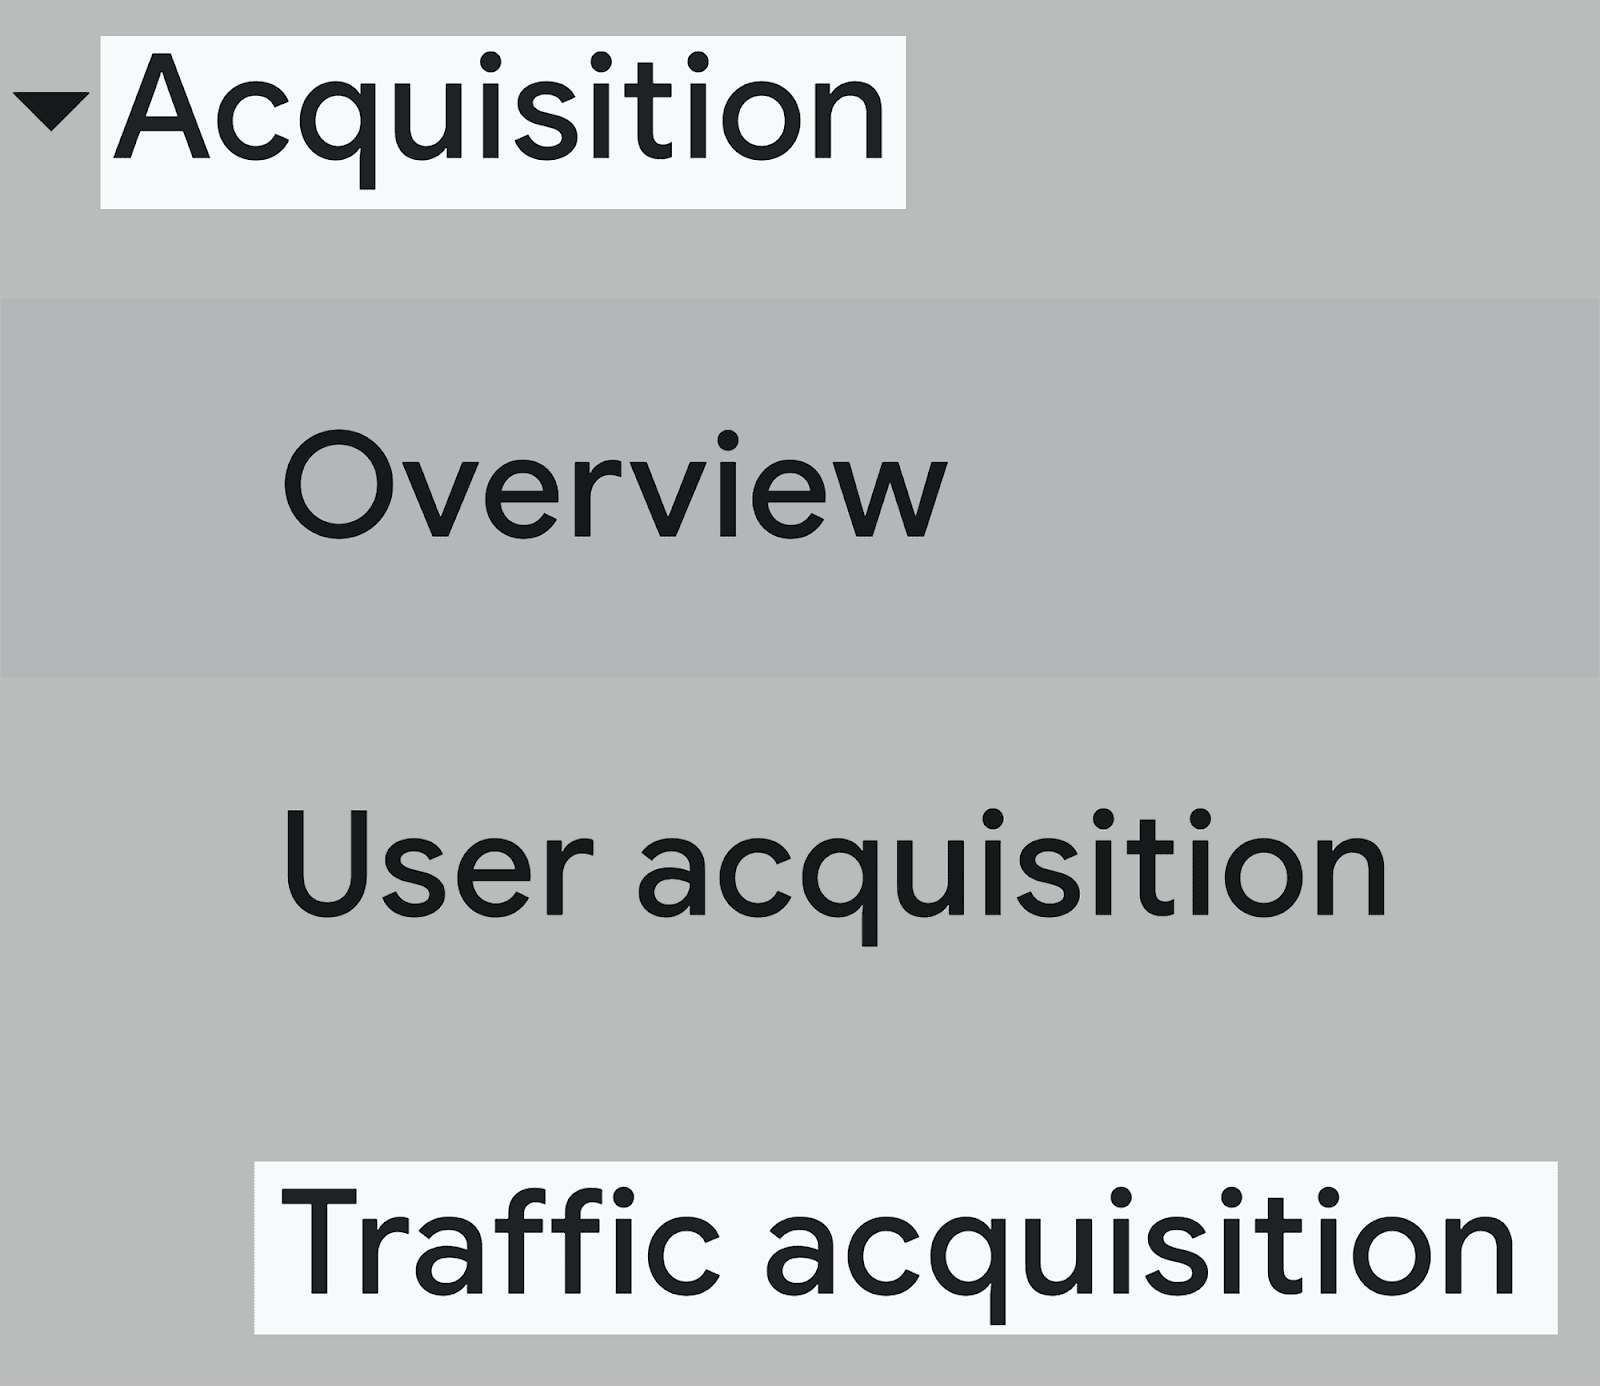
Here, you can view the sources of your traffic, meaning how users arrive at your site. These sources are defined as:
- Organic Search — Traffic that comes directly from Google, Bing, and other search engines.
- Direct — This refers to visitors who directly enter a website’s URL into their browser’s address bar, bypassing search engines and other referral sources.
- Referral — Referral traffic is when visitors come to your website from another site by clicking on a link
- Organic Social — Any traffic that lands on your site via links shared on social media is counted as “organic social” traffic.
- Email — Whenever a user lands on your website by clicking on a link embedded in an email. This gets recorded as Email traffic.
- Organic Video — This relates to traffic pulled in from platforms such as YouTube and TikTok.
- Unassigned — If tracking parameters are missing, or some other tracking error occurs, traffic will be recorded as “unassigned”.
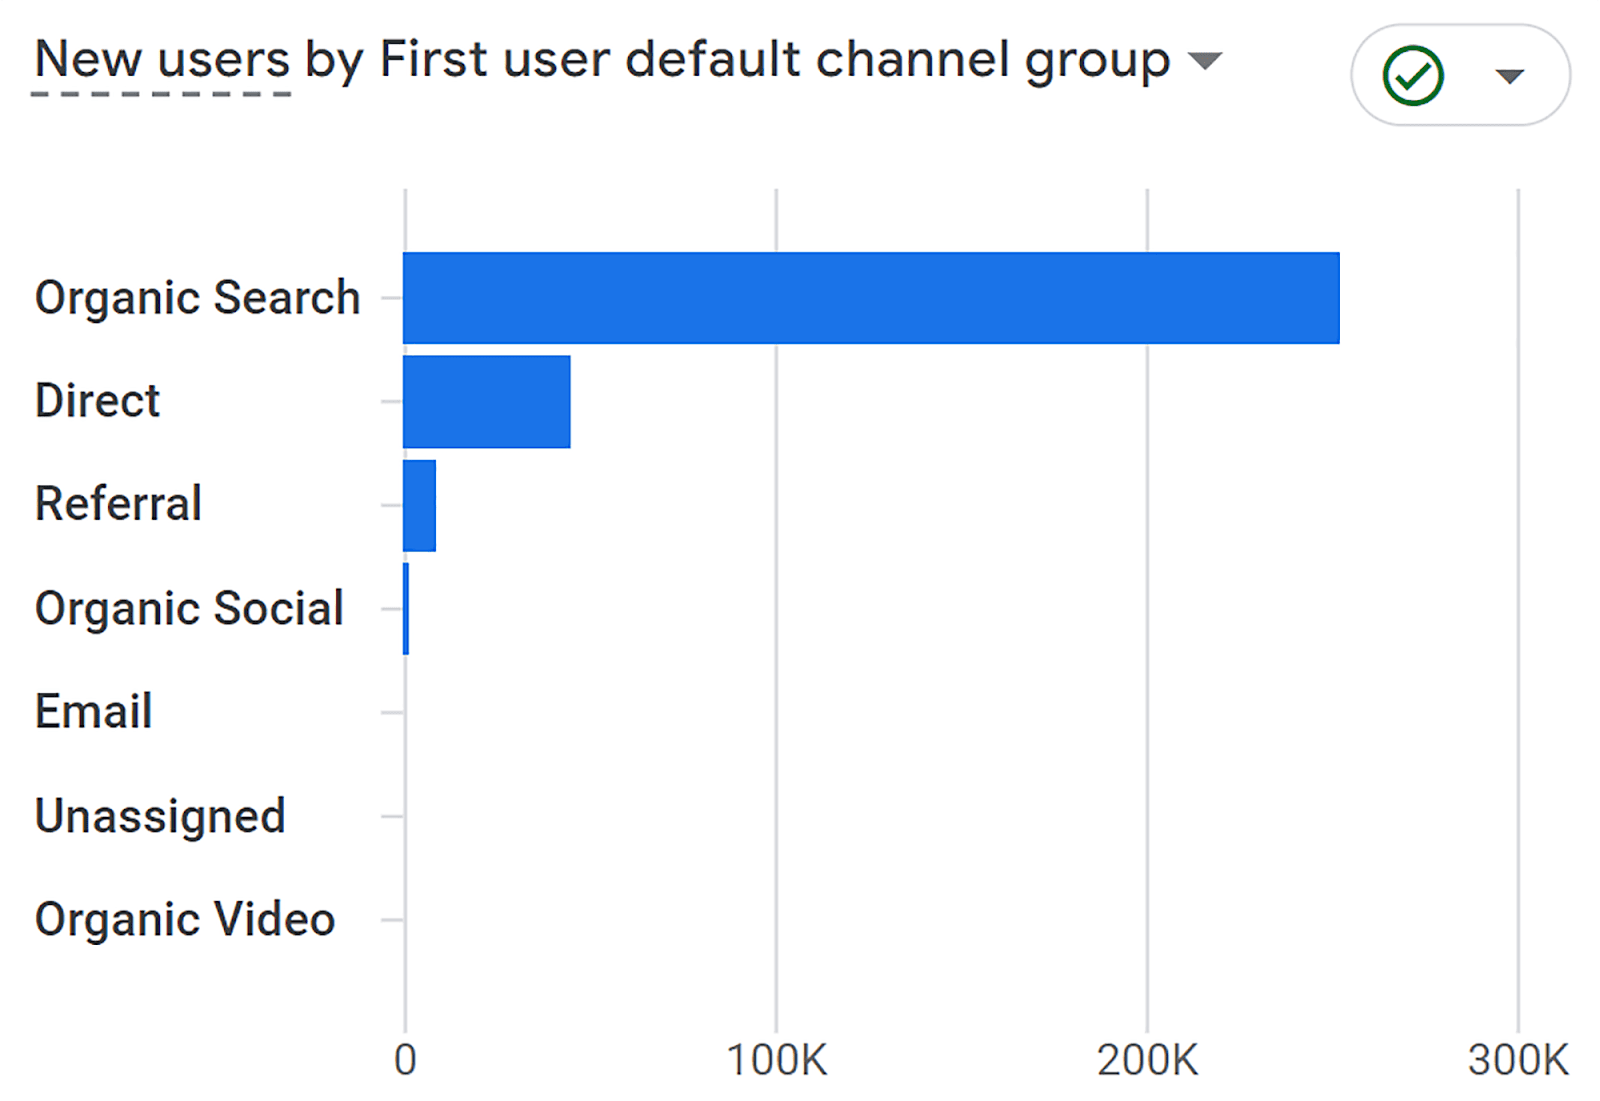
If you scroll down, you’ll get detailed metrics such as:
- The number of “Users” who landed on your site via each channel.
- The total number of “Sessions” generated from each channel
and more.
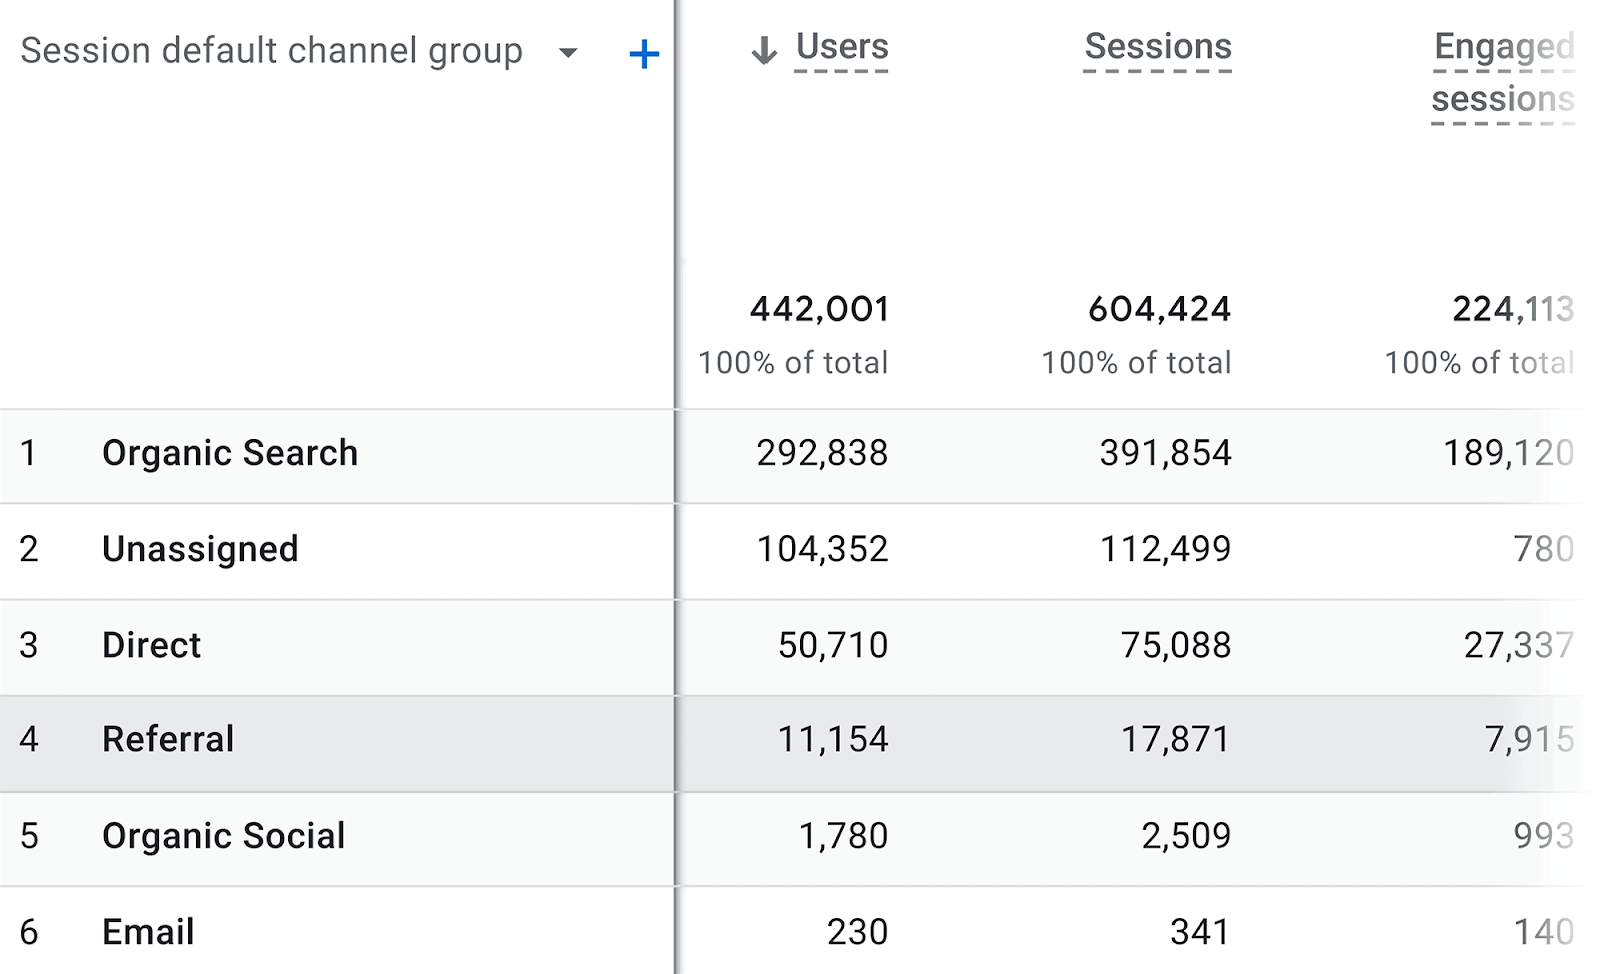
For example, I can see that out of the 442,001 users who came to my site, 292,838 did so via organic search.
To see the devices your visitors use to access your site, simply click on the “+” button at the top:

Then, click “Platform/device” on the left, and “Device category” on the right:
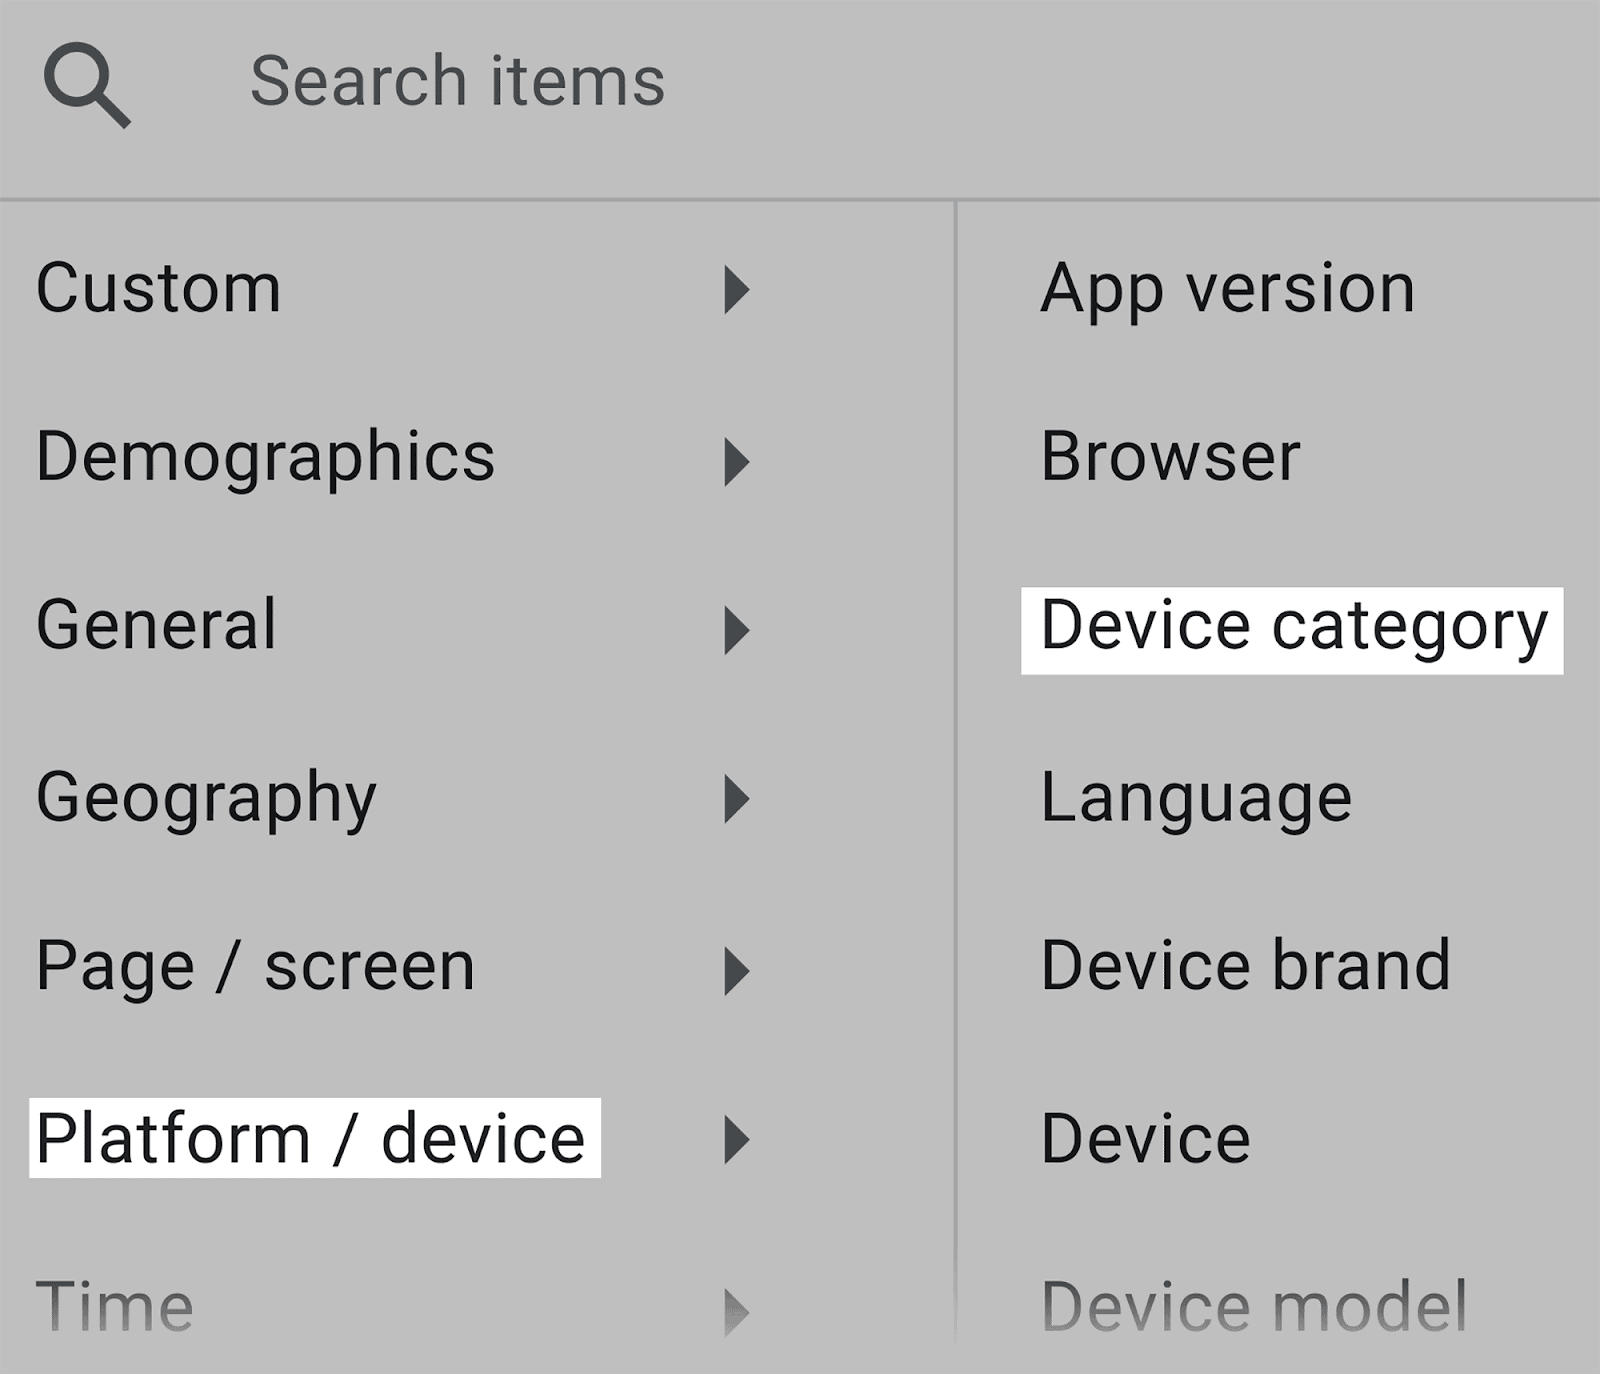
This will then add a “Device category” column to your traffic acquisition table:
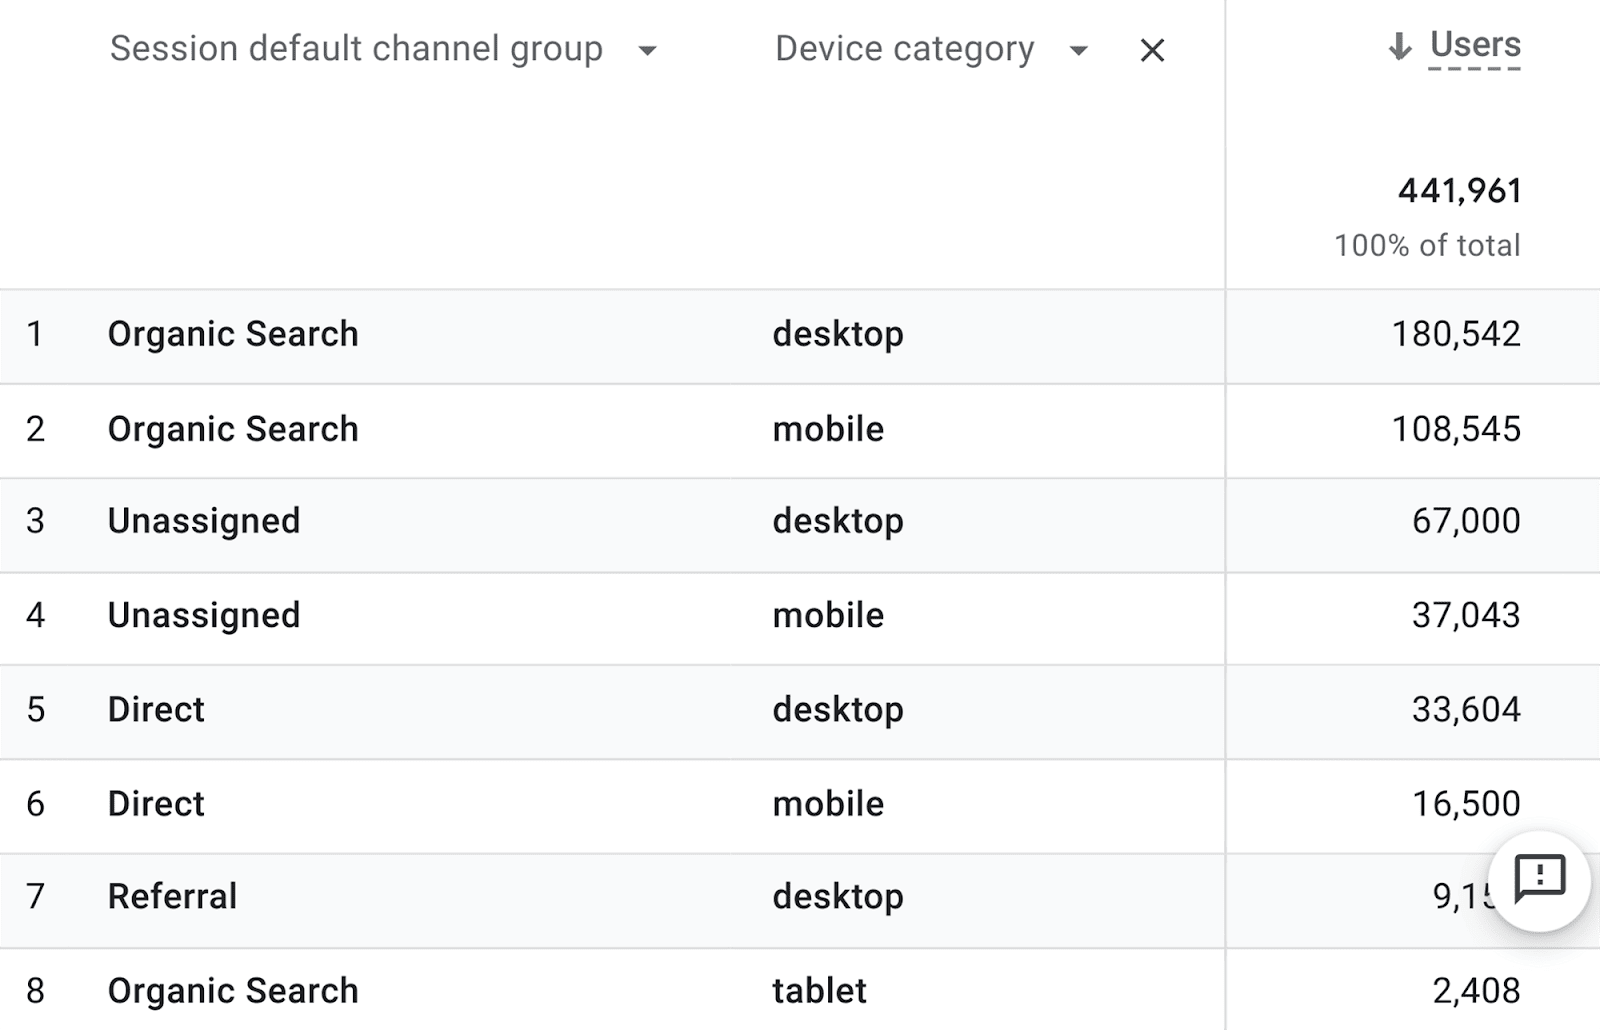
Here, you’ll be able to cross-reference the number of users that visited your site via a specific channel while using a particular device.
For example, in row 1, I can see that 180,542 users visited my site via desktop through organic search.
Having access to these insights will enable you to optimize your website for the primary traffic source that brings in the majority of your visitors, as well as tailor your site for the devices most commonly used by your visitors to access it.
We’ll get to automated reporting properly in the next section, but it’s worth mentioning here that reports can be automated easily on the GA4 platform.
Simply click on the share button of whatever report you’re on and you’ll be given the option to share the link or download it:
While GA4 is a valuable tool, it has limitations, and one of those limitations is the inability to compare your own traffic sources with those of your competitors.
You can, however, perform this task using Semrush’s Traffic Analytics.
You can find “Traffic Analytics” under the Competitive Research section in the menu on the left:
After you click on it, add your domain followed by a list of your competitors and hit “Analyze”
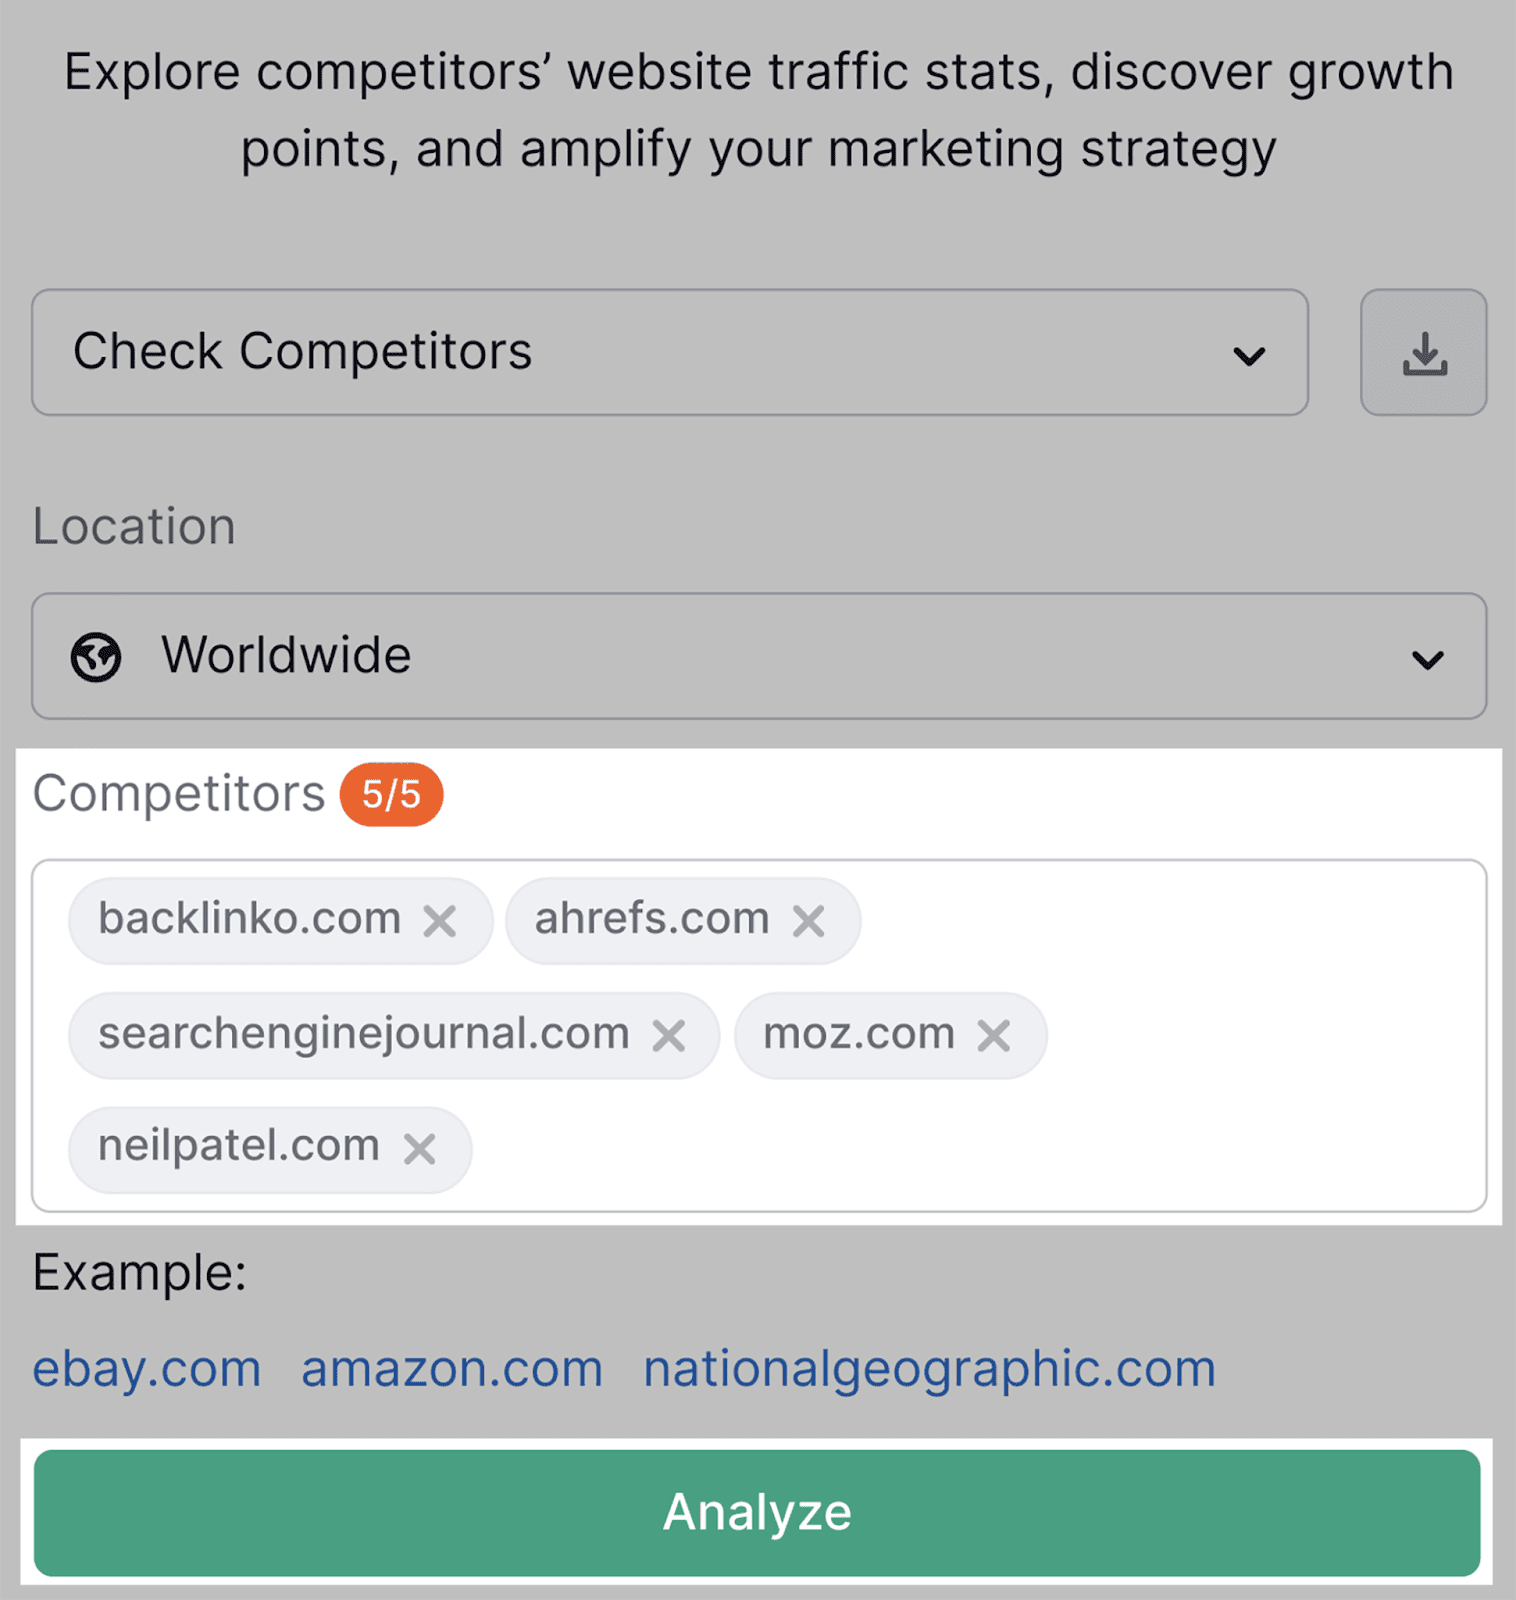
Next, click on the “Traffic Journey” tab, where you can compare the source of your traffic to that of your competitors:
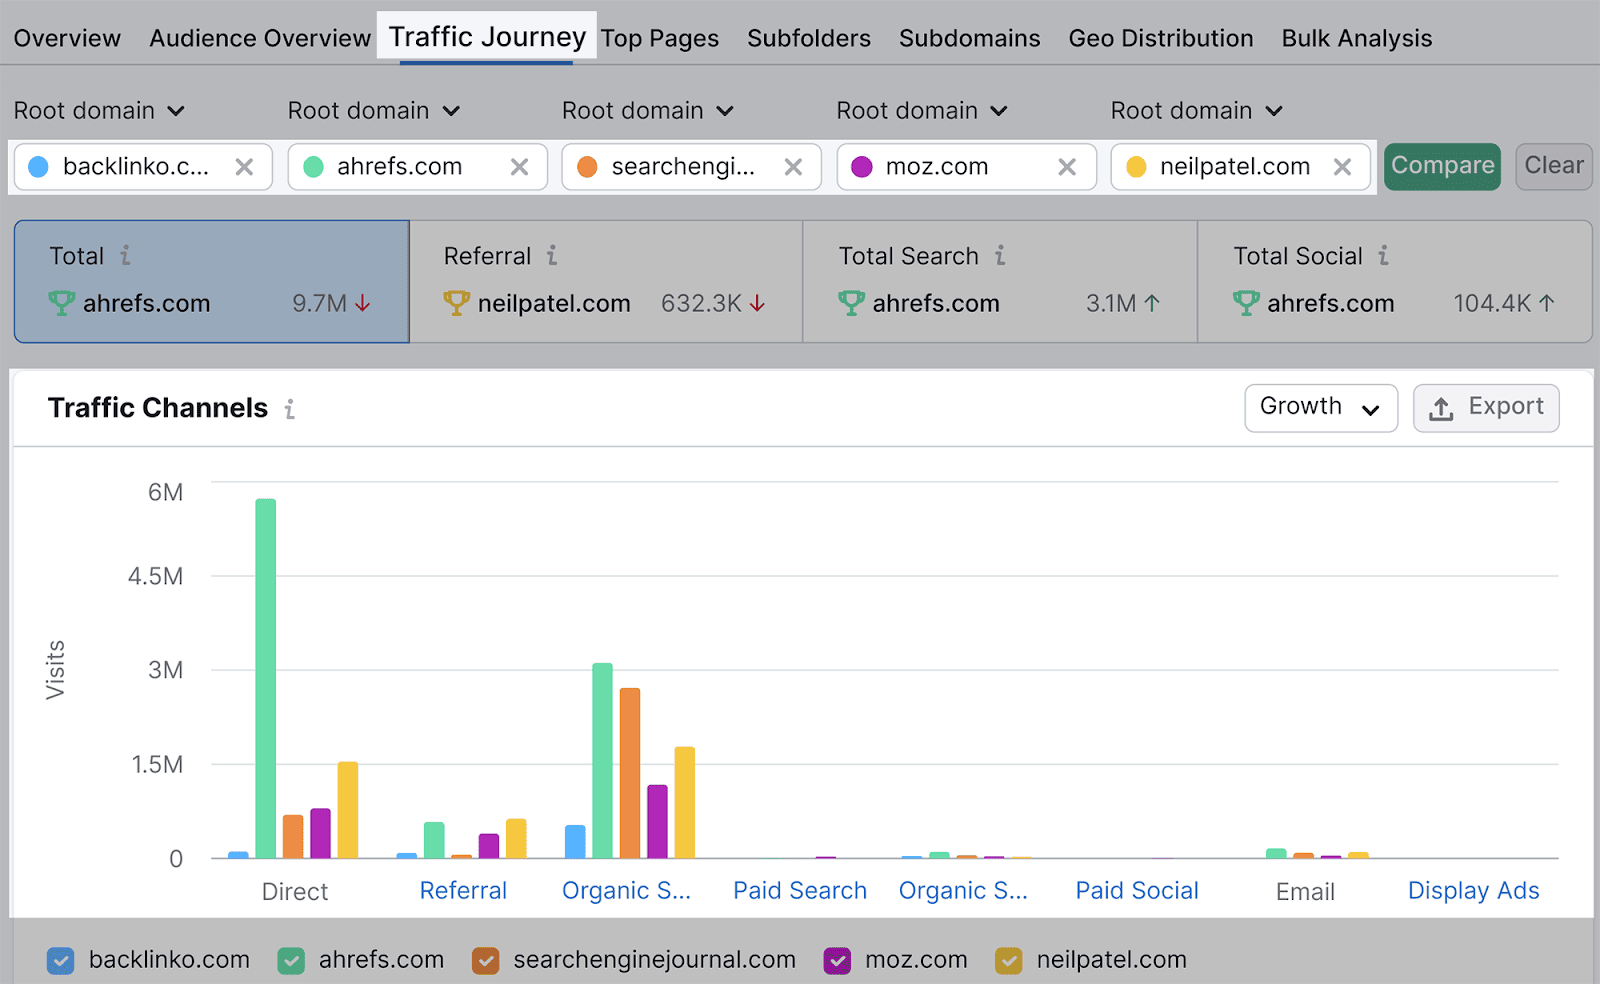
As you can see, Ahrefs receives a substantial amount of direct traffic compared to any of the other sites.
To automate this comparative process in the future, you can save the list you’ve entered by clicking the “+ Create list” button at the top right:
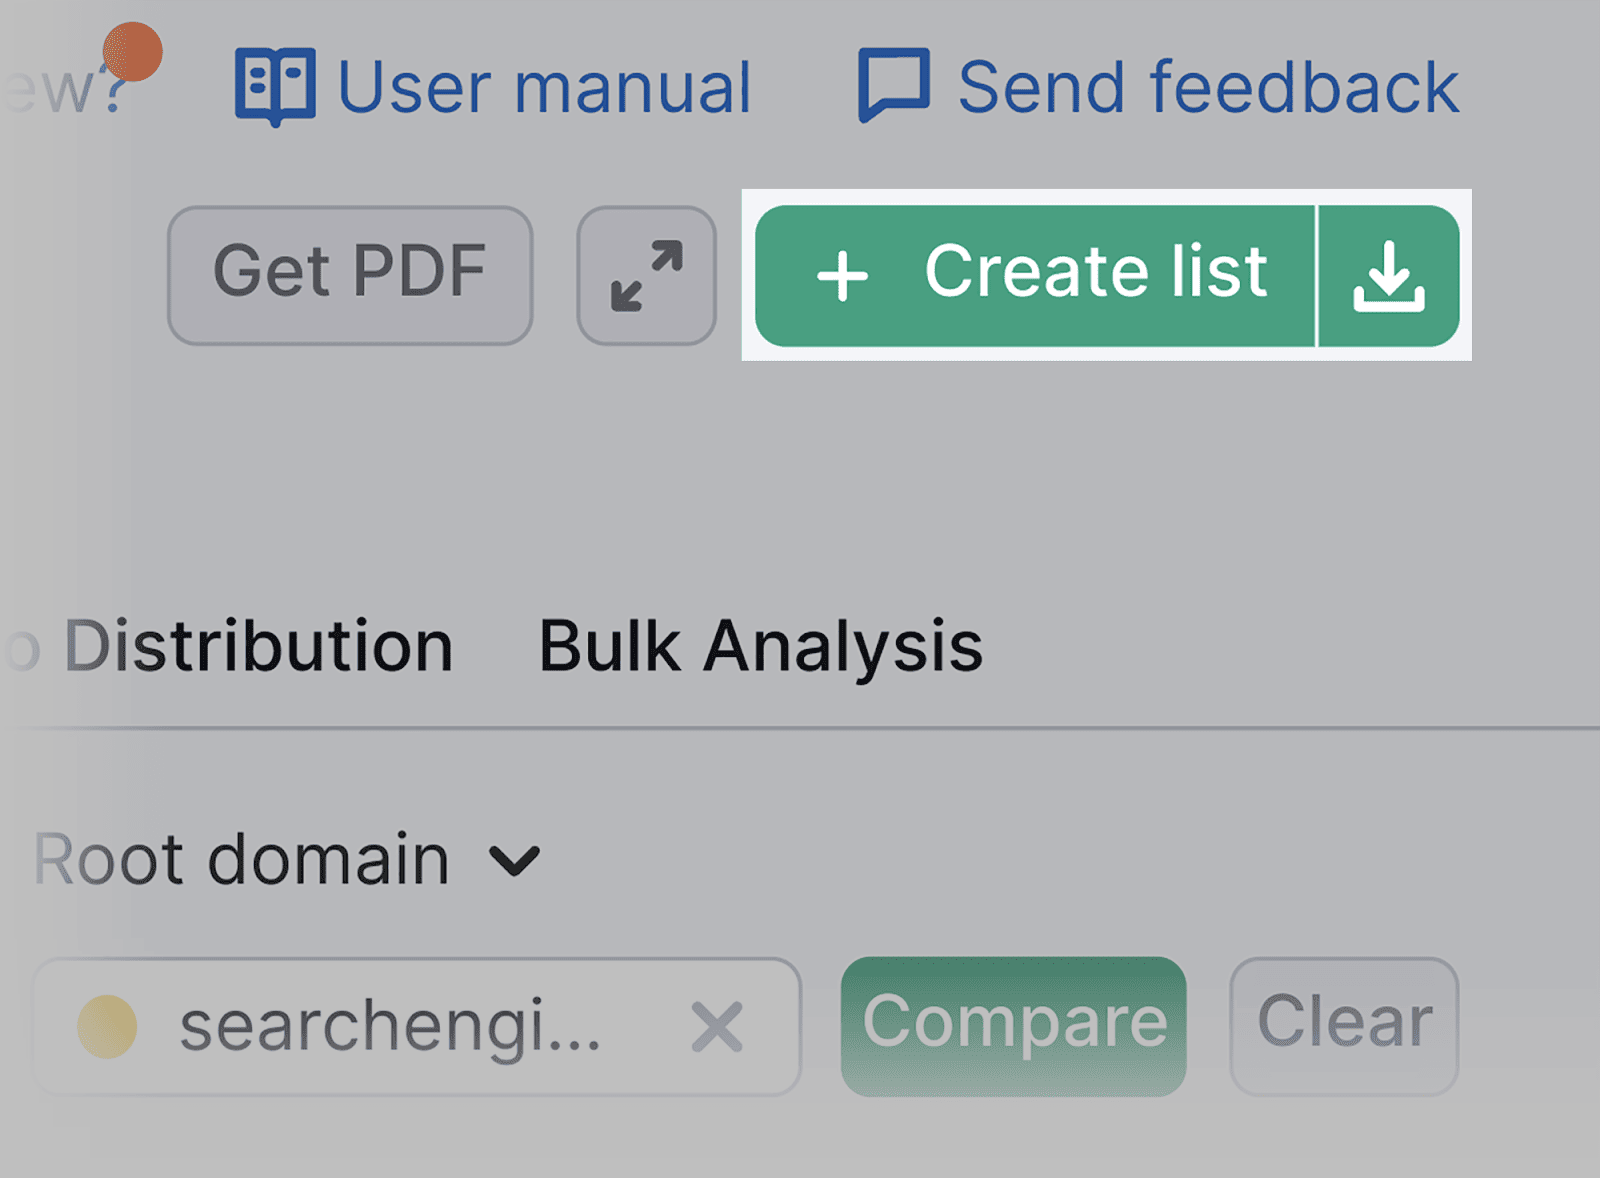
…Semrush will keep updating it with new information — automatically!
Another useful tab in the Traffic Analytics tool is the Top Pages report. Here, you can review your competitors’ pages and their traffic sources.
In this example, I’ll use Amazon as a competitor to demonstrate how to utilize the tool.
Click on the “Top Pages” tab:
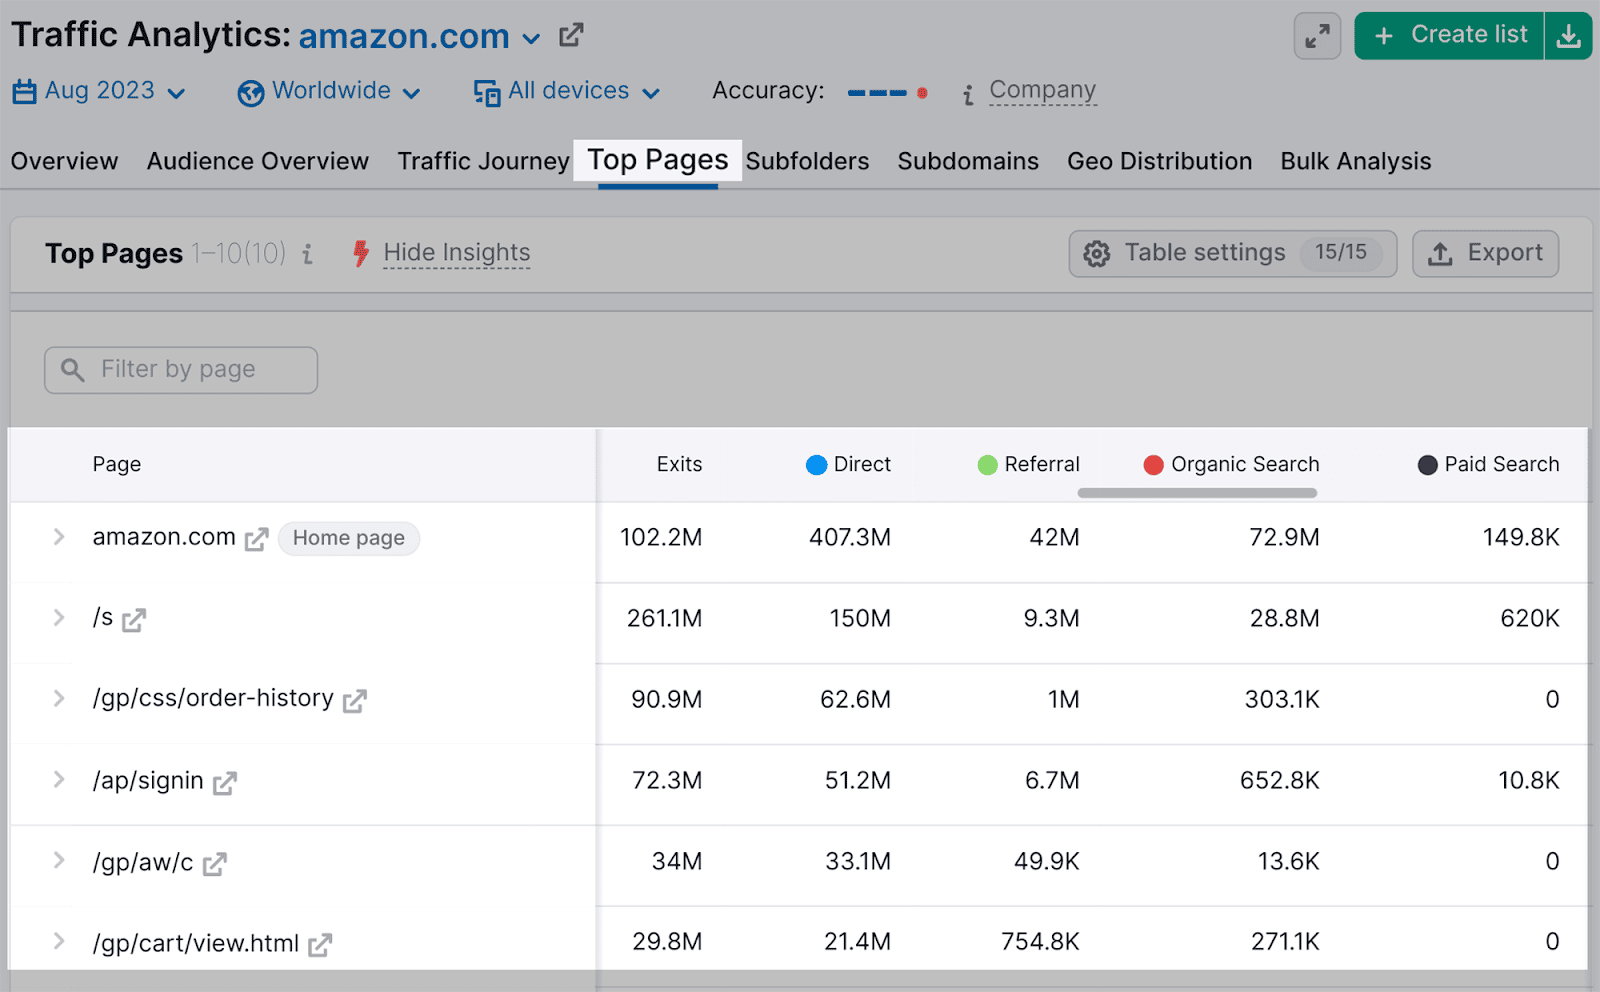
Here, you’ll be able to get insights into your competitor’s top pages and the amount of traffic they receive from the specific channels.
17. Automated reporting
On top of analyzing your SEO performance regularly, you likely have to compile comprehensible reports to convey your findings to colleagues and associates.
If you’re presenting an SEO report to stakeholders, you need all the relevant data, graphs, and charts to be up-to-****, clear, and concise.
Creating reports no longer has to be done manually.
Within Semrush, there are several ways in which you can create reports.
For example, if you want to share the findings from your site audit using Semrush’s Site Audit tool, you can click on the “PDF” button at the top right:

A small window will pop up, where you can select an email destination for the report:
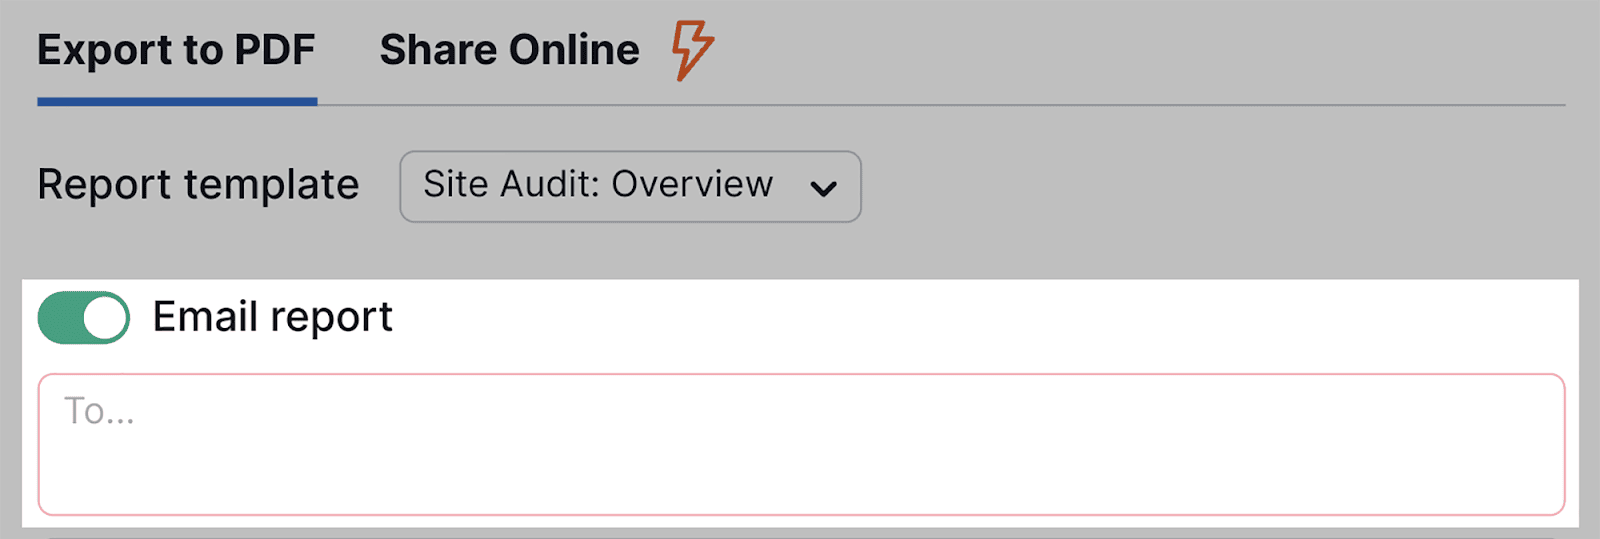
At the bottom of this window, you have the option to automate this report either on a daily, weekly, or monthly basis.
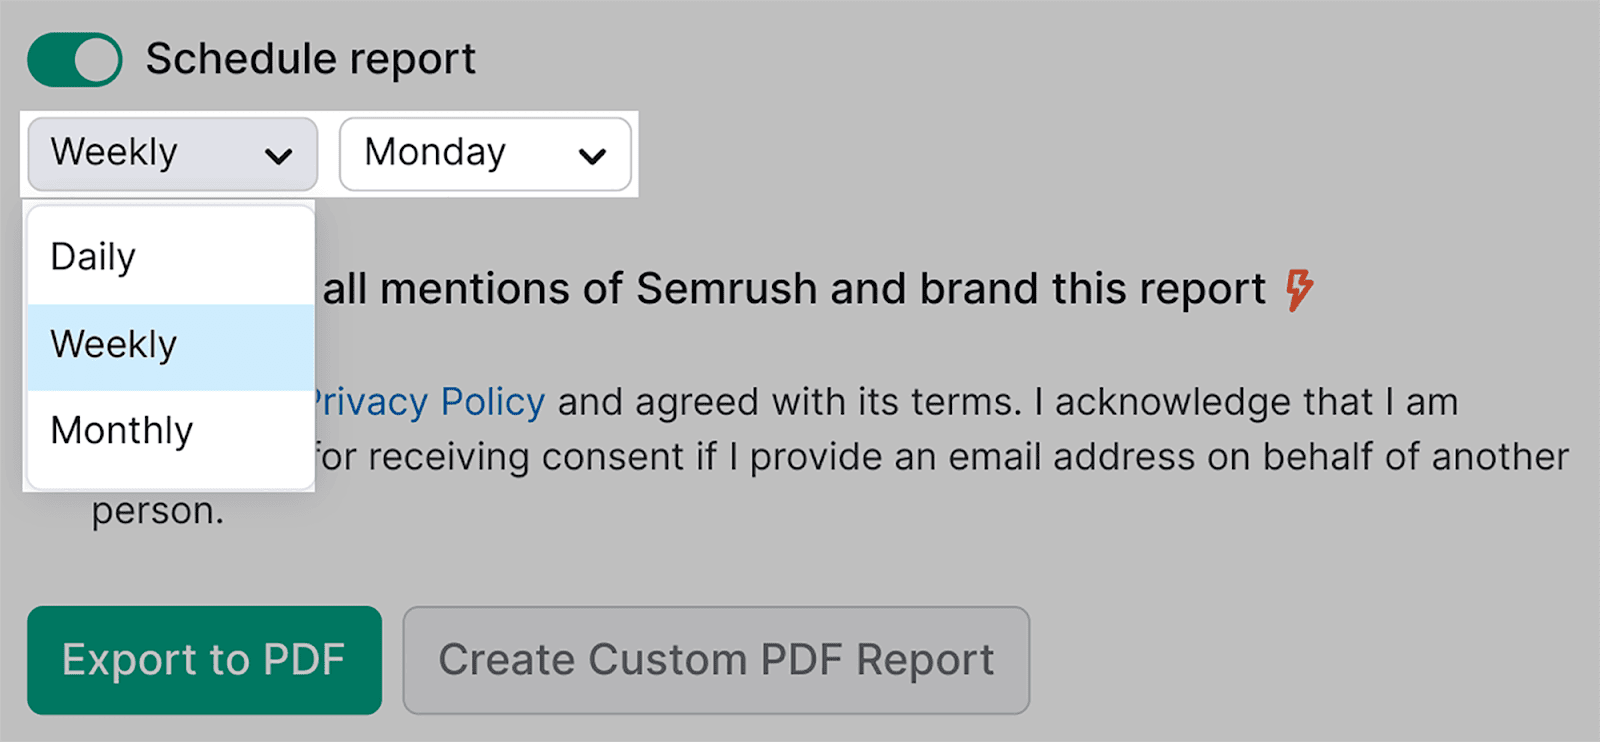
Once selected and exported the first time, you’ll be sent new reports based on which option you choose – automatically!
Alternatively, you can head down to the “My Reports” section, which you’ll find under the Optimization & Automation section:
Scroll down and click on the “Get Started with My Reports” button…
…and you’ll see all the options you have for creating a new PDF report:
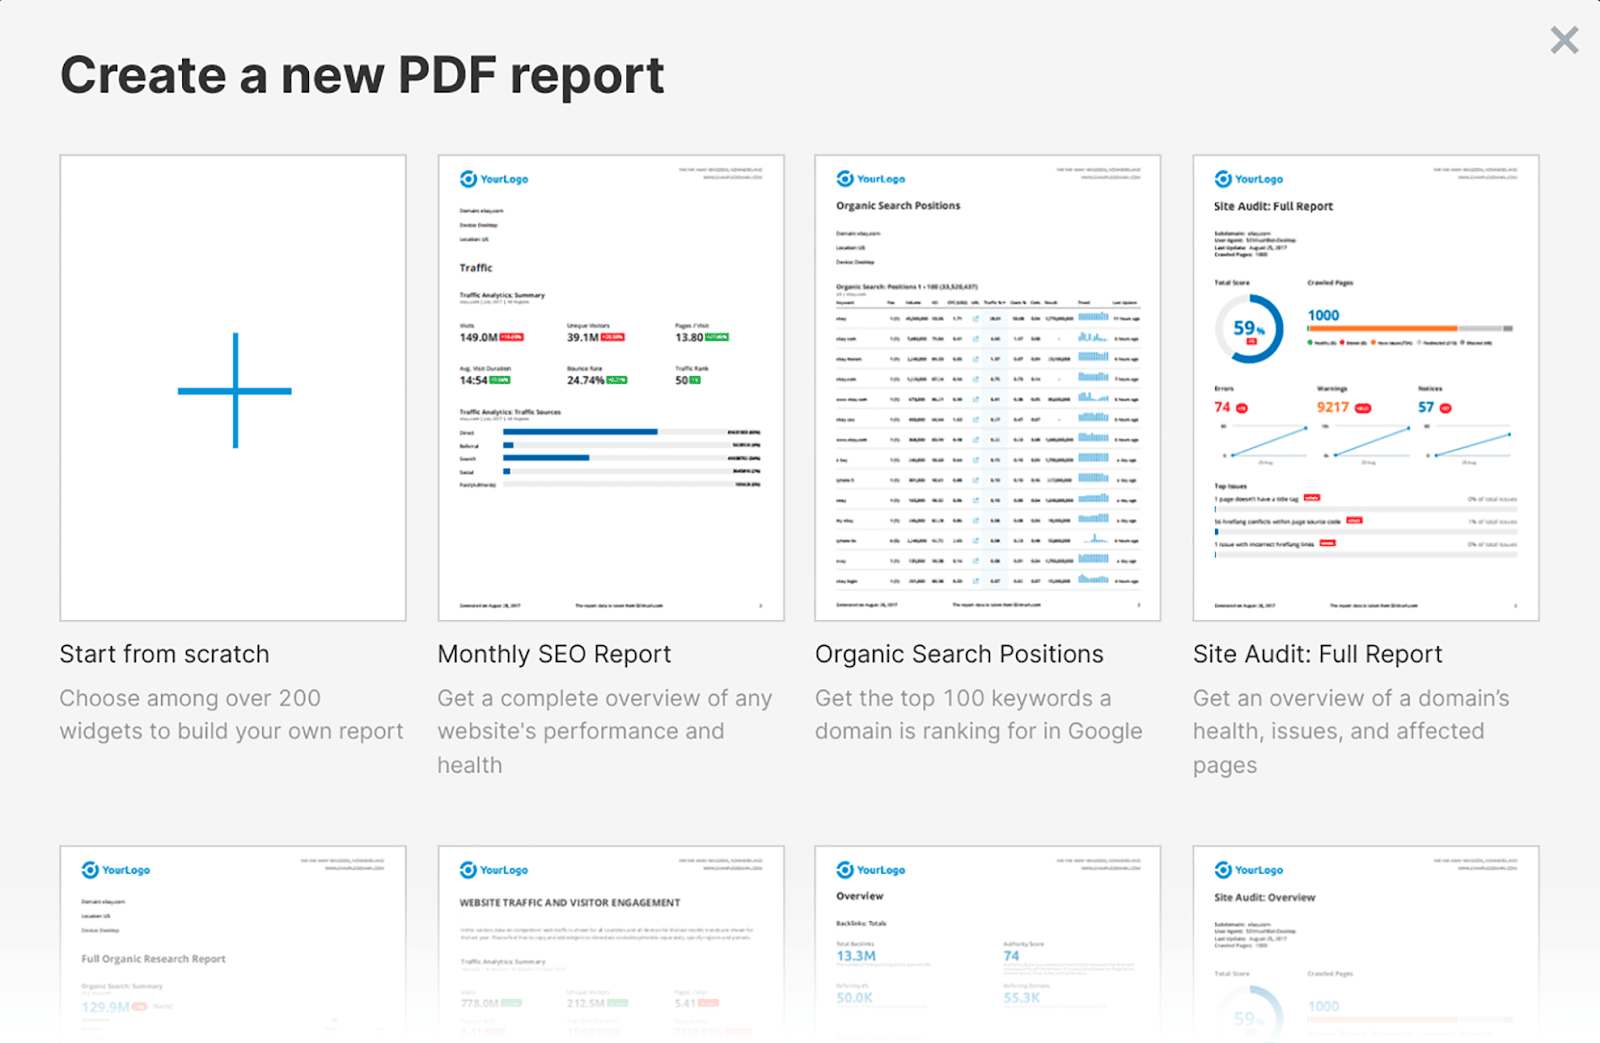
Your full list of options is as follows:
- Start from scratch
- Monthly SEO Report
- Organic Search Positions
- Site Audit Full Report
- Full Organic Research
- Monthly Competitor Analysis
- Backlinks: Full Report
- Site Audit Overview
- Full Advertising Research
- Google Business Profile Insights
- Google Ads Report
- Domain Comparison
- Site Audit: Issues
If you click on “Organic Search Positions”, for example, a window will pop up. In this window, you will need to fill in your domain name and choose a database:
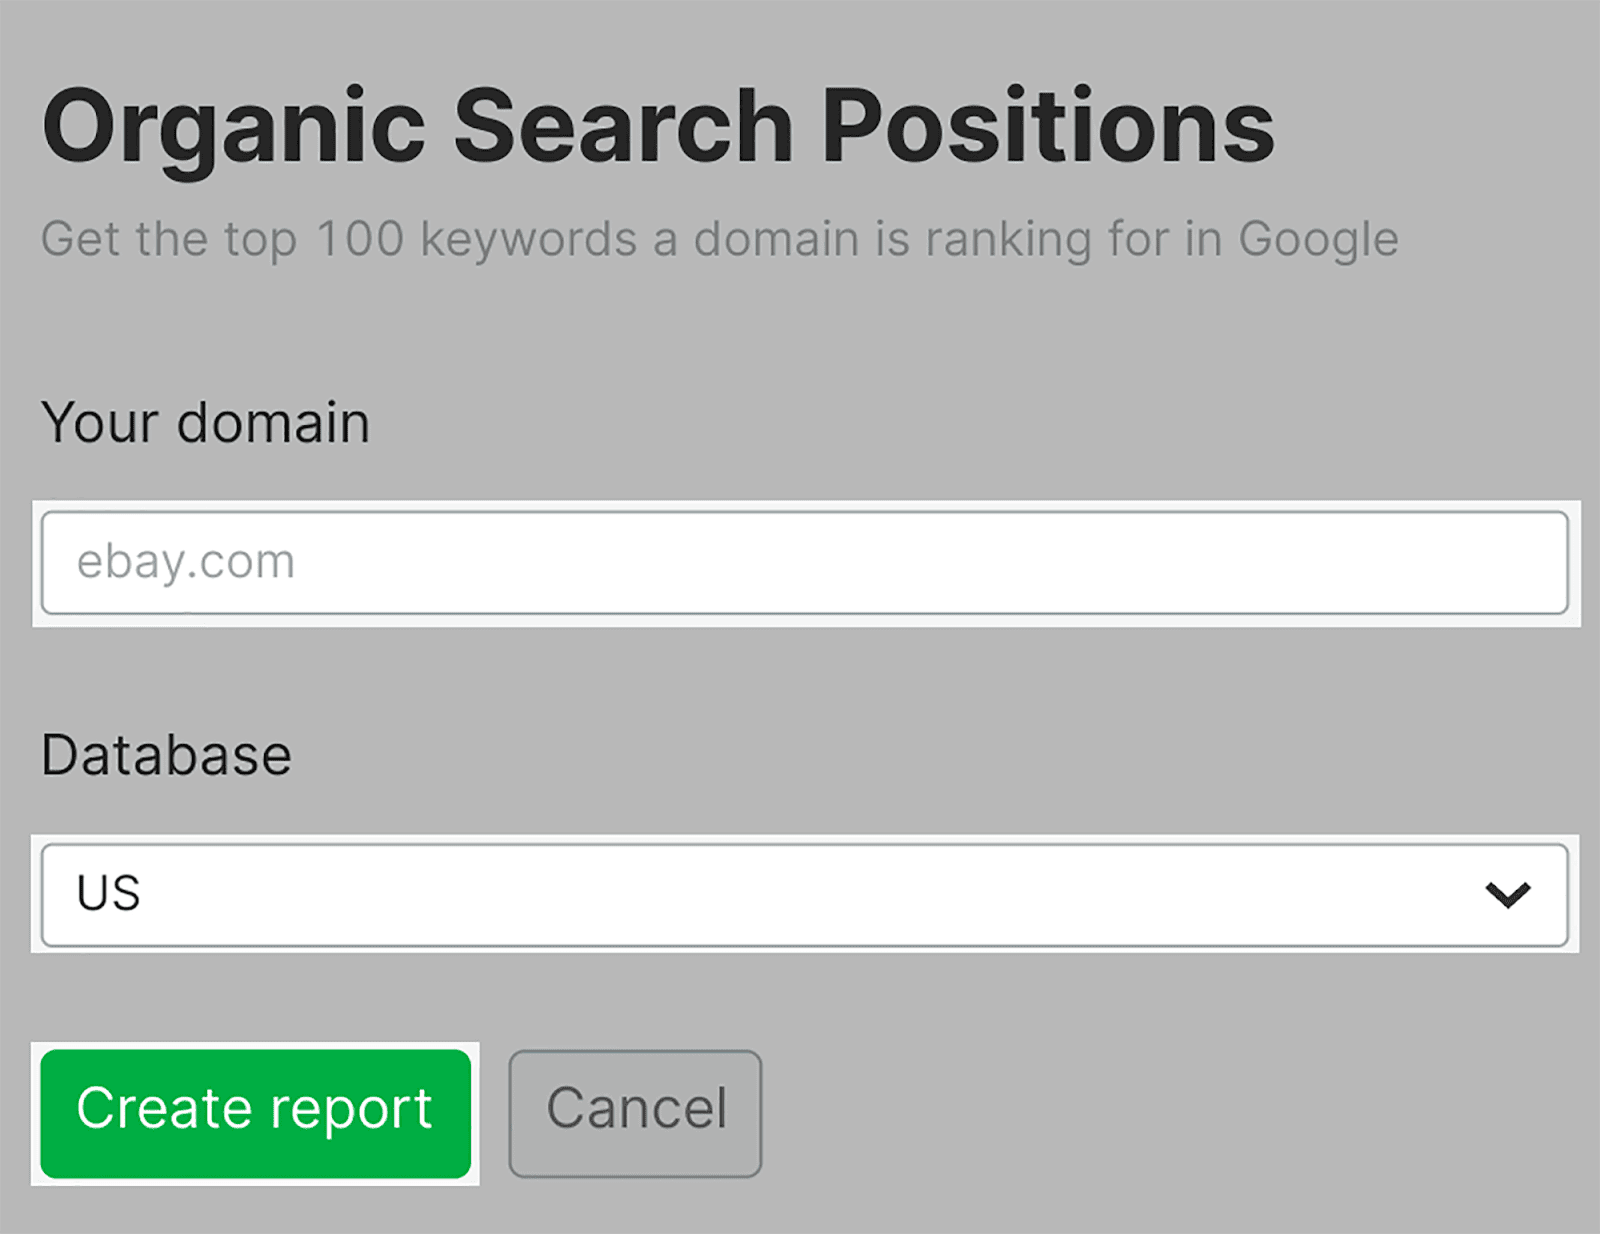
Then, click “Create report”.
Once created, click on “Generate PDF report” in the top right-hand corner…

…and a window will pop up that’ll give you the option to schedule the report:
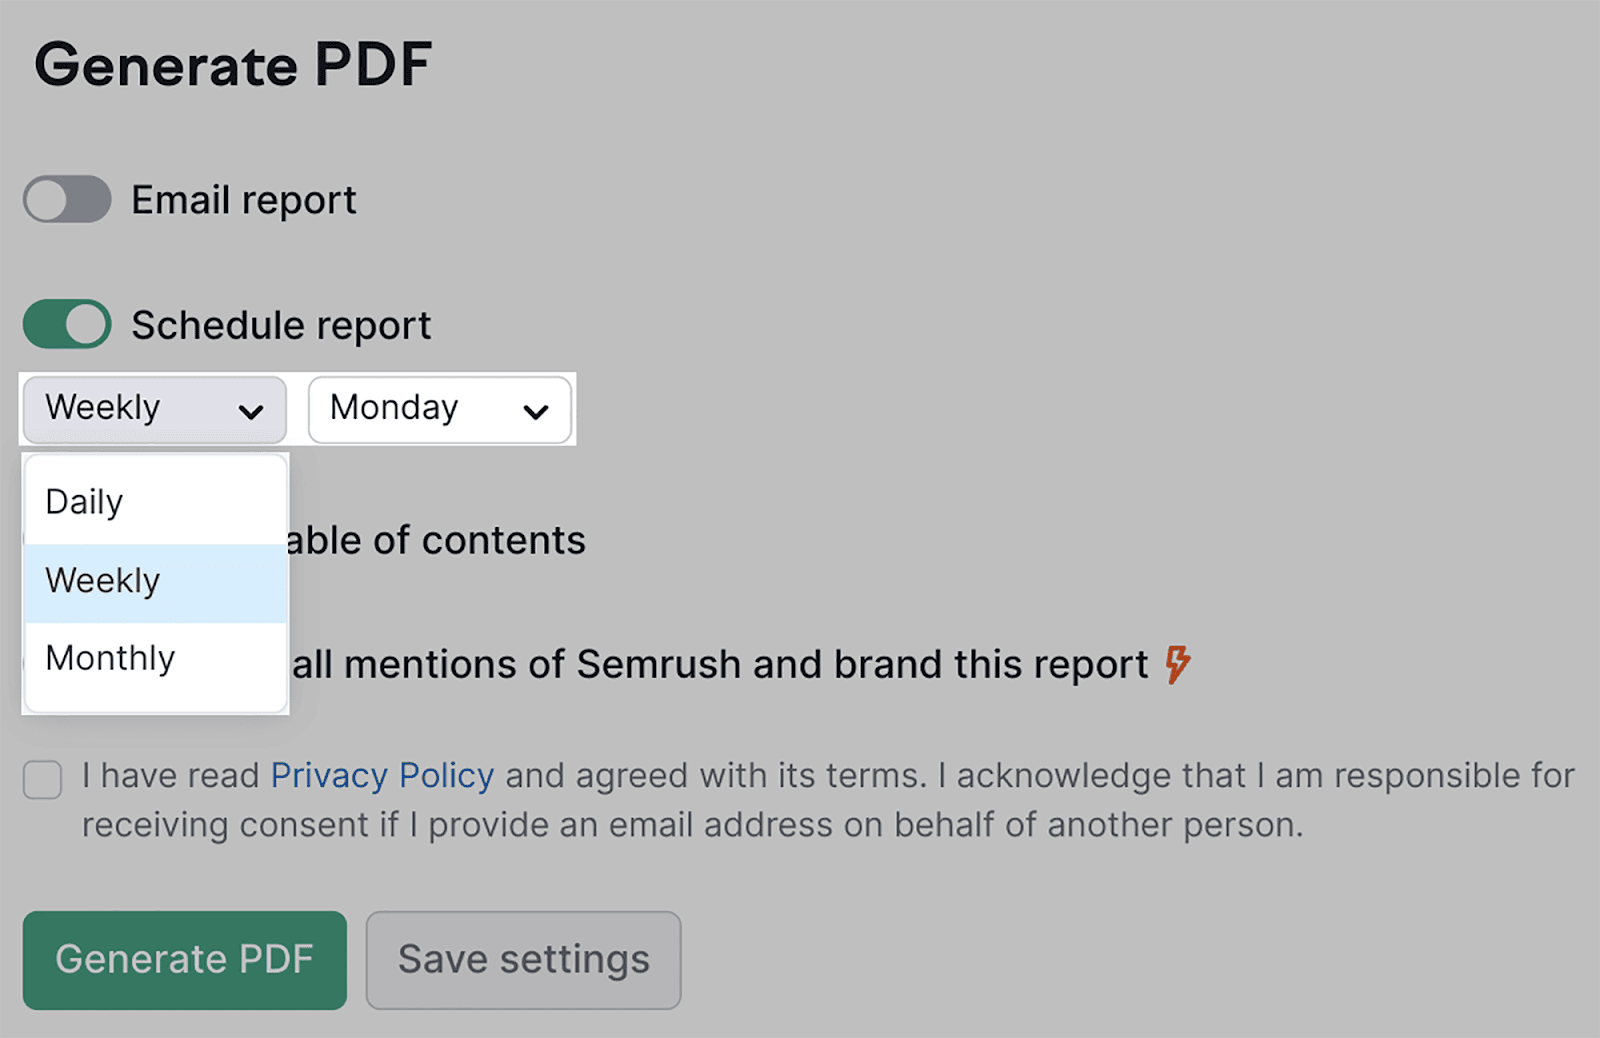
Select whether you want the report to be generated daily, weekly, or monthly and Semrush will create regular reports for you automatically.
Pretty neat!
Google’s Looker Studio is another great tool you can use to create automated reports.
To give you an example, here’s how you can integrate Google Analytics with Looker Studio.
First, head over to the Studio homepage, which will look like this:
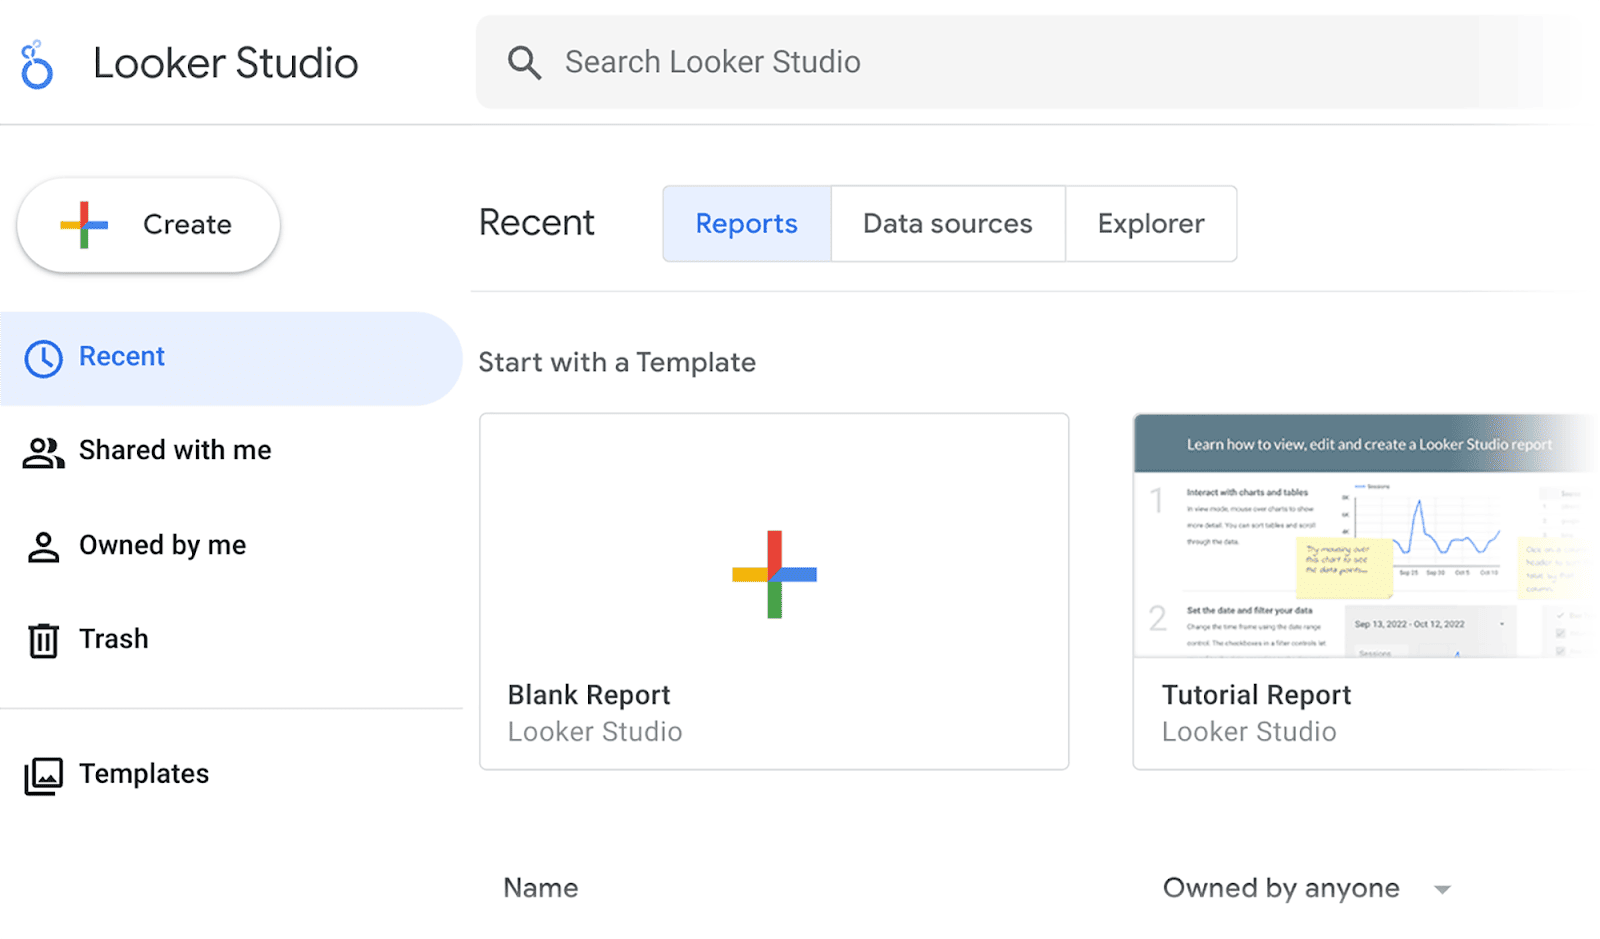
To integrate Google Analytics, click on the “+ Create” button, which you’ll find at the top left of the dashboard.

From the drop-down menu, select “Data source”:
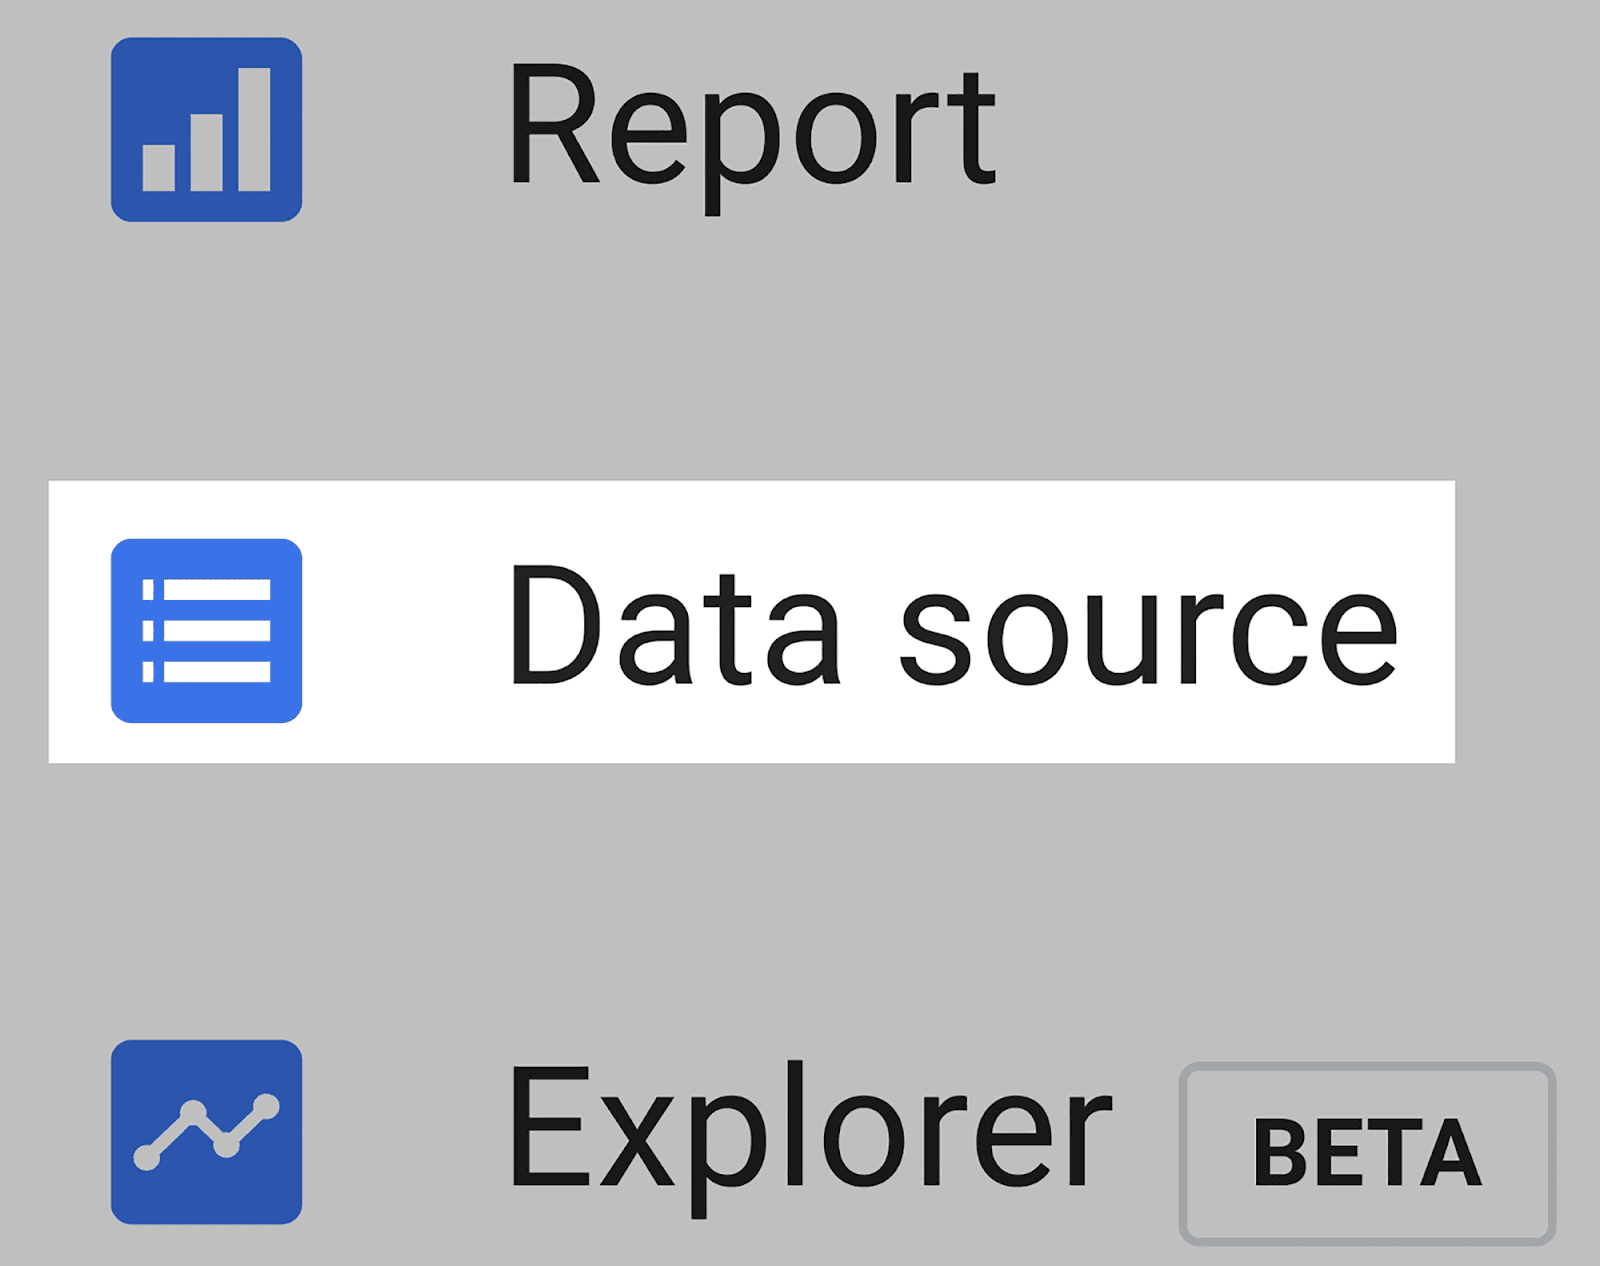
You’ll then be shown a list of data sources you can connect to Looker Studio.
For the purpose of this example, I’m going to select Google Analytics:
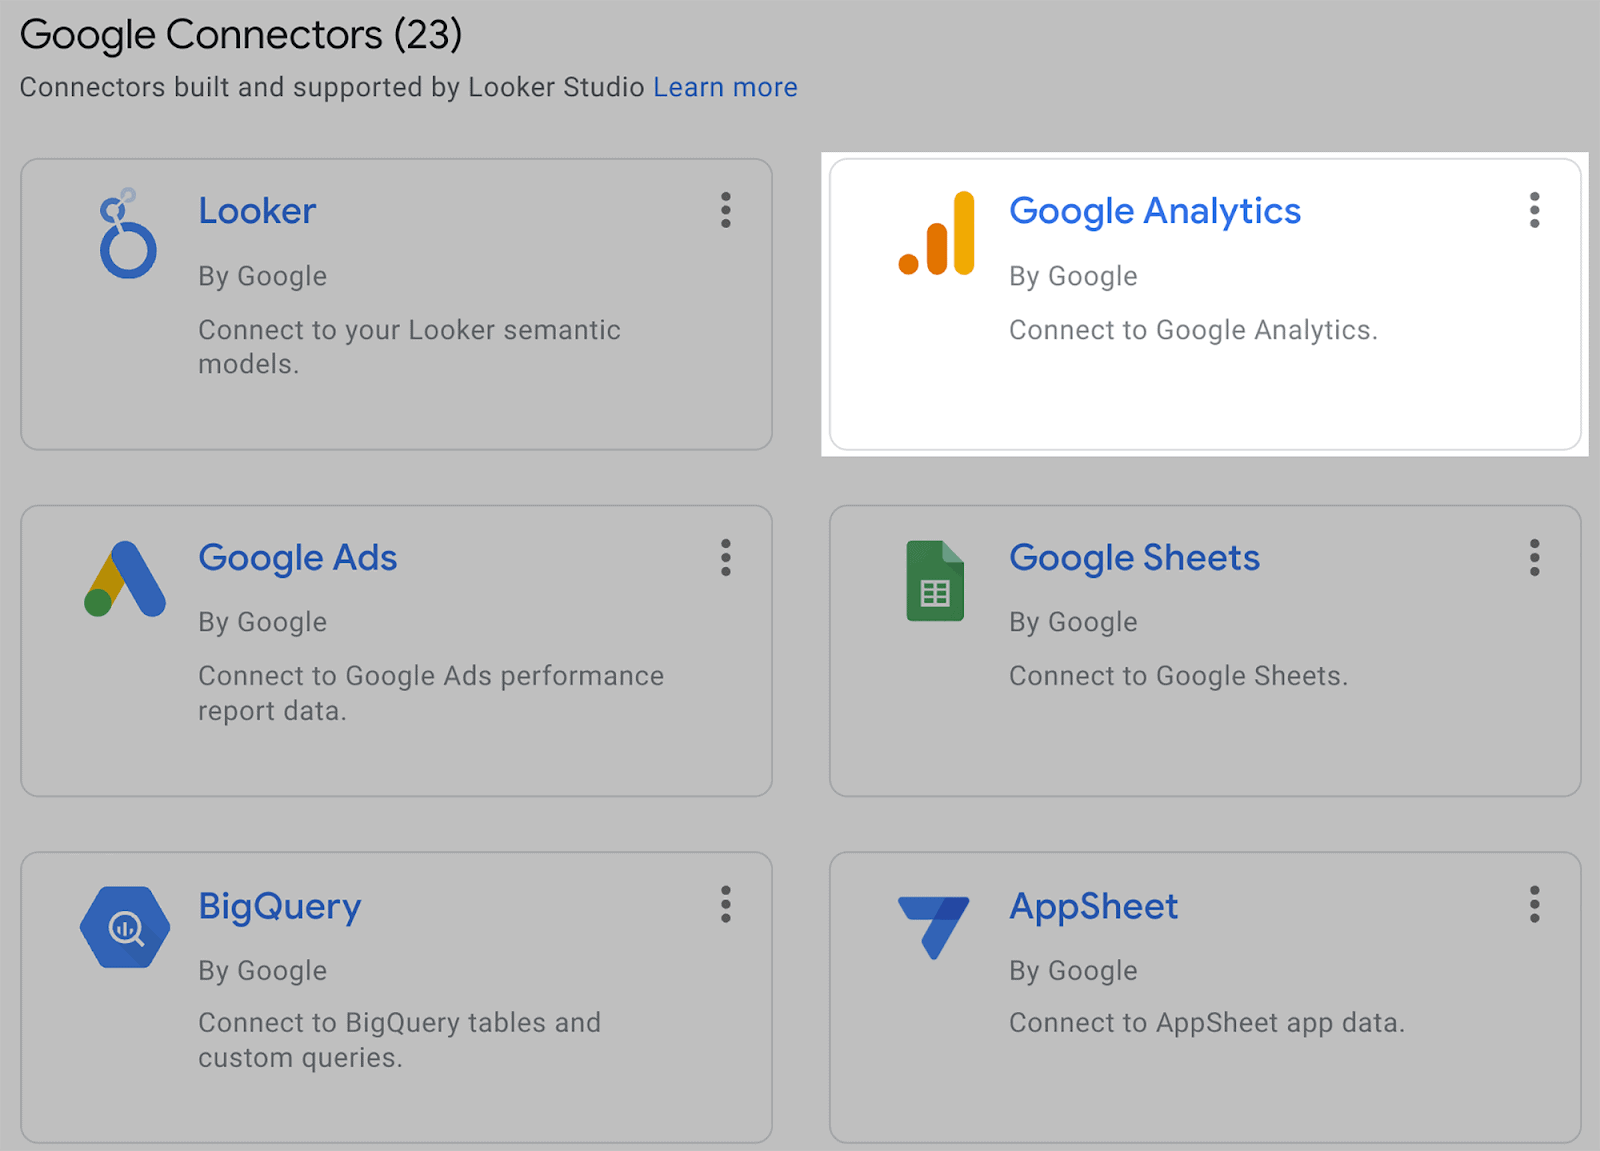
Once you select this, you’ll then need to authorize Google Analytics:

Once authorized, you can start creating automated reports with data pulled directly from Google Analytics.
If you’ve got a Semrush Guru account, you can also export your Semrush data to Looker Studio by clicking on the button at the top right of the page. The two reports you can export are Position Tracking and Site Audit.

How to Make SEO Automation Work
As I said before, AI can only work as an SEO tool with dedicated human input. While AI content generator tools can provide you with content ideas (and even write content for you) it needs to be proofed, edited, and expanded by a human.
The same goes for the Semrush toolkits that I’ve listed in this article. While they can automatically track your keywords, review your competitors, and audit your site, they can’t implement any solutions to the issues they uncover.
FAQs
Which SEO automation tools offer automation features?
Most keyword research, rank tracking, and backlink analysis tools offer some degree of automation. Tools like Semrush track your backlinks, keyword rankings, and competitors automatically so that you don’t have to. Basically, any SEO tool that conducts site monitoring and can produce reports when needed can be classed as an SEO automation tool.
It’s worth noting that some SEO tools may offer limited automation capability if you’re using a free plan.
Is SEO automation suitable for all website types?
Yes, SEOs can use tools to automate SEO tasks on any website. Depending on the CMS being used, automation may be more limited for some website types.
Will SEO automation replace human input?
No, SEO automation won’t replace human input. SEO automation is great for compiling large amounts of complex data about websites, but it’s up to SEOs to then take that information and use it to improve the site.
Source link : Backlinko.com
