This tutorial is for SEO consultants, SEO Agency Managers, and other professionals who could benefit from making a copy of (and using) SE Ranking’s SEO Agency Manager Looker Studio Dashboard.
As we’ve discussed in our data visualization dashboards blog post, a well-configured Looker Studio dashboard can become a powerful ally in your SEO and site performance analytics efforts. SE Ranking’s Looker Studio Dashboard offers a powerful suite of features and data sources, including the kind of robust SEO analytics and client reporting features that are essential for SEO Agency Managers. But to get the most out of Looker Studio, proper configuration is key.
This guide is designed to take you step-by-step as you configure the Looker Studio Dashboard. We’ll go over everything from the initial setup and copying to connecting data sources and custom fields, all the way to adding and disabling data views. The objective of fulfilling these processes is to tailor the reporting experience to your agency’s unique needs.
Step 1: Copy the Looker Studio Dashboard
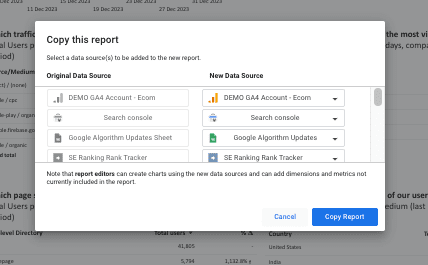
To copy the Looker Studio dashboard, access the report via the link and click on the three dots in the top-right corner of the report. Select ‘Make a copy’.

While you can configure your data sources now, it’s much easier to do so at a later stage. Apply these data sources and click on ‘Copy report’.
Step 2: Configure your data sources
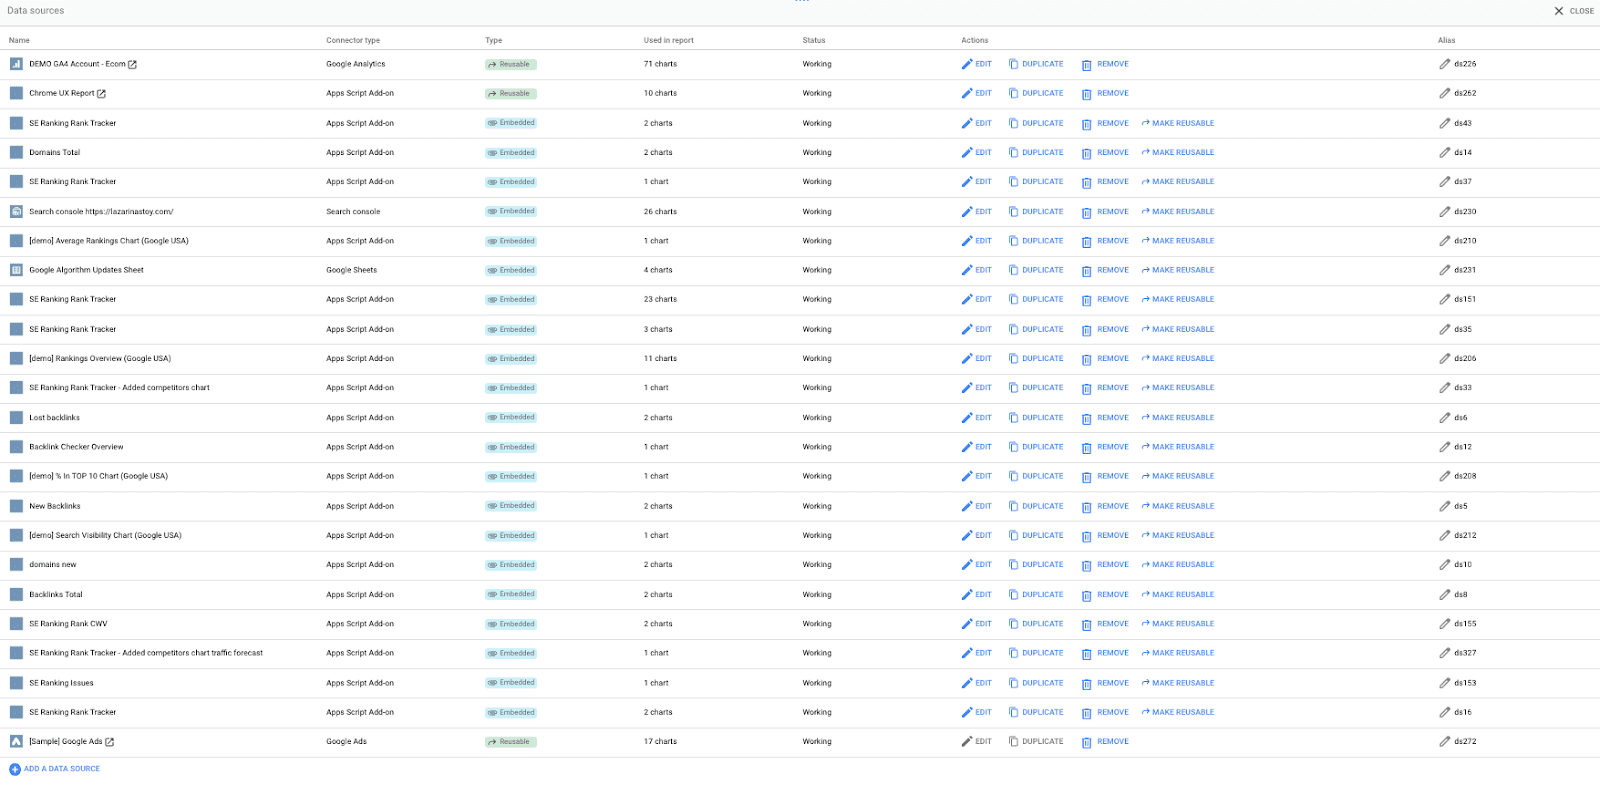
Once you have copied the Data Studio dashboard, navigate straight to the added data sources by clicking on the Resource > Manage added data sources menu, located at the top.

This will open a list of data sources that have been added to the report, as seen in the screenshot below.
Reconnect data sources to your data
Go through this list individually and for each data source:


- Select your desired data source from the list, change the name of the data source, and then click on Reconnect. In the next screen, click on Finished
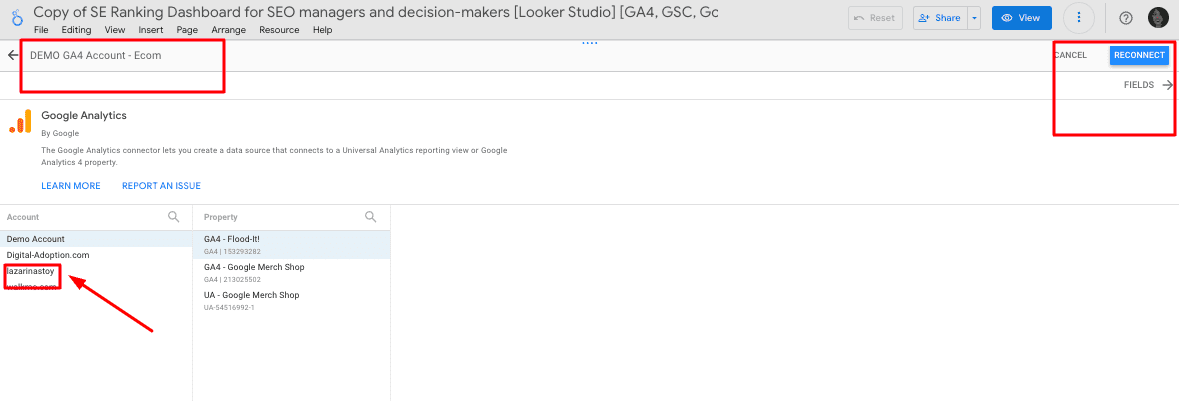
- Repeat this process for all data sources on the list
Additional notes on data configurations:
- If you’re having trouble accessing the Google Algorithm Updates sheet, please make a copy of this sheet. It’s connected to Google’s public dashboard and updates automatically per HTML formula import.
- Don’t change any of the configurations to the SE Ranking connectors. Simply select your project from the drop-down list and reconnect.
- Don’t delete data sources. This will break the chart configurations. Instead, reconnect them to your desired GA4, GSC, or Google Ads data source or SE Ranking project.
Troubleshooting connector configurations in case of extended data configuration issues:
Keep in mind that you won’t be able to see the GSC data in the SEO Agency Manager dashboard because you need to connect your own accounts first. If you don’t do this, you’ll see the ‘No Data Set Access’ error.
If you encounter any extended configuration issues, you can reconnect data sources, such as GA4, Google Ads, or Google Search Console. Just create a new data source, reconnect it to the charts, and then delete the demo. Here’s a quick demo of what this process would look like.
To do this:
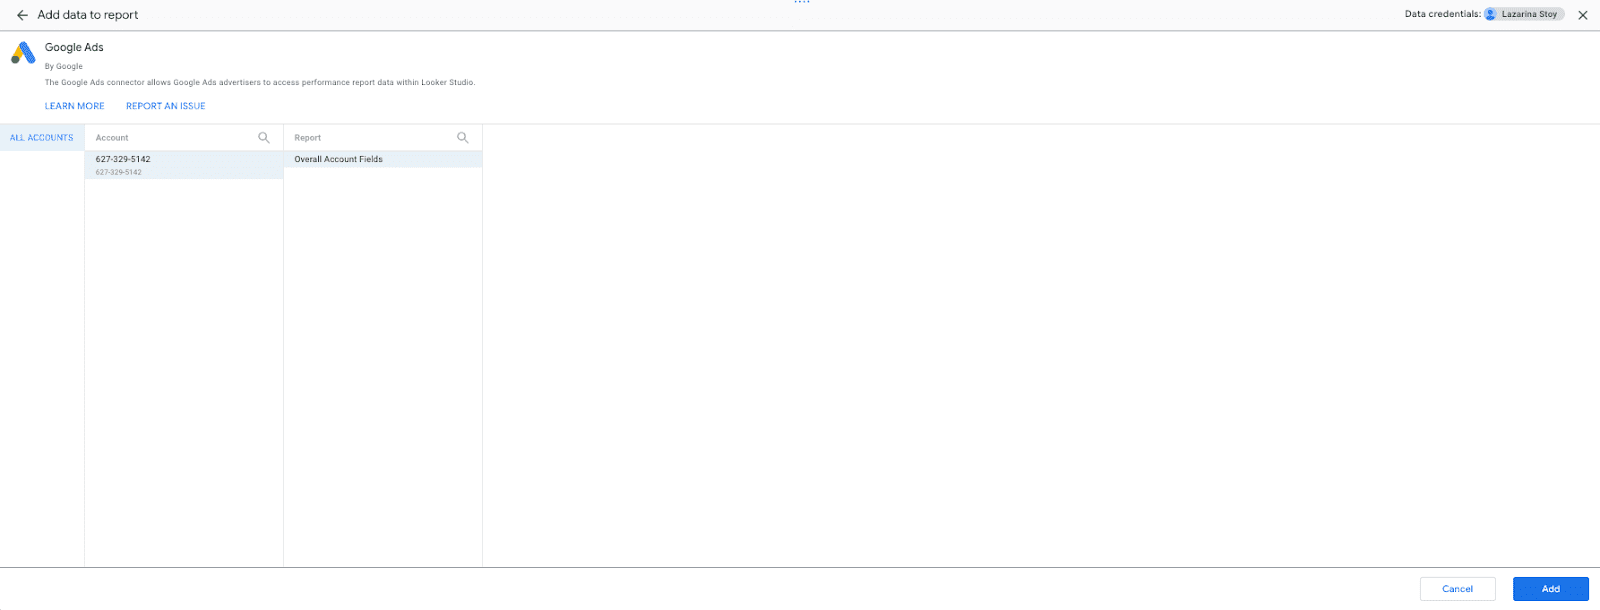
- Connect your data source via the Add data menu.

- Connect to your selected data source (e.g. GA4 or Google Ads), and click on Add.
- Identify pages containing data from this source by using the chart data source notes.
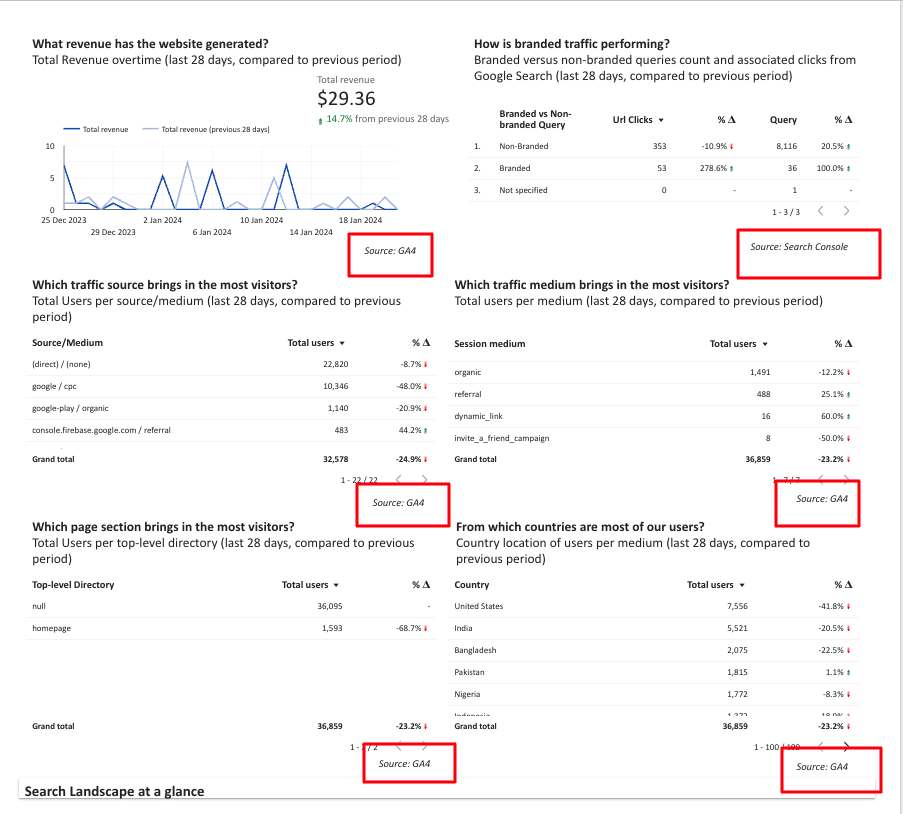
- Right-click on a chart with the data source you’re trying to replace. Click on Select charts with this data source on page.
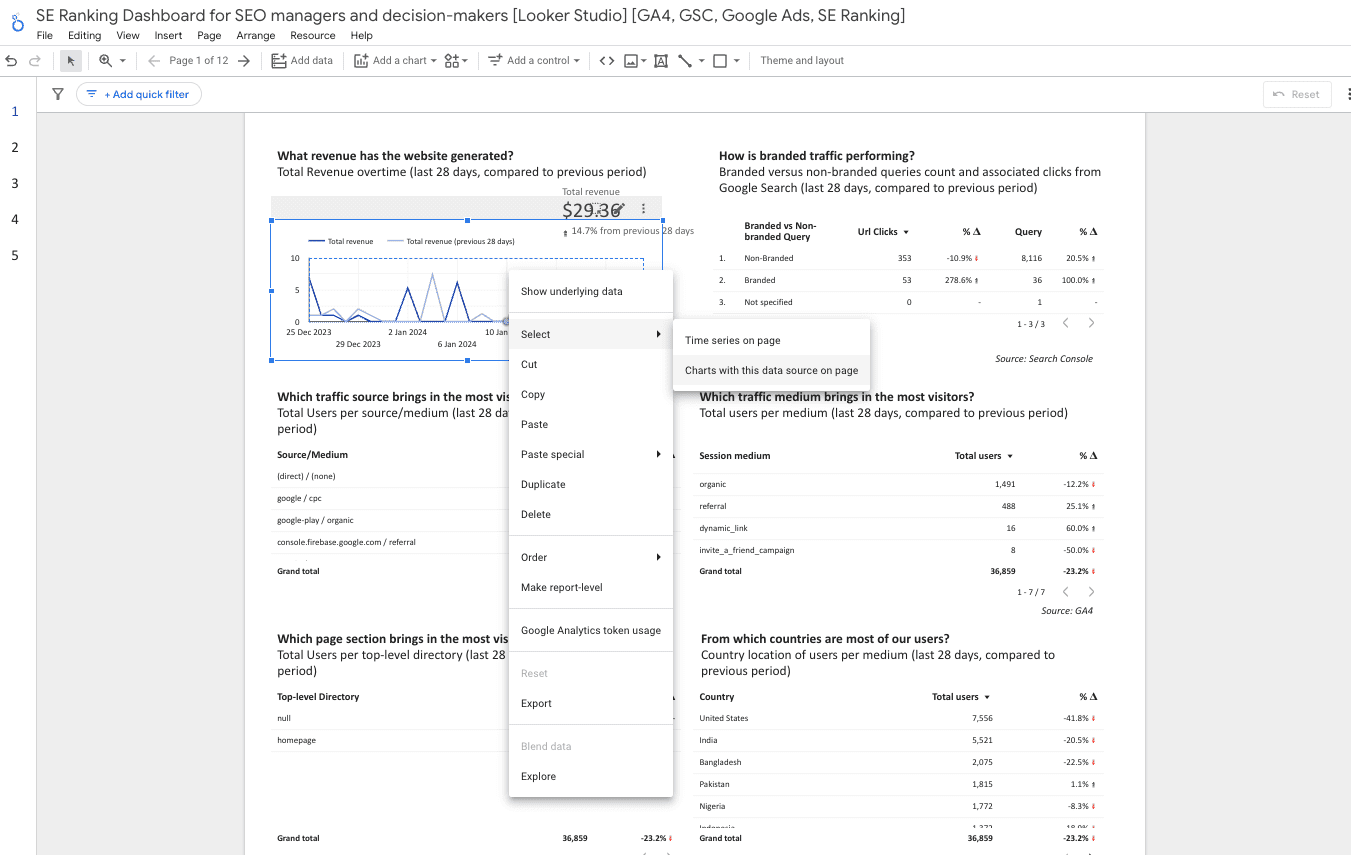
- Navigate to the right-side panel and click on the edit button next to the existing data source. Then, search for or select the desired data source from the drop-down menu.
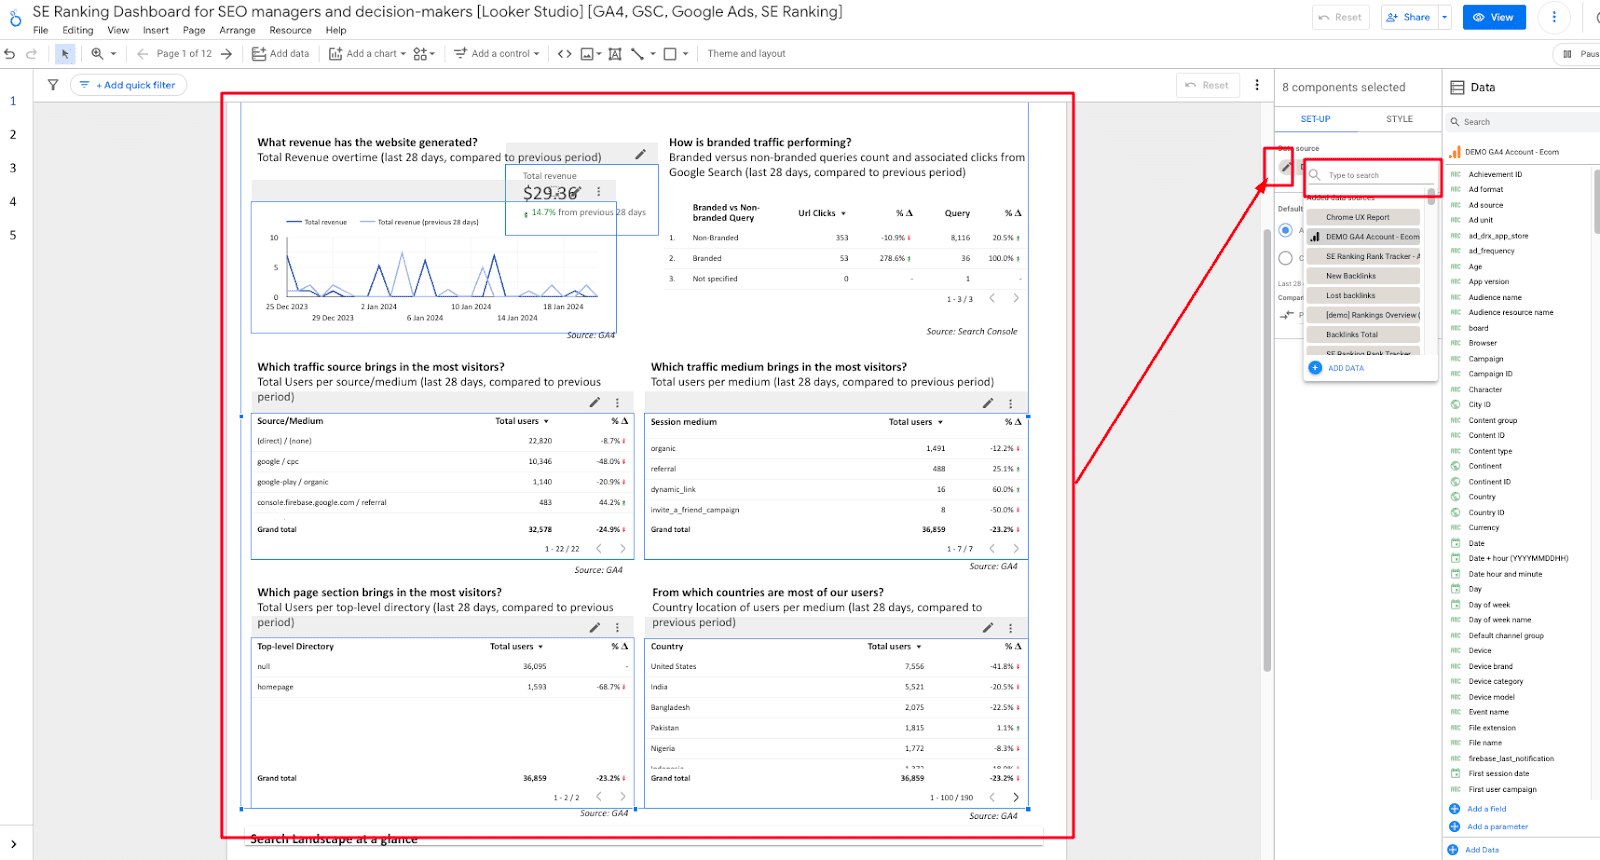
- Repeat this process with all pages containing your data source.
- Once completed, navigate to the Resource > Manage Added Data Sources menu, and delete the old data source. It should now show up as being used in 0 charts.
Configure filters to the appropriate data sources
Filters have now been applied that are connected to the GA4 data source. If you encounter any errors, please troubleshoot the filters applied. You can navigate to the filters menu by clicking on Resource > Manage filters.
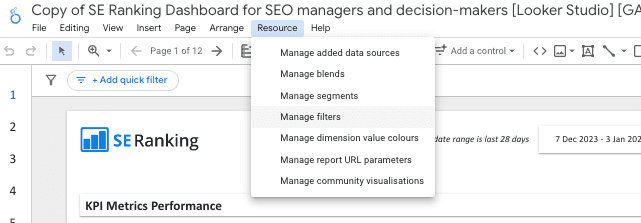
After reconnecting the dashboard to all of your data sources, click the Edit button for each filter to check that there is a data source associated with it. The first two should connect to SE Ranking’s connector, while the latter two should connect to your GA4 data source.

The former two filters have been applied to page 5: Rankings (tracked) under Core SEO Performance. The latter two have been applied to page 9: Referral Traffic Analytics, under Backlinks and Referral Traffic.
Step 3: Configure the custom fields and dimensions
There are a few custom fields and dimensions that have been added to the report. After you’ve done steps 1 and 2 in this section, we’ll go over each formula and its accompanying data source so you can add them to your report.
Here’s a recap on how to create custom dimensions in Looker Studio.
Create a custom title length SEO assessment dimension in GA4
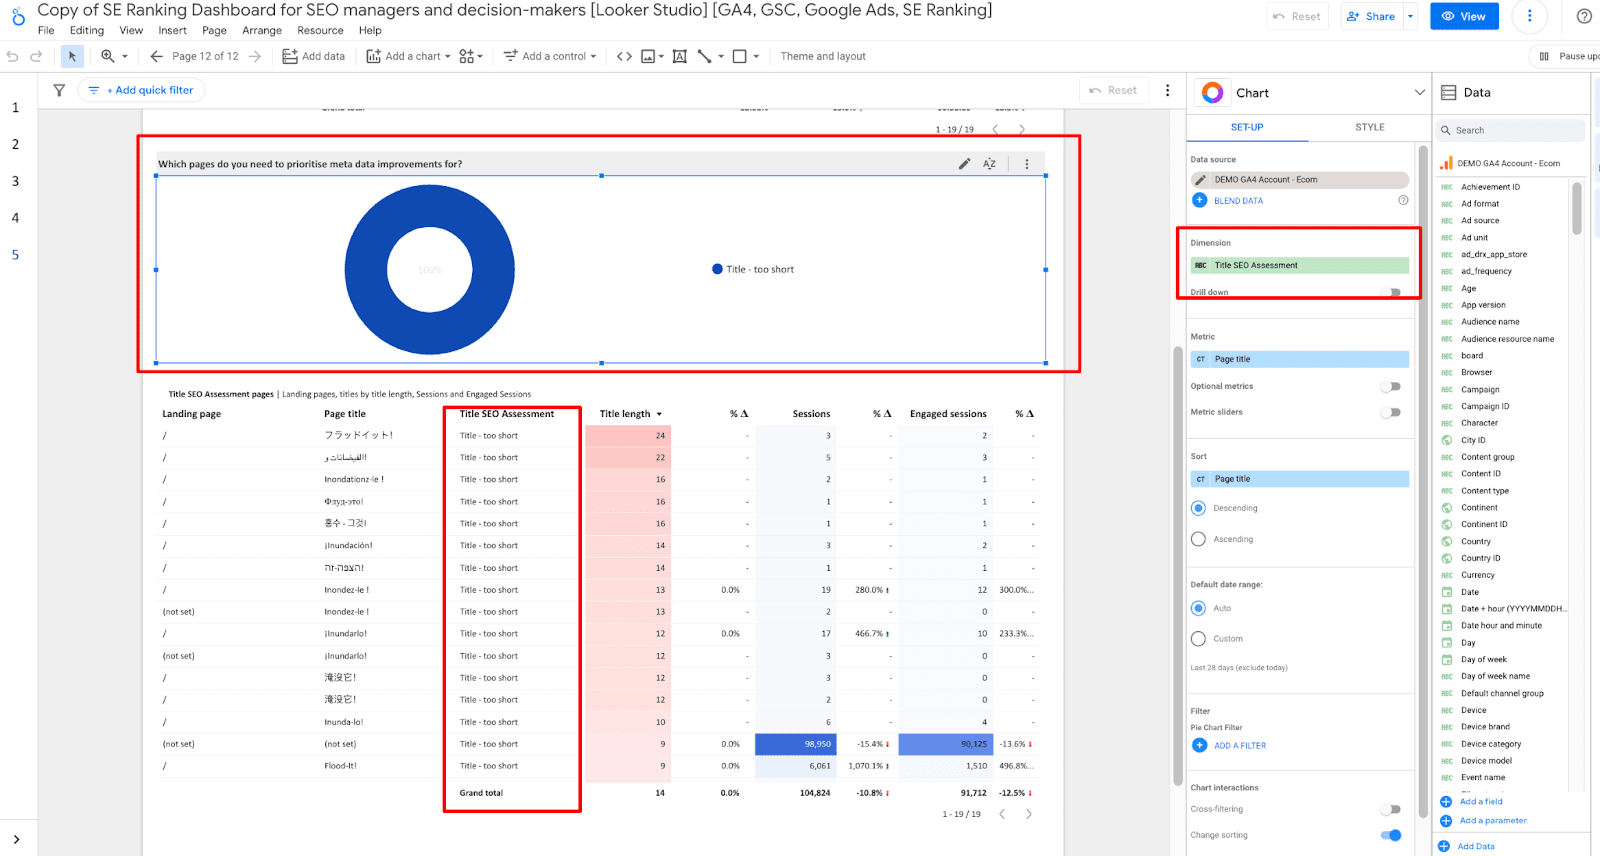
Тhe point of this assessment is to provide you with a label that can be used to quickly categorize titles according to their length. You can export these from the visualizations within the SEO opportunities section of the report. You can also prioritize on-page improvements for these pages.
Here’s the formula for creating this dimension in the GA4 Data source.
CASE
  WHEN length(Page title) >= 50 AND  length(Page title) <= 60 THEN "Title - Perfect"
  WHEN  length(Page title) >= 40
AND  length(Page title)<= 50 THEN "Title - good"
  WHEN  length(Page title) < 40 THEN "Title - too short"
  WHEN  length(Page title)> 60 THEN "Title too long"
END

Once everything is entered, go to page 12: Page-based, under the SEO Opportunities Section of the report. Make sure the next two charts use the custom dimension you created.
Create a custom dimension to differentiate branded queries from non-branded ones within the GSC data source
This goal of this formula is to provide more granularity to your Google Search Console report. It does this by showing you a breakdown of your branded and non-branded queries. The same formula can be applied to the SE Ranking Report’s Keyword field.
Navigate to your Google Search Console connector and create a custom dimension using the following formula.
case
when REGEXP_CONTAINS(Query, 'brandname|brand^|brand name') then "Branded"
when REGEXP_CONTAINS(Query, '(not provided)|(not set)|(unavailable)') then "Not specified"
else "Non-Branded"
end

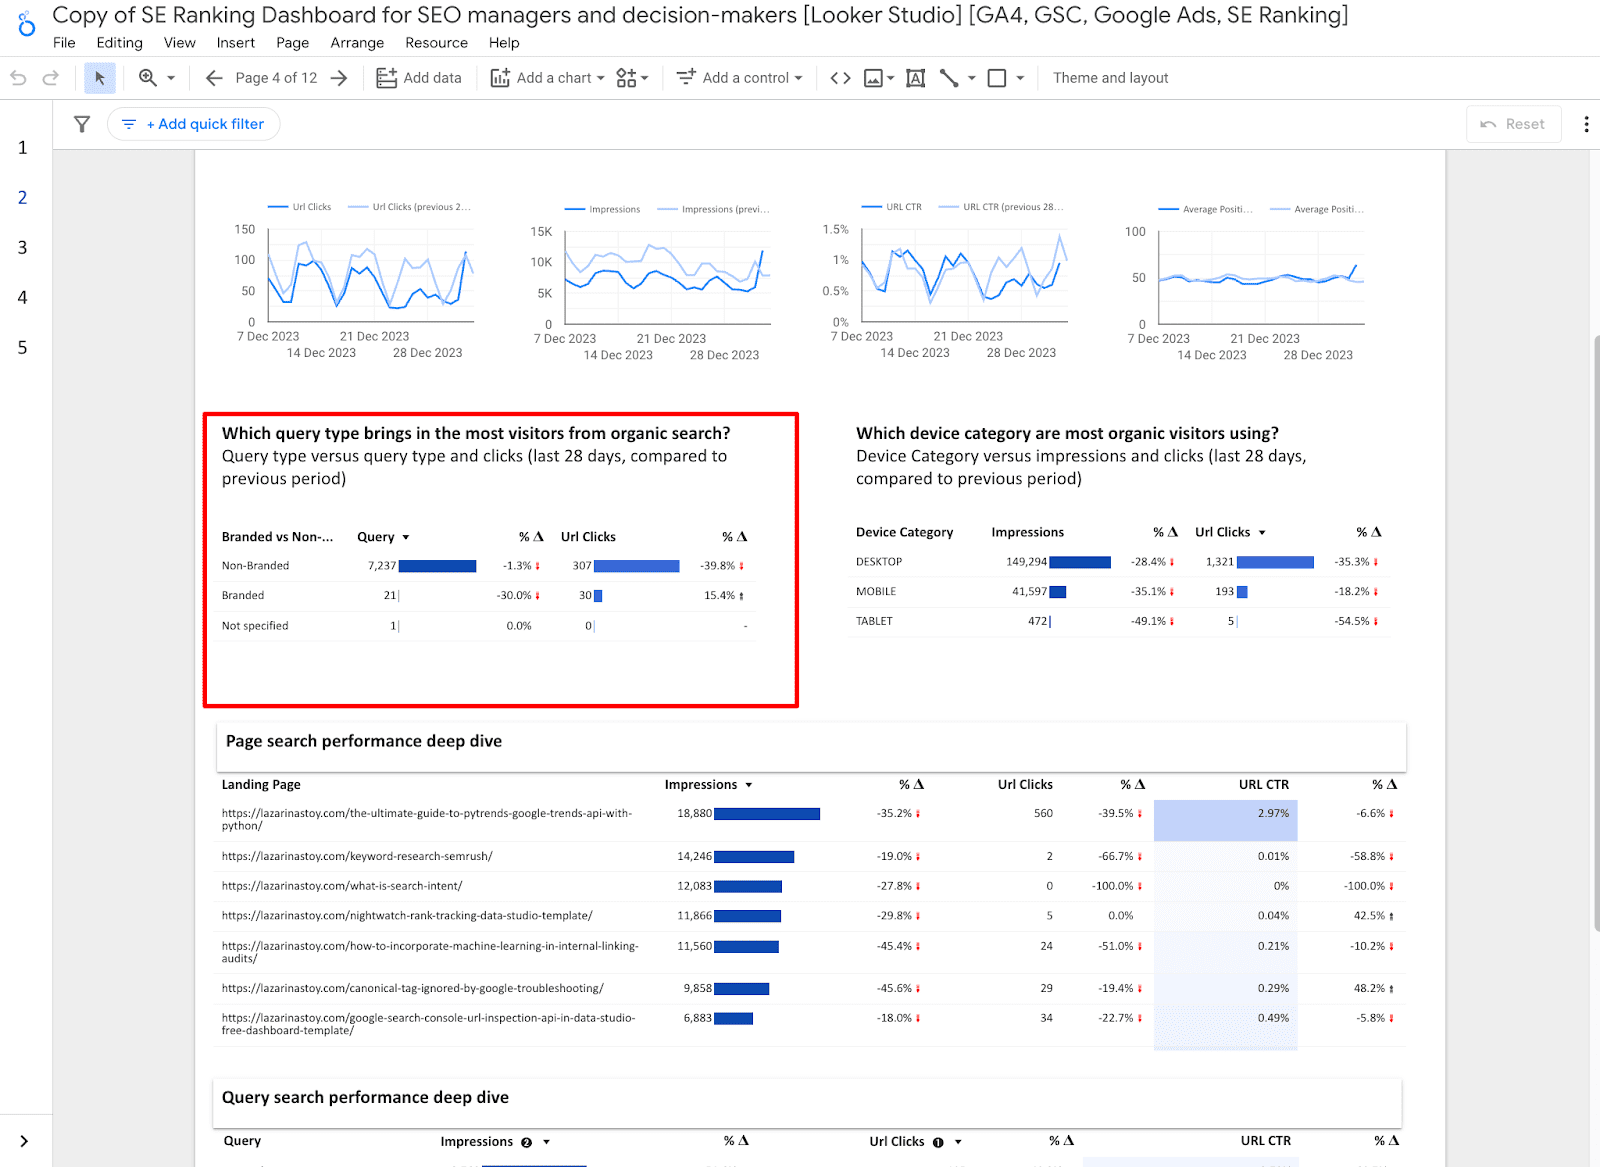
Once you’ve done that, navigate to Page 4: Organic Search performance, located under the Core SEO Performance section of the Looker Studio dashboard. Make sure that this chart is using the custom dimension you just created, and displays counts of queries and URL clicks.
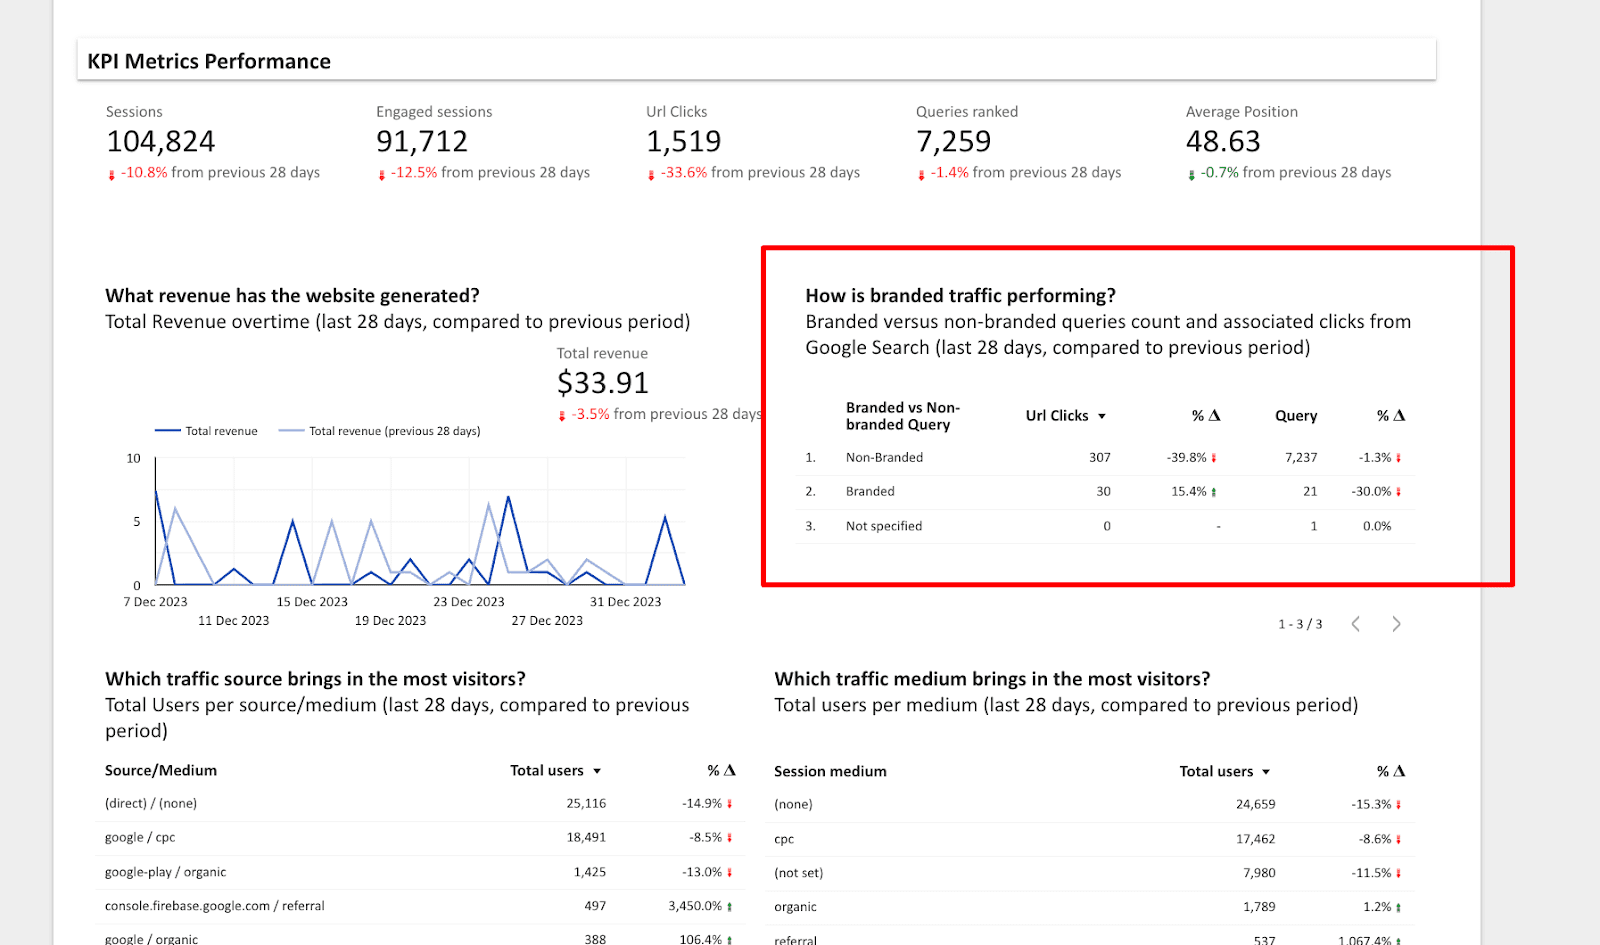
Additionally, check Page 1: Core Metrics and KPIs, located under the At a Glance Performance overview.
Create a custom text metric to label queries based on their average position in the GSC data source
Add another custom metric to the GSC data source. This metric will be a text-based metric. It will use the Average position field to determine labels for queries. Here’s the formula for this metric.
CASE
  WHEN Average Position >= 1 AND Average Position < 3 THEN "Money Keywords - Protect"
  WHEN Average Position >= 3 AND Average Position < 10 THEN "High value Keywords - Prioritize improvements"
  WHEN Average Position >= 10 AND Average Position < 20 THEN "Striking Distance Keywords - Improve"
END

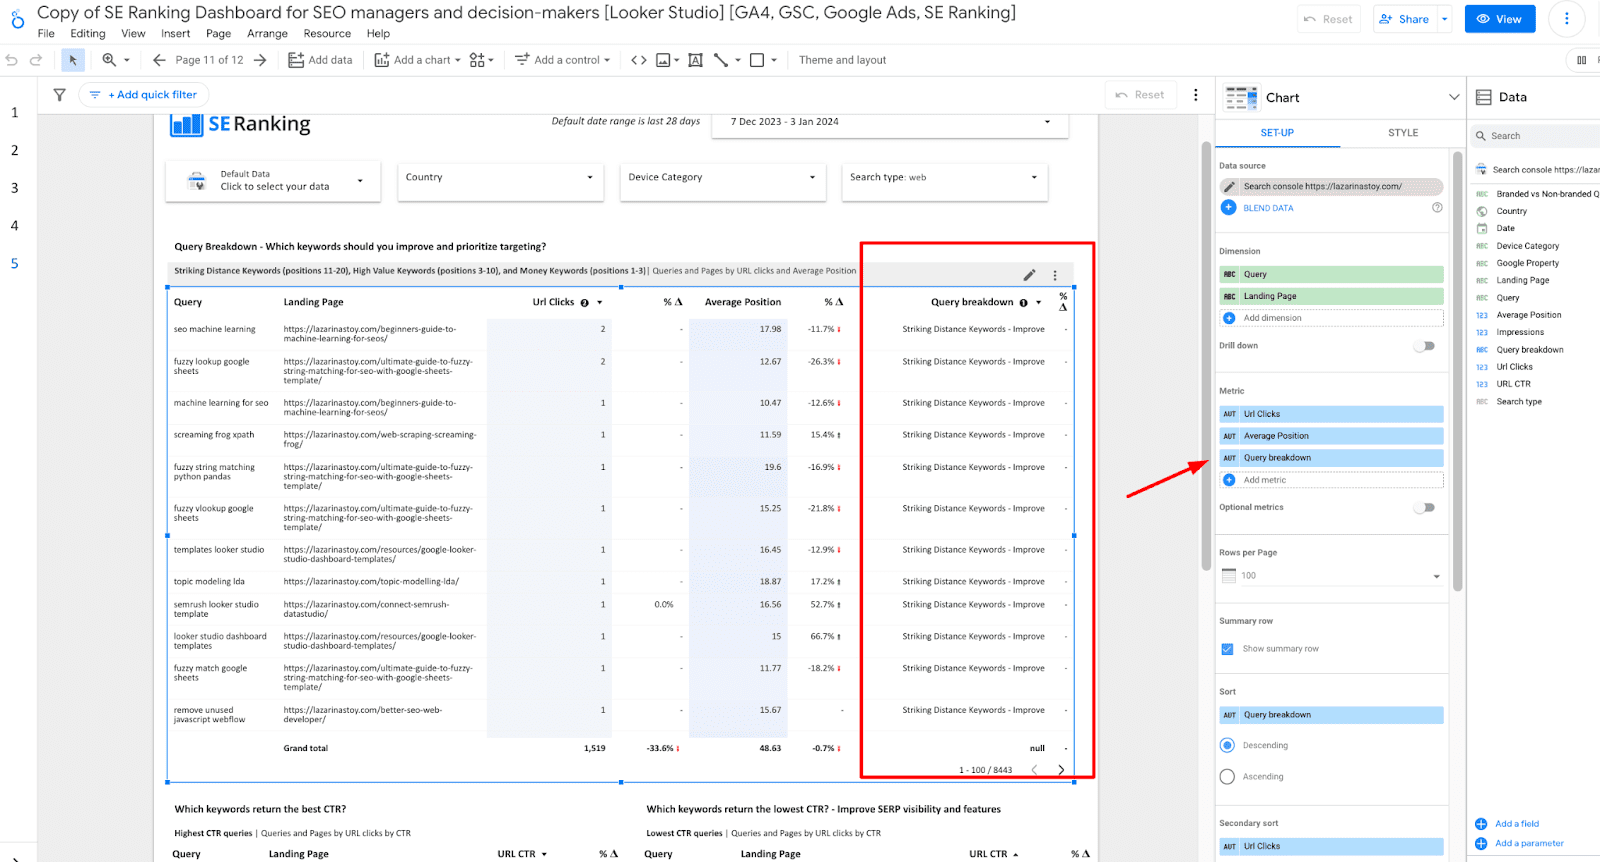
Once you have created this field, navigate to Page 11: Query-based (under SEO opportunities) of the report. Make sure the metric has been added correctly to the following chart.
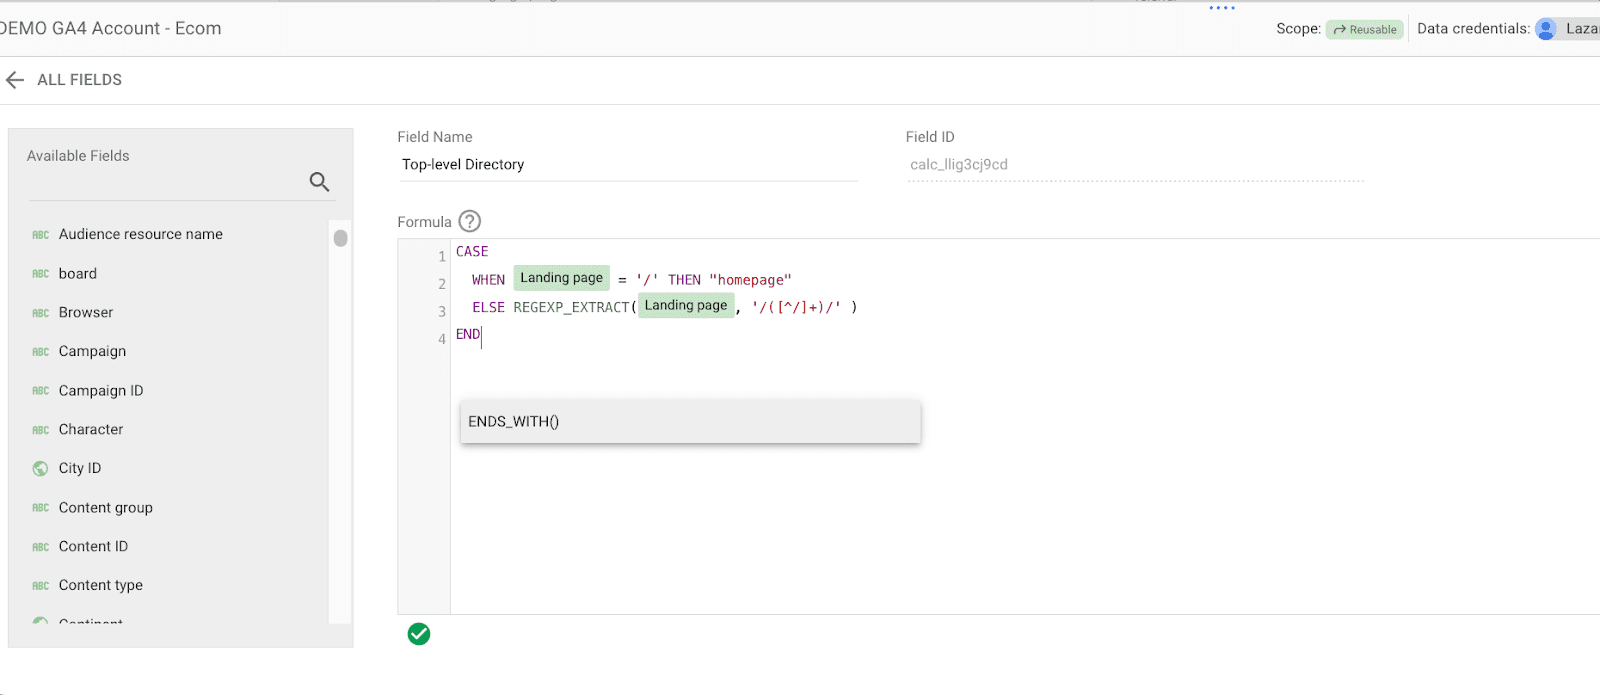
Create a custom top-level directory menu in GA4
Using the GA4 data source, create a custom field for a top-level directory. Note that this provides the most value for hierarchical websites that use the top-level directory to indicate sections. Otherwise, you can use a custom page section formula that corresponds with the structure of your website.
Here’s the formula:
CASE
  WHEN Landing page="/" THEN "homepage"
  ELSE REGEXP_EXTRACT(Landing page, '/([^/]+)/' )
END
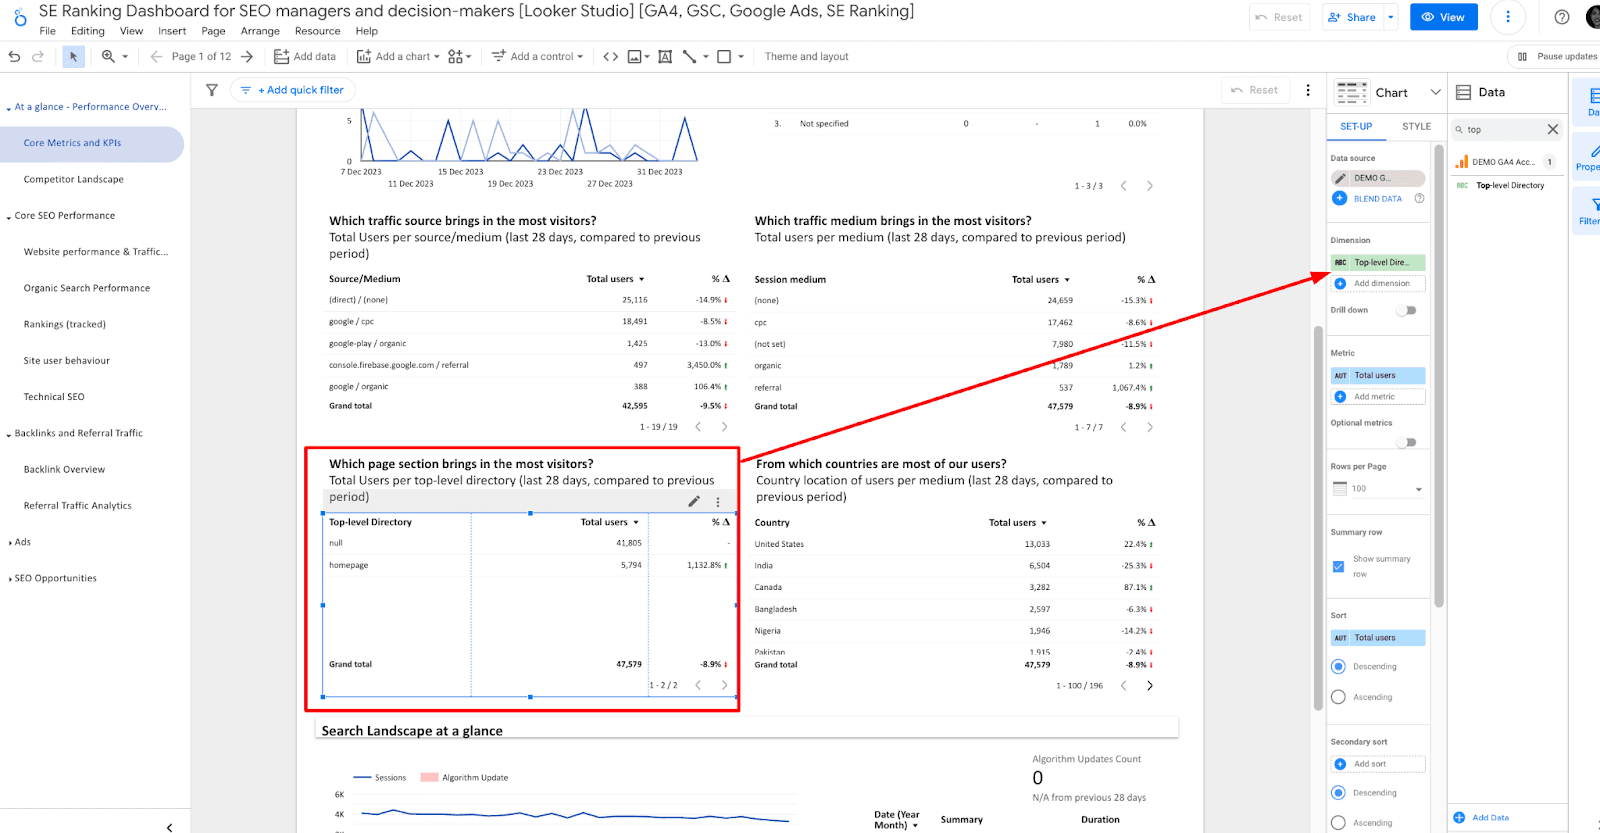
This formula is only used in Page 1: Core Metrics and KPIs, under the At a Glance Performance overview section in the following chart.
Step 4: Configure data blends
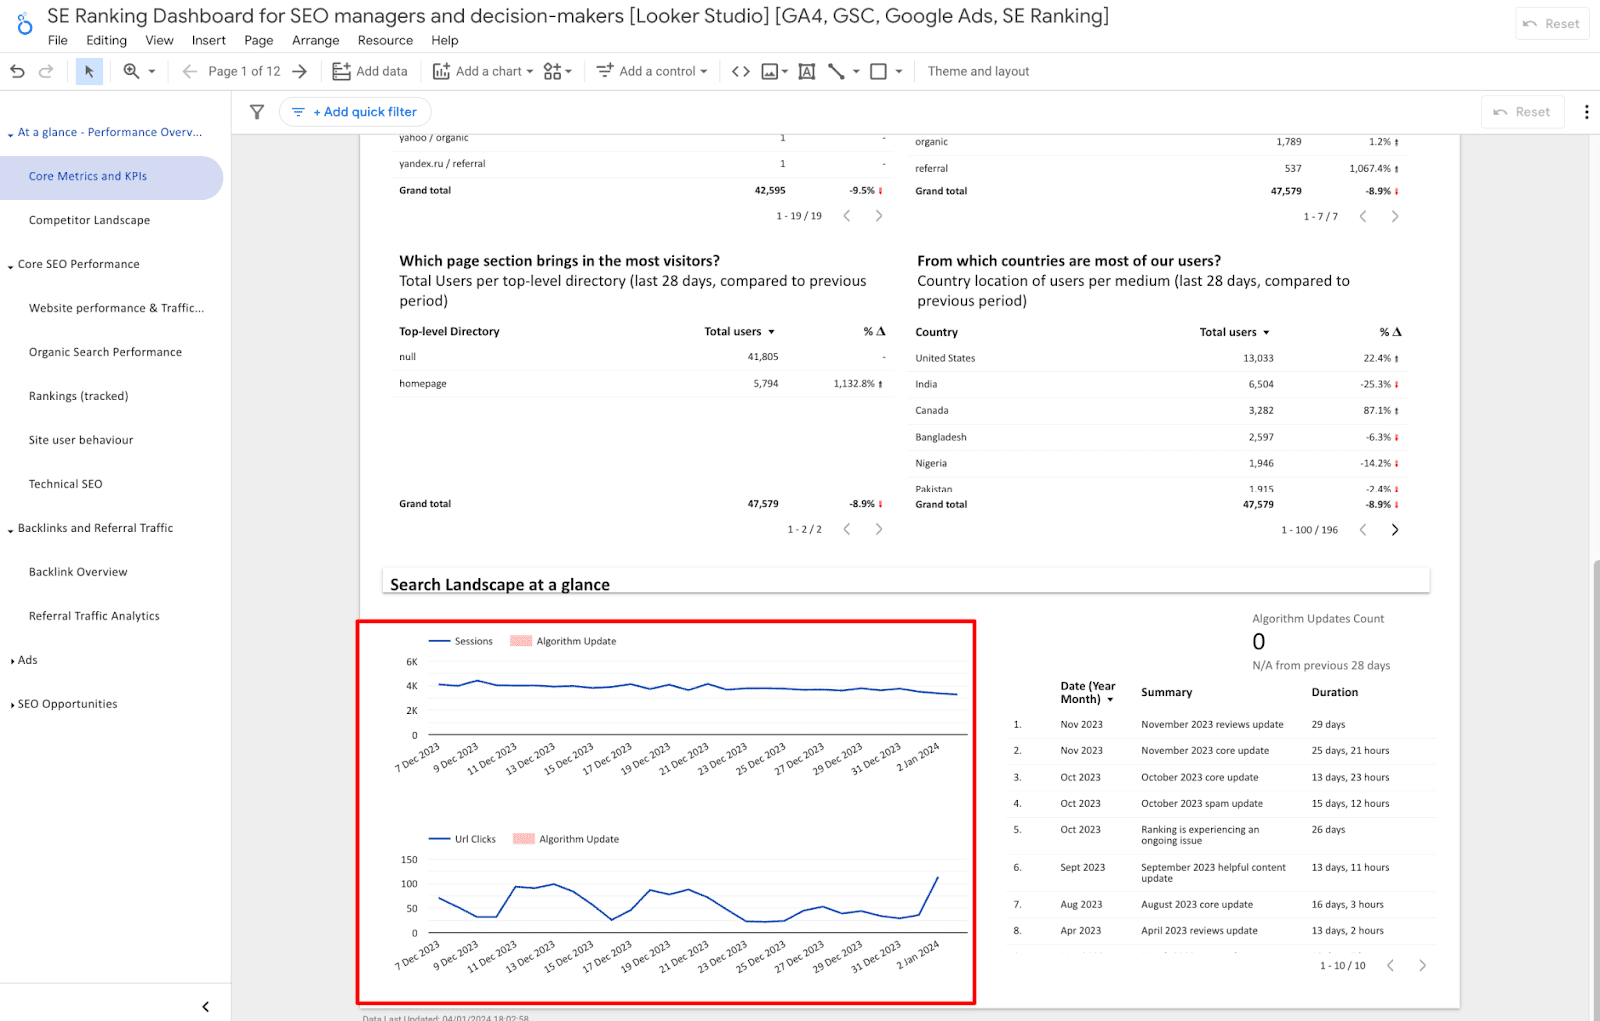
The reporting dashboard only uses two data blends, each of which has a similar function and set-up. Both metrics are used in the charts located at the bottom of Page 1: Core Metrics and KPIs, within the At a Glance Performance overview section of the dashboard.
You can edit these data sources by clicking on the Resource menu and then selecting Manage Blends.

Click to edit each of these individually and then reconnect your respective data source to the data blend. This may have already occurred automatically, in which case you don’t need to do anything. Please consult the configurations below in case you encounter any errors with these charts.
Step 5 (Optional): Enable or disable pages based on your preferences
You might want to disable certain pages that apply neither to your reporting nor your client’s operations.
To disable a section or page that you do not want your stakeholders or reporting collaborators to view, navigate to the report pages menu (from Pages > Manage Pages). Hover over the section or page that you want to disable and click on the three dots to open the page/section menu. Select Hide in view mode.
Step 6: Invite others to access your reporting dashboard
Once you have completed all of the steps above, invite others to access the report. Click on the share menu, and select one of the options listed below:
- Invite others via their email
- Schedule delivery of the Looker Studio dashboard via email. Create a custom message at a specified time and delivery frequency
- Get report link to share
- Embed report. Do this if you’re planning on embedding the Looker Studio dashboard through a webpage or via another interactive method
- Download report if you want to present a PDF to your client by email or another presentation style.

Wrapping up
Don’t forget to check out SE Ranking’s diverse selection of Looker Studio dashboards. You can also benefit from our list of data visualization dashboards recommended for SEOs. Here are some of the dashboards you can find on that list:
