30-second summary:
- There has been a gradual increase in Google’s impact of page load time on website rankings
- Google has introduced the three Core Web Vitals metrics as ranking factors to measure user experience
- The following steps can help you get a better idea of the performance of your website through multiple tests
A fast website not only delivers a better experience but can also increase conversion rates and improve your search engine rankings. Google has introduced the three Core Web Vitals metrics to measure user experience and is using them as a ranking factor.
Let’s take a look at what you can do to test and optimize the performance of your website.
Start in Google Search Console
Want to know if optimizing Core Web Vitals is something you should be thinking about? Use the page experience report in Google Search Console to check if any of the pages on your website are loading too slowly.
Search Console shows data that Google collects from real users in Chrome, and this is also the data that’s used as a ranking signal. You can see exactly what page URLs need to be optimized.

Run a website speed test
Google’s real user data will tell you how fast your website is, but it won’t provide an analysis that explains why your website is slow.
Run a free website speed test to find out. Simply enter the URL of the page you want to test. You’ll get a detailed performance report for your website, including recommendations on how to optimize it.
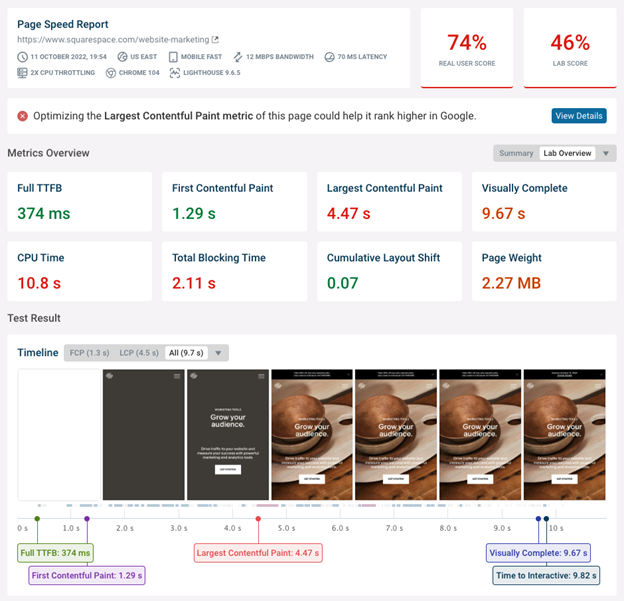
Use priority hints to optimize the Largest Contentful Paint
Priority Hints are a new browser feature that came out in 2022. It allows website owners to indicate how important an image or other resource is on the page.
This is especially important when optimizing the Largest Contentful Paint, one of the three Core Web Vitals metrics. It measures how long it takes for the main page content to appear after opening the page.
By default, browsers assume that all images are low priority until the page starts rendering and the browser knows which images are visible to the user. That way bandwidth isn’t wasted on low-priority images near the bottom of the page or in the footer. But it also slows down important images at the top of the page.
Adding a fetchpriority=”high” attribute to the img element that’s responsible for the Largest Contentful Paint ensures that it’s downloaded quickly.
Use native image lazy loading for optimization
Image lazy loading means only loading images when they become visible to the user. It’s a great way to help the browser focus on the most important content first.
However, image lazy loading can also slow cause images to take longer to load, especially when using a JavaScript lazy loading library. In that case, the browser first needs to load the JavaScript library before starting to load images. This long request chain means that it takes a while for the browser to load the image.
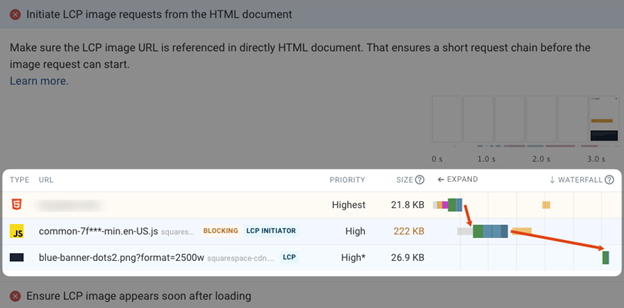
Today browsers support native lazy loading with the loading=”lazy” attribute for images. That way you can get the benefits of lazy loading without incurring the cost of having to download a JavaScript library first.
Remove and optimize render-blocking resources
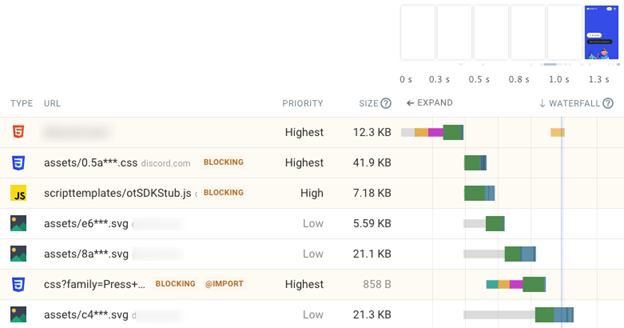
Render-blocking resources are network requests that the browser needs to make before it can show any page content to the user. They include the HTML document, CSS stylesheets, as well as some JavaScript files.
Since these resources have such a big impact on page load time you should check each one to see if it’s truly necessary. The async keyword on the HTML script tag lets you load JavaScript code without blocking rendering.
If a resource has to block rendering check if you can optimize the request to load the resource more quickly, for example by improving compression or loading the file from your main web server instead of from a third party.
Optimize with the new interaction to Next Paint metric
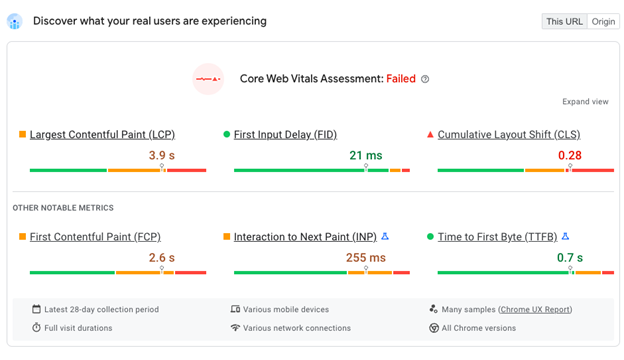
Google has announced a new metric called Interaction to Next Paint. This metric measures how quickly your site responds to user input and is likely to become one of the Core Web Vitals in the future.
You can already see how your website is doing on this metric using tools like PageSpeed Insights.
Continuously monitor your site performance
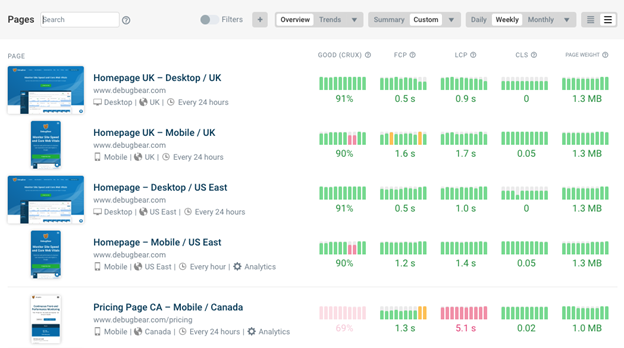
One-off site speed tests can identify performance issues on your website, but they don’t make it easy to keep track of your test results and confirm that your optimizations are working.
DebugBear continuously monitors your website to check and alerts you when there’s a problem. The tool also makes it easy to show off the impact of your work to clients and share test results with your team.
Try DebugBear with a free 14-day trial.
Source link : Searchenginewatch.com
