Posted by
Mordy Oberstein
I don’t think I need to say that Google’s August 2018 broad core update was a big deal. You can judge an update by the buzz it gets… and this update was thunderous. Of course, anyone and everyone

Before We Begin: A Warning to the SEO Community
To tell you the truth, I’m quite apprehensive about writing anything to do with Google algorithm updates. I’m only doing this because someone asked me to look into some data, so I might as well write up what I found. There is a form of sensationalism that comes along with these updates… and I don’t want to go anywhere near that. If you are looking for some sort of definitive analysis that defines the update in absolute terms… this is not that (and to be honest, it doesn’t exist).
Just How Big Was Google’s August Update?

Methodologically speaking, before jumping into what sort of sites Google was targeting with the update and before even thinking about which specific sites saw big losses, I wanted to see if one area, if one niche, was impacted by the update more than others.
Let me be clear, I did not even have the thought that one industry would be impacted and not another. I don’t think that’s the approach to Google updates these days, nor do I think there’s any chance of that happening. What I was trying to see was if one niche/type of site (i.e., those related to health or commerce) saw greater levels of volatility than others. Why? Well, it would be a quick way to determine which sites I should look at first because getting anywhere with these updates is super tedious and can be like finding a needle in a haystack.
About the
Data I Collected – Explaining the Metrics
I looked at six different niches and compared rank fluctuations at different rank positions and ranges of positions. Specifically, I looked at the percentage of times keywords in our dataset produced the same URL in the 1st, 2nd, and 3rd rank position on July 1st and July 5th. Meaning, on July
At the same time, I also ran the exact same data, i.e., the exact same metrics for August 1st and August 5th. Our rank fluctuation weather tool started to pick up rank changes in earnest on the 1st. As the 5th rolled in we tracked normal rank volatility levels. By comparing data from August 1st to the 5th I was able to compare what Google was showing on the SERP just as the update rolled out to what we were left with after it had run its course.
Finally, I compared the two datasets to determine the overall impact and size of the update.
Niche Level Data for the August 2018 Google Algorithm Update
With caveats, explanations, and so forth out of the way, let’s have a look at the actual data.
Health Niche Data – August 2018 Google Update
Let’s begin with the health niche since it was one of the most volatile and as I’ll show later on had some of the more noticeable movements at the site level.
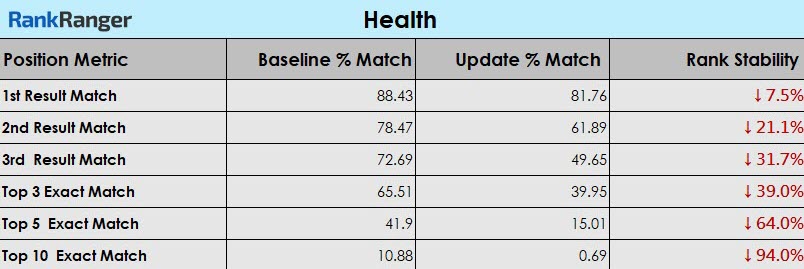
What’s striking here is the substantial decrease in rank stability at the first position on the SERP. While other niches, as we’ll soon see, displayed a similar pattern, this behavior is unique to the August 2018 update. It’s rare to see any sort of substantial shift at the top position. It is standard, even during an update, for Google to leave the top ranking site alone. Seeing a 7.5% drop in the stability of the 1st position is not something I’ve seen previously. The same, although to a lesser degree holds true for the 2nd position, the decrease in match % at this position is drastic and unusual relative to other updates.
Similarly, an almost 40% drop in the percentage of the top 3 URLs that were an exact match during the update period (as compared to the baseline period) is likewise significantly striking.
The same holds true for the Top 10 Exact Match metric. Traditionally, this is the most volatile metric. This makes good sense as the metric not only demands all 10 URLs match their order exactly from one data point to the next, but includes far more volatile positions than the other metrics (i.e., positions 6 – 10). That said, the stability among the top 10 was all but obliterated during the update. I have never seen such a drastic stability loss within this metric.
With data like this, it’s no wonder that Barry Schwartz named this the Medic Update (after seeing so many sites within the health niche report losses).
Travel Niche Data – August 2018 Google Update
Sites within the travel niche appear to have been impacted to a lesser degree when compared to the data just shown for the health niche.
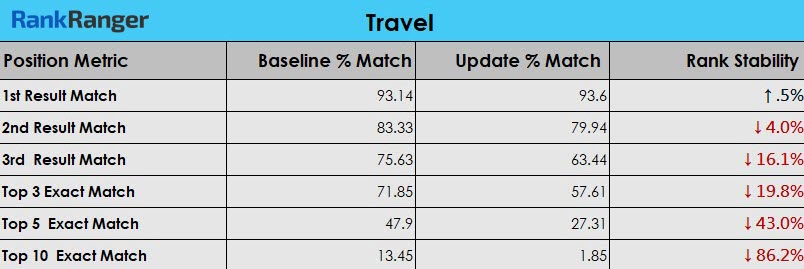
The niche’s relative stability (a poor word choice for which there is no doubt) is most clearly evident at the 1st position. Here, the 1st Result Exact Match metric slightly improved during the update period. Though the stability increase is within the margin of error, it is clearly differentiated from the data shown within the health niche. Similarly, the 4% decrease in stability shown at the 2nd position when comparing the two data periods is far closer to the norms seen for this metric during an update.
That said, and as you can clearly see, there was an enormous shakeup on the SERP as each of the metrics dealing with results below the 2nd position were highly volatile.
******** Niche Data – August 2018 Google Update
It might sound like a funny niche to specifically study, but exceptionally high volatility within the niche would point to updates that perhaps are related to quality or links. Here, however, the data aligns

Interestingly, ********, the travel niche, and as we’ll see momentarily, the food & drink niche were the three industries that our data recorded an increase
However, as compared to the travel niche, all of the other metrics, including the data for the 2nd Result Match were all highly volatile. In fact, the loss of rank stability shown for the Top 10 Exact Match metric exceeded that shown within the health niche by two and a half percentage points.
Food & Drink Niche Data – August 2018 Google Update
The food & drink niche showed rank behavior that resembled both some of the trends seen in the travel niche as well as the more volatile health niche.
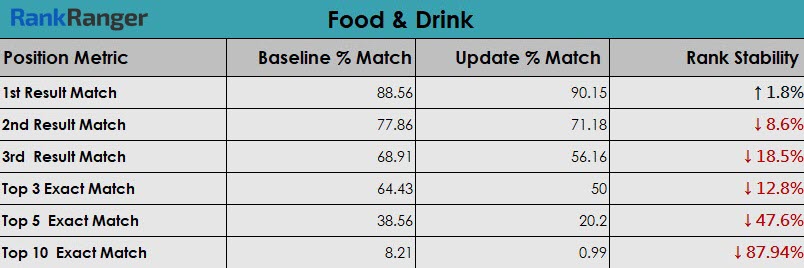
At the 1st position, this niche was the only industry to show an increase in stability that was not marginal. There are multiple reasons why I might speculate the data acts as such, so I won’t.
In any case, the data that follows the 1st Result Match metric all point towards significant movement as a result of the update. That said, even in these instances the data is bit milder than some of the other industries. Just as an example, the percentage of domains within the top 3 results that were an exact match within the update period was down 18.5% when compared to the baseline data. This in contradistinction to a 39%, 19.8%, and 31.2% stability loss within the health, travel, and ******** niches respectively.
Finance Niche Data – August 2018 Google Update
The data that came from the finance niche was overall the most volatile. Here, the 1st position saw a comparative stability loss of 11.5%, the highest of all niches.
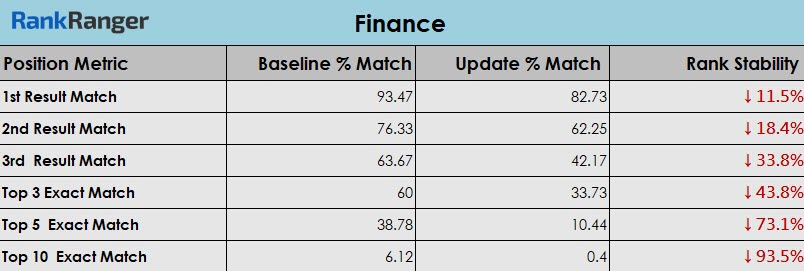
This trend towards more movement at the top of the SERP was further evidenced by the Top 3 Exact Match metric. With a 43.8% decrease in rank stability, the finance niche was the most unstable among the top 3 when compared to all other niches studied. This, the health niche, as well as the ******** niche were the only three to show more than a 90% decrease in stability between the two data periods within the top 10 results.
Home Goods Niche Data – August 2018 Google Update
Lastly, the home goods niche showed data that in some ways is similar to that seen within the travel, ********, and food & drink niches, as well as data that corresponded with the health and finance ******** niches.

Like the “more volatile” niches, the home goods data showed a decrease in stability during the update period at the first position. With an 8.3% decrease, the niche showed more volatility at the top of the SERP than the health niche did. The data though was a mixed bag of sorts (relatively speaking). While there was marked instability at the first position, the 2nd Results Match showed a relatively low stability decrease when compared to the health, ********, and finance niches.
More, the decrease in the percentage of top 10 results that exactly matched (again, same sites in the same order) within the update period was notable when compared to the baseline, but it was not as striking as other niches. In fact, the decrease for this metric was the smallest of all the other industries studied.
The Average Number of Positions Changed During the August Update
If you’ll remember our question here was how big was the August 2018 update. There’s one last dataset I’d like to briefly discuss to make the case that this was an extremely potent update. For each of the niches analyzed I also recorded the average number of positions changed for both the baseline and update period data. That is, how many positions did sites move, on average, when Google changed their rankings before as well as during the update.
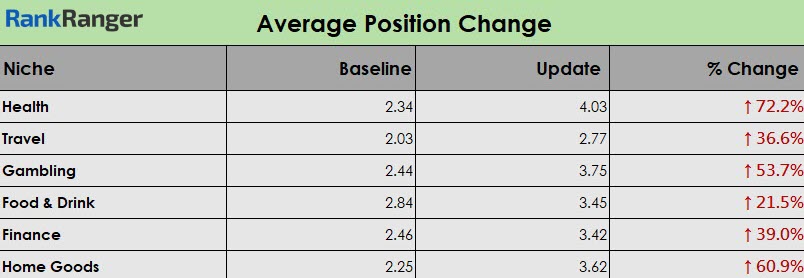
The data here greatly qualifies the loss in rank stability shown earlier. In this instance, Google has made drastic changes to the health industry’s rankings. So much so, that on average sites moved four positions during the update period, which constituted a 72% increase when compared to the baseline data. Also similar to the position data showed above, the travel niche still, on average, only saw sites moving under three positions during the update (for a 37% increase in the average position metric when compared to the baseline data).
Interestingly enough, the home goods niche, which again was this sort of mix between drastic and moderate changes (as compared to the other niches) showed a drastic increase in the average number of positions sites fluctuated during the update relative to the baseline.
In all cases, however, to perhaps the exclusion of the food & drink niche, there was a hardy increase in the number of positions Google tended to move sites during the August update.
Putting All the Data Together – The August Update Was Exceedingly Large
Let’s sort of aggregate all of this data and discuss some key takeaways as opposed to just comparing the niches to each other. As I previously mentioned, heavy shifts, or rather decreases at the 2nd and especially the 1st position on the SERP is odd even during an update. Back in June 2017, I wrote a post similar in many ways to this one, trying to analyze what was then a recent algorithm update. In that post, I did include the Top 3, 5, and 10 Exact Match metrics, but not those analyzing each of the top three positions in isolation. Why? Because the data for those positions did not show a lot of movement. That is not true for the August 2018 update, as I’ve discussed at length above. This makes, according to my data, the August 2018 update far more impactful than some of the other ‘big’ updates we’ve seen in the past.
Further, the extent to which the Top 3, 5, and 10 Exact Match metrics decreased in rank stability when comparing the two data sets was likewise unusual. Take the travel niche, the most moderate of all the industries analyzed. During the June 2017
Another quick example from the ******** industry: In 2017 I recorded that 1.4% of the top 10 results still matched exactly during the update. Here, in August 2018 but .2% of the same result range matched.
There
Site Analysis for the 2018 Google Core Update – Can Google Now Profile Your Site?
Tracking a specific set of sites that all conform to a particular and highly specific pattern during an algorithm shift that all point to the nature of the update is pretty much impossible in this day and age. That said, it is possible at times to find some trends that may reflect on one of the many things Google has altered in accordance with an update. Meaning, what I am about to present does not indicate or fundamentally explain what the August update is all about. Rather, what I’ll show may possibly be one of the numerous ways the update impacted certain sites.
Health Magazine Sites See a Visibility Decrease
As indicated earlier, sites within the health niche were the easiest to identify in terms of tracking movement. At least, that was my personal experience. One of the things that I noticed was that a few health publications were hit as part of the update.
The following sites showed a significant visibility loss in accordance with the August update:
- eatthis.com (30% loss)
- parents.com (13% loss)
- bodybuilding.com (49% loss)
- prevention.com (56% loss)
- verywellfit.com (29% loss)
prevention.com

Interestingly, sites such as heathline.com and medicalnewstoday.com did not show any such decrease (they actually saw an uptick).
After looking at each site, the sites that saw a visibility loss tended to have more ads either on the homepage or within their deeper pages. That is not to say that the sites that did not get hit by the update have no ads. However, there seemed to be a difference in the ad quantity.
I normally would not present such anecdotal information in such a conclusive manner. However, I’ve seen numerous instances of others in the industry indicating the same, most notably is Glen Gabe who also delved into a site’s inner page ad placements.
Just by way of example, here’s a look at an article from eatthis.com:
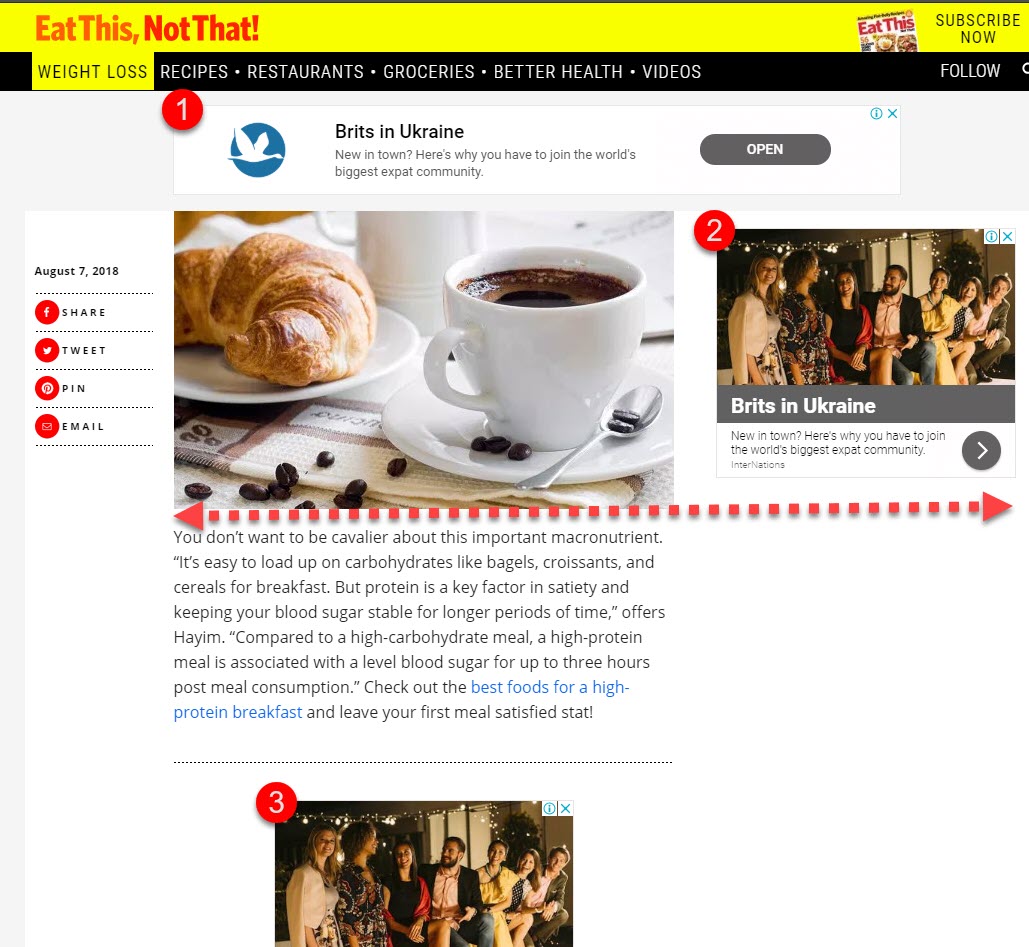
Halfway through the article and the entire page is dominated by ads. More, the width of the page content relative to the ad space diminishes the noticeability of what users came to the page to see. This type of aggressive ad placement could call into question the site’s benefit to a user (more on this later).
Google Page Profiling
I was talking about the update with Rank Ranger founder, Shay Harel. When discussing some of the sites I listed above, Shay thought it was very possible that Google has added a new profiling aspect to their algorithm. There are indicators that Google is now looking at the central intent of a site and comparing it to the content being shown. When the sub-topics or ancillary content either overtakes or does not align to the central intent, Google downgraded the site.
A great example of this is bodybuilding.com. Take a look at the homepage:
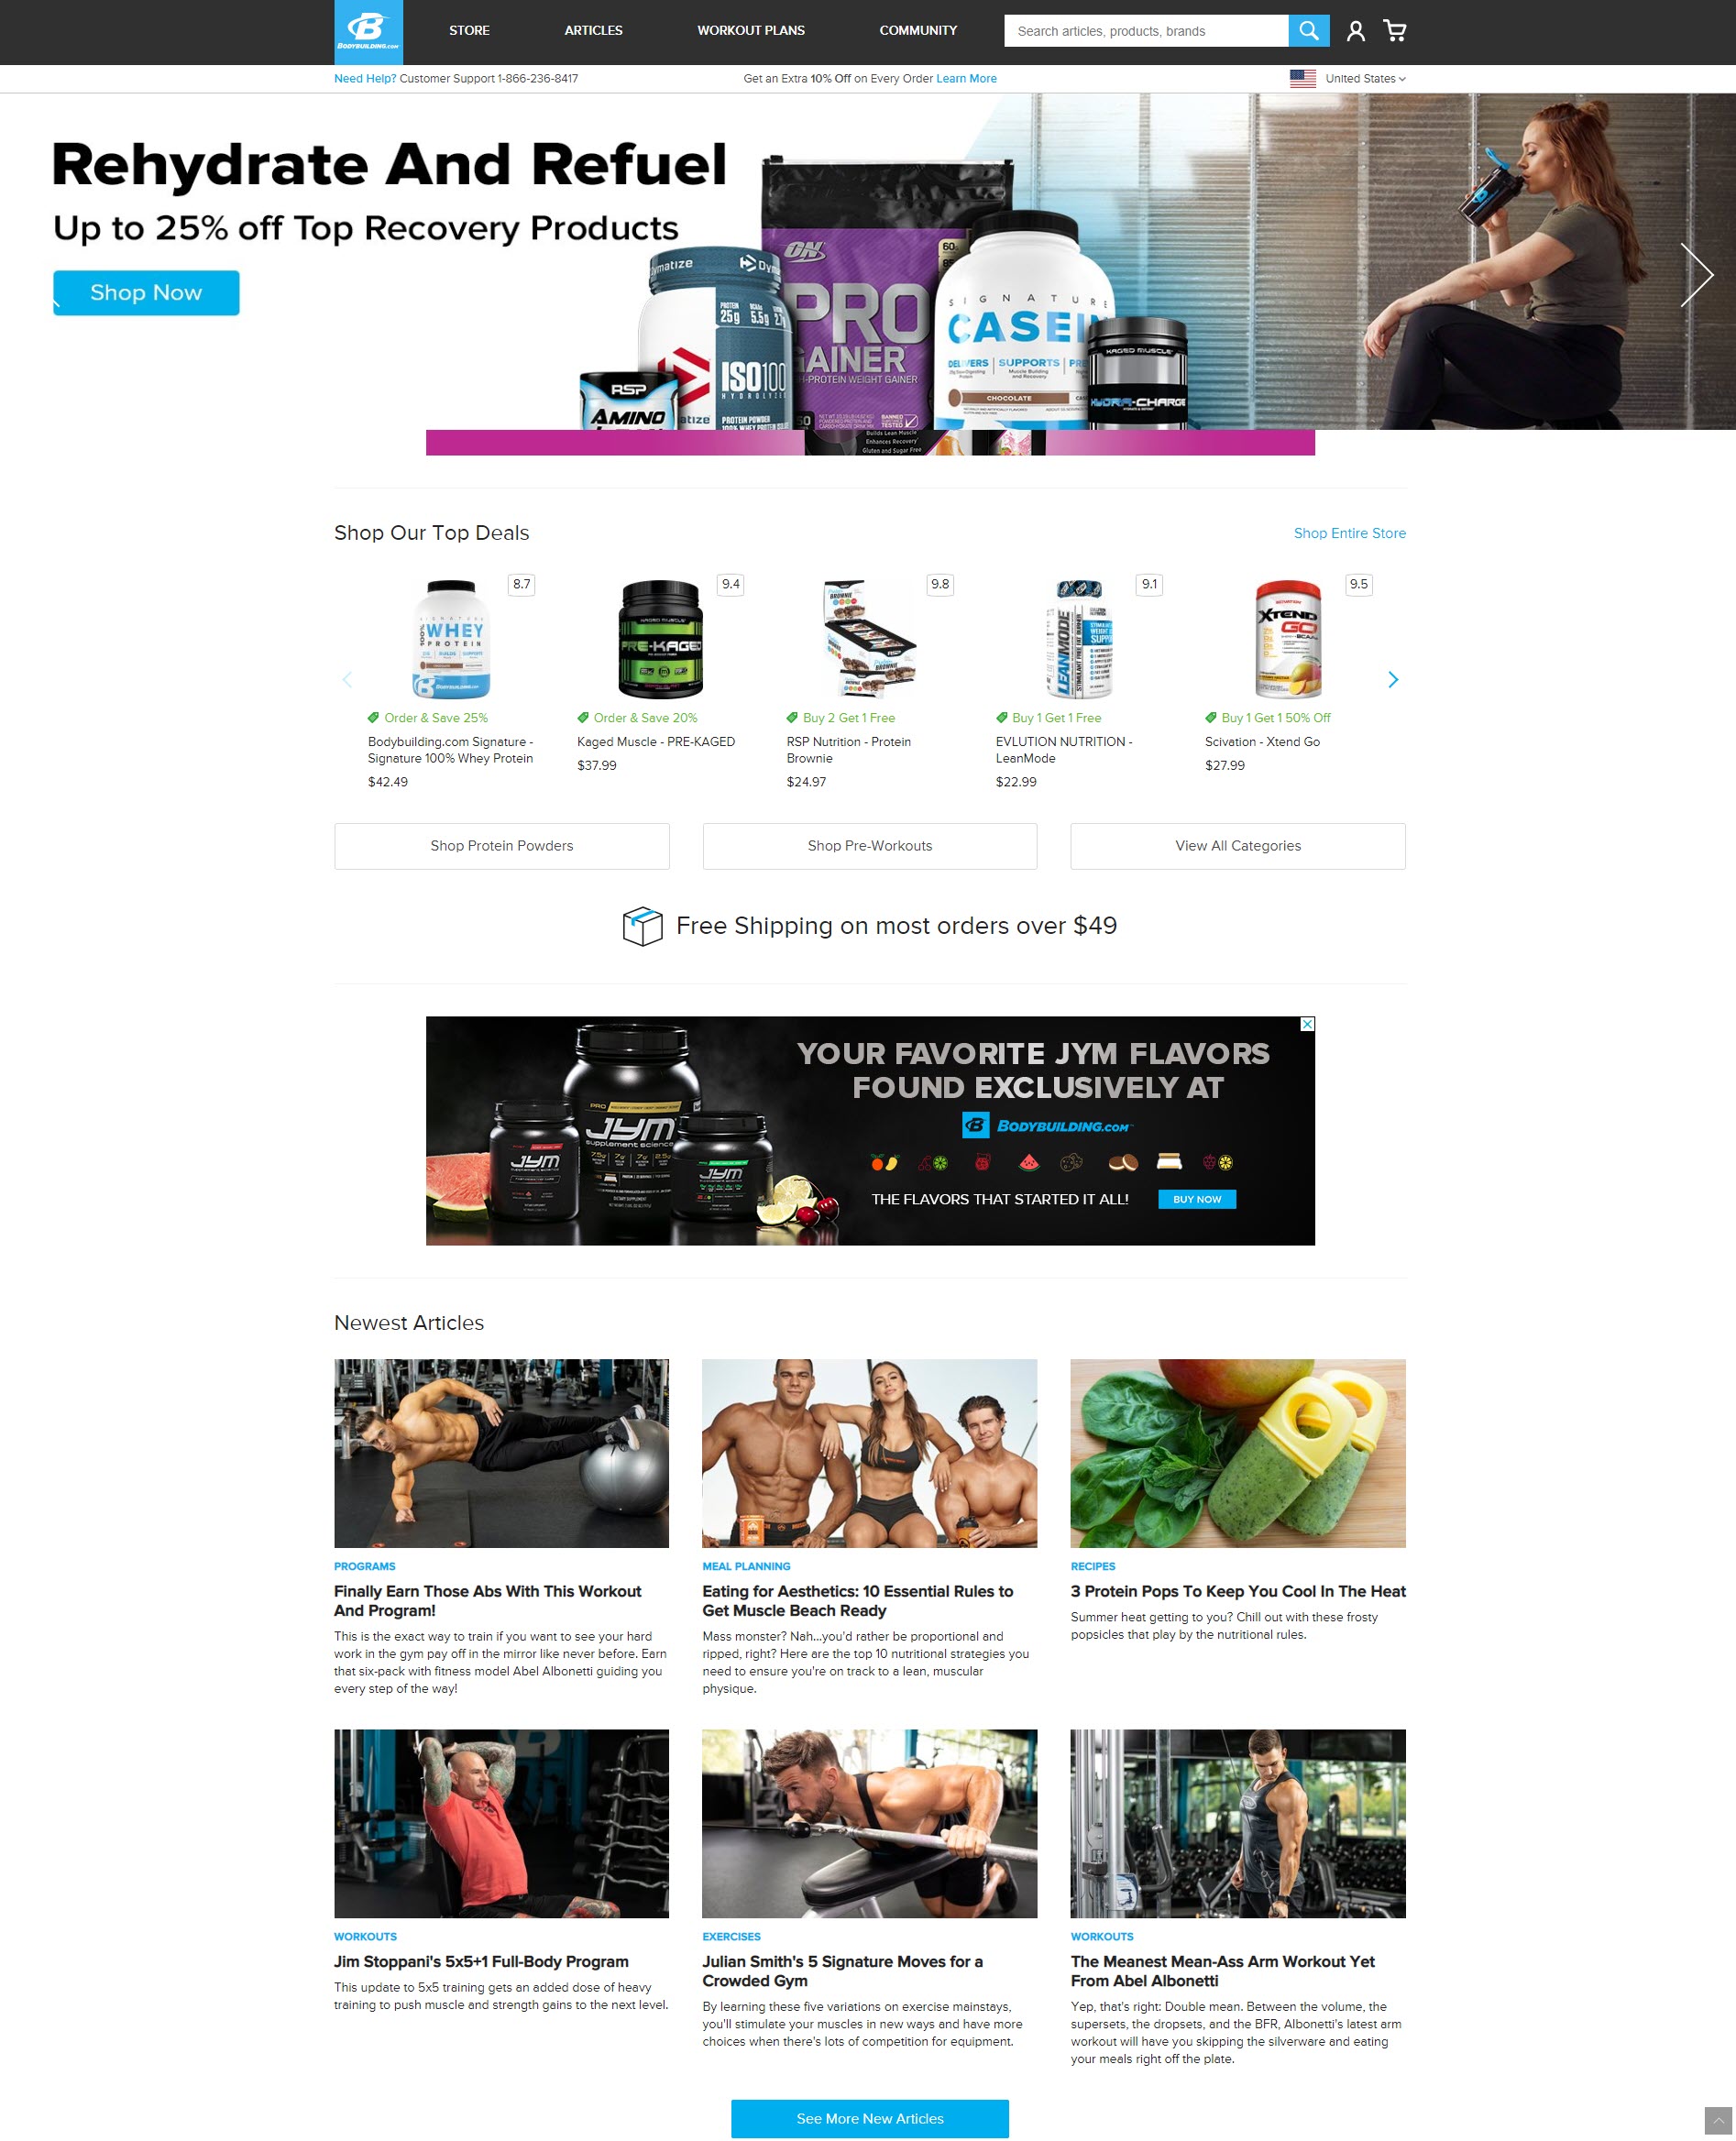
If I asked you what does this site do/offer, and solely looking at the content here – what would you say?
I personally had a hard time pinning down what the site does, I initially thought it sold all sorts of bodybuilding powders.
Now look at how the site describes themselves:
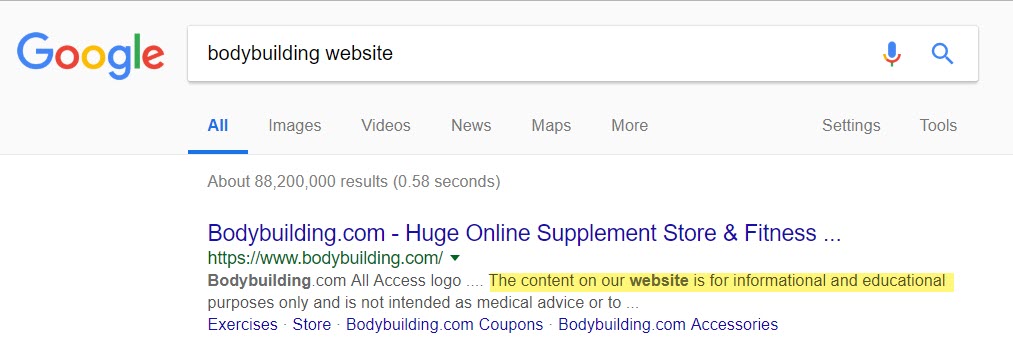
The problem this site faces from an SEO perspective is that its informational and educational content does not even appear above the fold. It seems with this update, Google can better profile sites like this and is aware of the incongruity.
Let me share another example that showcases the same profiling but from a slightly different angle. The medical site draxe.com saw a 65% visibility loss that resulted from the August update.

The August Update saw the health site draxe.com lose significant site visibility
Here’s how the site describes themselves on the SERP:
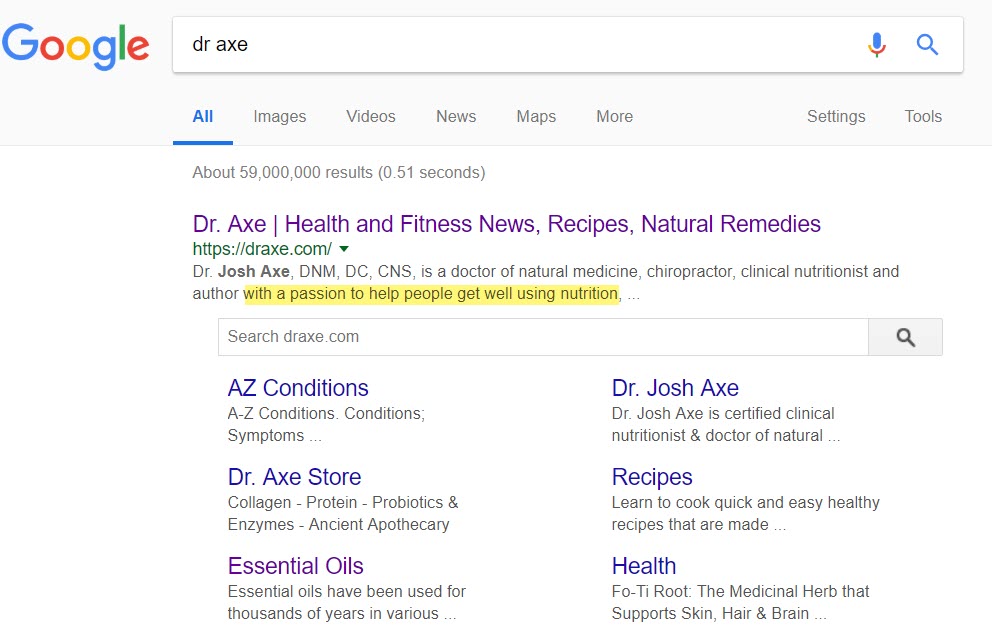
When you look at the homepage, things seem to be in order. Most of the content is indeed about nutrition. However, when you jump into an article you get this:
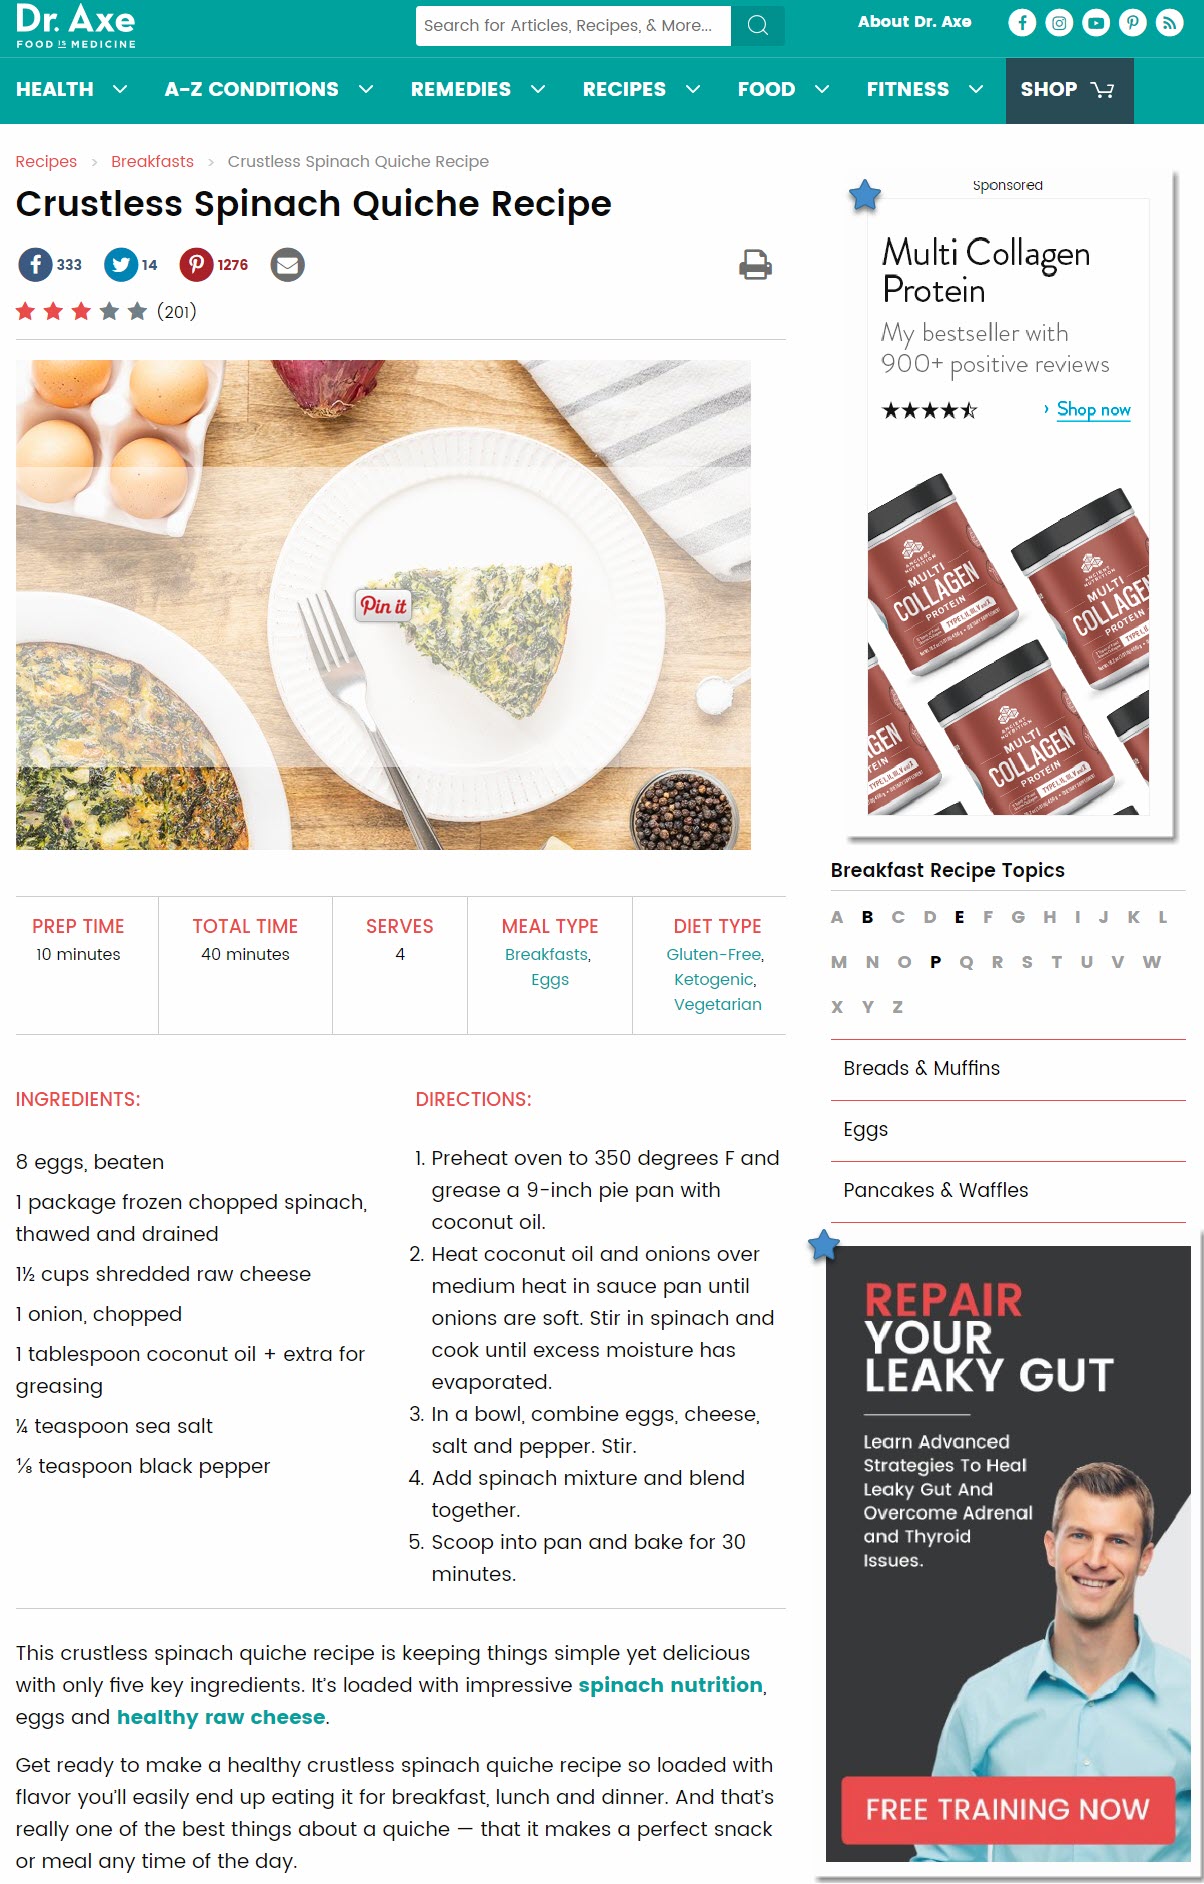
Both of these ads come from the site itself, they are not third-party products. The site is trying to sell users its products/services via the ad space. If we scroll to the bottom of the article, one more such ad appears:

In another article a banner popped up and offered an exclusive offer:
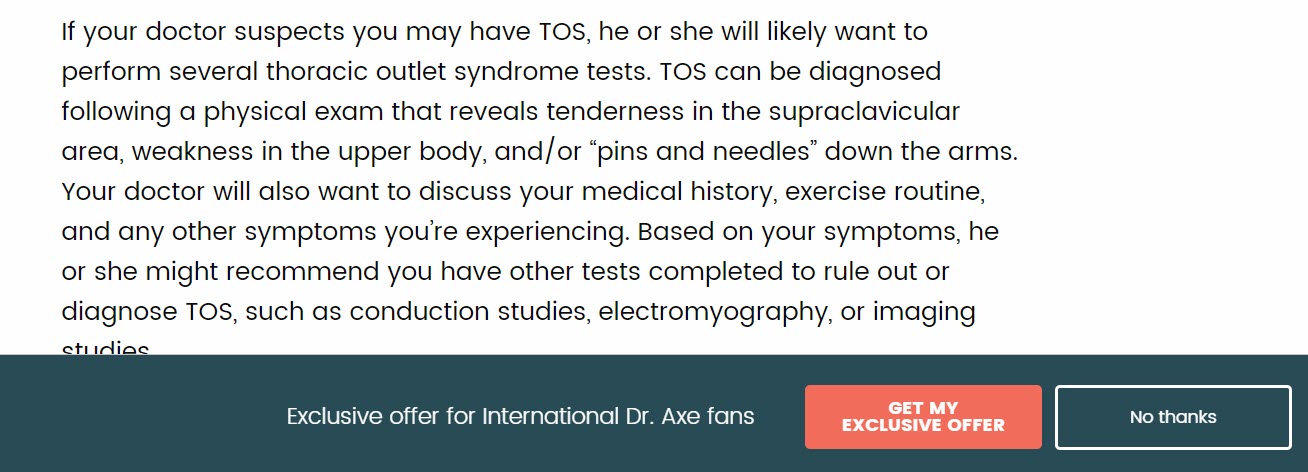
My inclination heavily leans towards the possibility that Google looked at the ads and profiled the site based upon them. While the site per se is not manifestly selling its products in a robust way (i.e., the site appears as a content-based site, not an e-commerce site- though it does have a shopping section), the self-promoting ads create another site profile. According to our theory, Google reclassified the site and adjusted its rankings accordingly.
Updates to the Search Quality Rater Guidelines in Relation to the August Update
Just to give the above some context, let’s not forget that Google very recently updated their Search Quality Rater Guidelines. As it turns out, some of the very patterns I just illustrated became relevant to search quality raters with the guideline update. According to The SEM Post, Google has revised the guidelines with a renewed focus on ensuring that a site’s content is truly ‘helpful’. Content that for all intents and purposes acts as a veil for pushing product does not intuitively fit that guideline. It would appear that Google can now algorithmically make that determination and is asking its quality raters to conform to the new adjustment.
The guidelines also upped the ante on Your Money Your Life (YMYL) sites. These sites predominantly exist within the finance and health niches, which just so happens to be the two niches most impacted by the August update. The new guidelines tell raters that these sites have potential safety ramifications (i.e. poor or bad information here could result in people being ‘hurt’). I don’t think it is coincidental that both the new guidelines and the recent update “call out” sites that exist within the realm of health and finance.
The Connection to the July Update
July 20th saw the roll-out of a more moderate seven-day algorithm update. When you look the July and August updates, but a few days of normal fluctuation levels separate them.
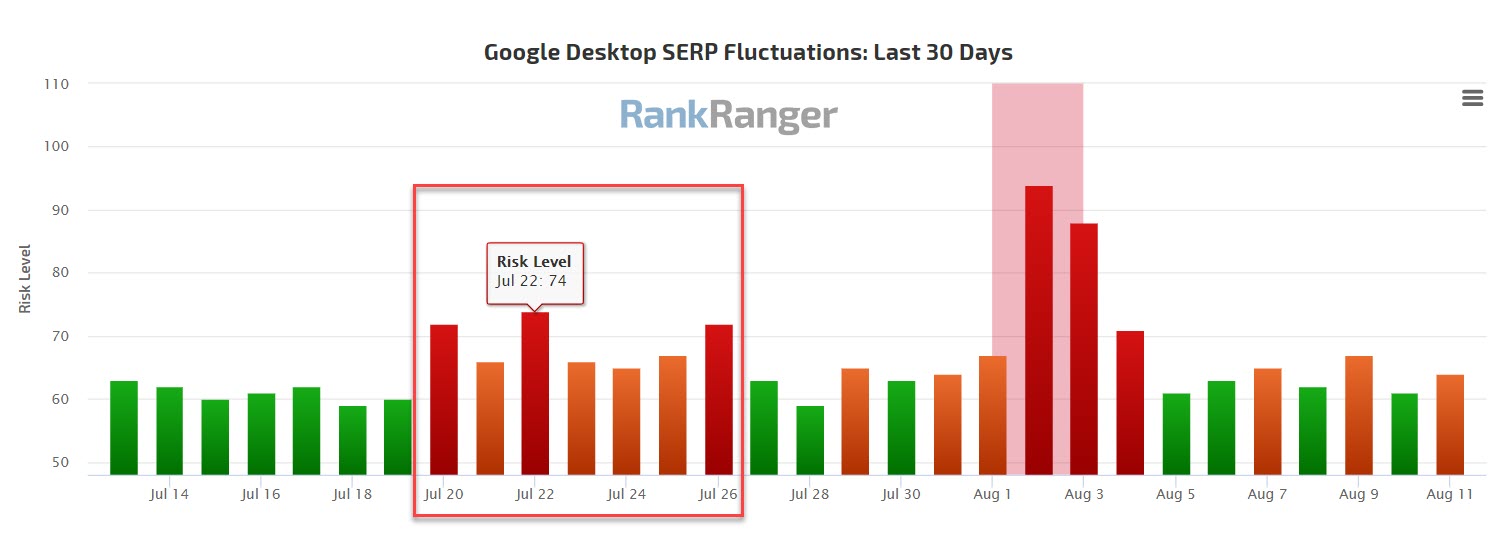
The July 2018 Google update as shown on the Rank Risk Index
Interestingly, some of the sites we tracked within the health niche that saw a nice uptick as a result of the August update also saw similar increases during the July update (thereby pointing to a connection between the two).
webmd.com
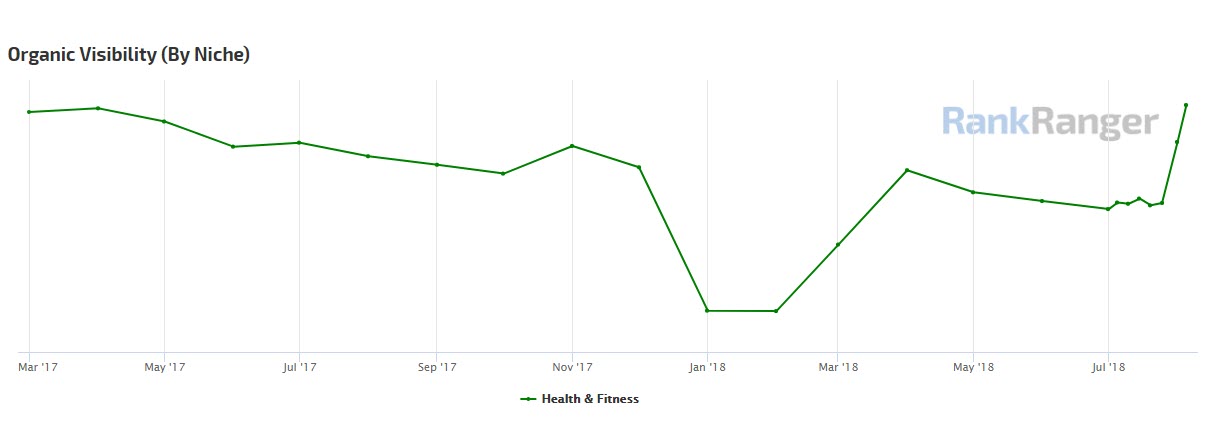
Also interesting is that with the update came a drastic increase in Related Questions (i.e. People Also Ask):

The two could be related. It’s possible that Google used the uptick in the SERP feature to better refine how it understood intent for a variety of queries. Meaning, with more Related Question boxes on the SERP, Google perhaps used its data pertaining to which questions users tended to click on for a given query to better align its notion of intent with actual user intent. With the new knowledge, and just a short week later, Google rolled out its latest broad core algorithm.
Note, I am not saying the updates are 100% directly related, I’m simply proposing a theory that is speculative in nature but that contains intriguing and perhaps compelling elements based on some anecdotal evidence.
What Sites Can Do After Being Hit by the August Google Update

In light of the trends we see towards Google being more able to profile sites, and in consideration of the sites that we believe Google has both profiled and demoted, I suggest sites that
If you are an e-commerce site, show yourself as such. Don’t try to overly soft-sale your products/services by hiding behind ‘helpful content’. This is especially true within the finance and health niches (i.e., Your Money Your Life sites). It would appear that if Google thinks that a site is either too ad focused or is using content as a way to blunt the negative associations of direct and forceful sales tactics, that such a site is not interested in the safety and well-being of the user.
In other words, for YMYL sites, Google very much wants to ensure that you have your user’s well-being at the forefront of your site’s content. An overemphasis on ads, or the use of ads in less than obvious ways, is a signal that user safety is a secondary priority. Now that Google appears to be able to profile sites accordingly, these tactics could result in a loss of rank.
To single out one practice in particular, and based off what I’ve seen when looking at the sites hit: I might strongly consider not using your ads on your site to promote your own products. I believe that Google may see this as a site trying to backhandedly and inconspicuously push its product/service. For sites that should be focused on user safety first and foremost, this practice could easily be perceived as being of a spam-like nature.
I just want to reemphasize: The tips I am offering here are based on the best knowledge I could ascertain. They are not 100% guarantees and may not be applicable in all cases. Analyzing these sorts of updates and offering tips in a concrete manner is a bit precarious in that Google, of course, does not reveal much and the sites impacted don’t often present a clear pattern in a readily discernible manner.
Living on Shaky Ground

A Google Update of this magnitude is unnerving. Not only is the impact real, but there is also a pervasive aura of mystery. I could take this space to rehash the main data points and takeaways. Instead of doing as such, I want to reiterate my sentiments of reservation. It’s a mistake for people to walk away from all the data I’ve presented conclusively defining the update as being related to health and finance sites (i.e., YMYL domains).
I feel the data here can easily be a bit of a red herring. The August 2018 update, or the Medic Update if you want to call it that, hit everything. It was massive. It changed the trajectory of sites across the board, from every niche. To limit this, the biggest update I’ve ever studied to one or two niches is off the mark. That’s not to say there isn’t a significant storyline that revolves around health or finance sites. That’s certainly true. That said, it’s not the entire story.
More than anything else, in these times of living on
That said, what are you seeing? How was your site impacted?
If you think your site was profiled in an all-new way by Google, let me know. I would **** to discuss the possibility of collaborating together to uncover Google’s new possible algorithmic powers.

